JNS 2 (2012) 369-377
Synthesis and Characterization of CuAlS
2Nanoparticles by
Facile Heat Arrested Method
Y. Vahidshad*, R. Ghasemzadeh, A. Irajizad, M. Mirkazemi, A. Masoud
School of Metallurgy and Material Engineering, Iran University of Science and Technology, Tehran 16844, Iran
Abstract
CuAlS2 Chalcopyrite nanocrystalline are synthesized with facile
method. The heat arrested solvothermal method for synthesize
nanocrystalline were investigated. The time duration of synthesis,
temperature of solution and metal salts to solvent molar ratio can be parameters that we are studied. The nanoparticles were synthesized
with CuCl, AlCl3 and thiourea (SC(NH2)2) as precursors, Diehylene
glycol ((CH2CH2OH)2O) and Polyethylene glycol 600
(HO(C2H4O)nH) as solvent and capping agent respectively, and
Ammonia (NH4OH) as reducing agent. The parameters of synthesis
were studied by X-Ray diffraction (XRD) for analysis of structure and by ultraviolet–visible (UV-VIS) spectrophotometer for analysis
of light structure. The possible formation mechanism metal
complexes, sulfur ions and chalcopyrite compound are also discussed.
2012 JNS All rights reserved
Article history: Received 27/8/2012 Accepted 21/11/2012 Published online 1/12/2012
Keywords:
Heat arrested method Poly alcohol
Chalcopyrite Sulfide copper Semiconductor
*Corresponding author: E-mail address:
[email protected] Phone: 98 912 4515282 Fax: +98 21 66282146
1. Introduction
Semiconducting chalcopyrite compounds have
been received special interest because of the optical, electrical and structural properties can
simply be wide-ranging at large extent by varying
of chemical and stoichiometry. In the I-III-VI2
compounds (chalcopyrite), the linear and nonlinear
optical properties, the kind of electrical
conductivity and the band gap can be changed with change of intrinsic composition ratio and can be
covering the wide applications in the
semiconducting industry. Among in the
chalcopyrite semiconductors, CuAlS2 compounds
have a wide band gap around the 3.5eV that useful for ultraviolet absorption [1-5].
There are to general methods to achieve the
chalcopyrite structure. The first method is the use
of H2S gas for passing from the through of
intermetallic compounds. The second method is
use of wet chemical synthesis for chalcopyrite compounds. In these chemical processes there are
not time-consuming, expensive, and complexity of
process beside of the large material losses [6-12].
370
Y. Vahidshad et al./ JNS 2 (2012) 369-377
method is the best because the control of
stoichiometry is simpler and the powders
synthesized have well crystalline without any post
heat treatment [13]. At polyol method we used from high boiling solvent (Oley amine, Diethylene
glycol, Diethanolamine and etc.) and the pressure is ambient pressure. Their method involved the
reduction of precursors in the presence of capping
agent (Oleic acid, Polyethylene glycol, etc) [14].
The chalcopyrite material such as CuInxGa1-xS2,
CuInS2, CuAlS2 and CuFeS2 is more environmental
friendly than selenide chalcopyrite. Nowadays, a low cost technique for the synthesis of the
non-toxic chalcopyrite nanoparticles is most important
for photovoltaic or light emitting diode industries
[15, 16]. In this research, we investigated the
solvothermal reaction without autoclave (polyol)
for CuAlS2 chalcopyrite. We are researching about
the effect of different reaction conditions on the
chalcopyrite formability and structural and optical properties of this compound.
2. Experimental procedure
The precursors used in this process are used copper dichloride, CuCl; aluminum trichloride,
InCl3; thiourea; Diehylene glycol (DEG),
Polyethylene glycol 600 (PEG) and Ammonia.
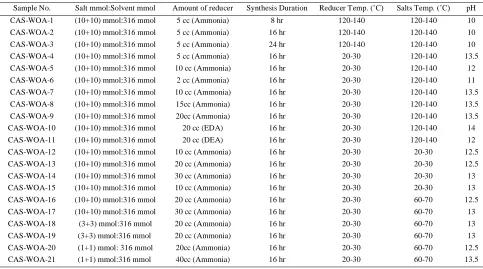
Table 1. Experimental detail for polyol method.
In another vessel, the 40mmol thiourea and amount of reducing agent were dissolved into 10cc
DEG and stirred for at least 60min to obtain a
transparent solution (Solution no. 2). After that the
solution no. 2 was injected into solution 1 at the defined temperatures and stirred for 15 minute. The
solution in the flask quickly turned black color and the coprecipitation reaction lasts for several
minutes. After that the temperature was gained to
200-220˚C for a specified time to achieve
crystalline powders. When it was cooled down to room temperature, the products were centrifuged,
pH Salts Temp. (˚C)
Reducer Temp. (˚C)
Synthesis Duration
Amount of reducer
Salt mmol:Solvent mmol Sample No. 10 120-140 120-140 8 hr 5 cc (Ammonia)
(10+10) mmol:316 mmol CAS-WOA-1 10 120-140 120-140 16 hr 5 cc (Ammonia)
(10+10) mmol:316 mmol CAS-WOA-2 10 120-140 120-140 24 hr 5 cc (Ammonia)
(10+10) mmol:316 mmol CAS-WOA-3 13.5 120-140 20-30 16 hr 5 cc (Ammonia)
(10+10) mmol:316 mmol CAS-WOA-4 12 120-140 20-30 16 hr 10 cc (Ammonia)
(10+10) mmol:316 mmol CAS-WOA-5 11 120-140 20-30 16 hr 2 cc (Ammonia)
(10+10) mmol:316 mmol CAS-WOA-6
13.5 120-140
20-30 16 hr
10 cc (Ammonia) (10+10) mmol:316 mmol
CAS-WOA-7 13.5 120-140 20-30 16 hr 15cc (Ammonia)
(10+10) mmol:316 mmol CAS-WOA-8 13.5 120-140 20-30 16 hr 20cc (Ammonia) (10+10) mmol:316 mmol
CAS-WOA-9
14 120-140
20-30 16 hr
20 cc (EDA) (10+10) mmol:316 mmol
CAS-WOA-10
12 120-140
20-30 16 hr
20 cc (DEA) (10+10) mmol:316 mmol
CAS-WOA-11
12.5 20-30
20-30 16 hr
10 cc (Ammonia) (10+10) mmol:316 mmol
CAS-WOA-12 12.5 20-30 20-30 16 hr 20 cc (Ammonia)
(10+10) mmol:316 mmol CAS-WOA-13
13 20-30
20-30 16 hr
30 cc (Ammonia) (10+10) mmol:316 mmol
CAS-WOA-14
13 20-30
20-30 16 hr
10 cc (Ammonia) (10+10) mmol:316 mmol
CAS-WOA-15
12.5 60-70
20-30 16 hr
20 cc (Ammonia) (10+10) mmol:316 mmol
CAS-WOA-16
13 60-70
20-30 16 hr
30 cc (Ammonia) (10+10) mmol:316 mmol
CAS-WOA-17
13 60-70
20-30 16 hr
20 cc (Ammonia) (3+3) mmol:316 mmol
CAS-WOA-18
13 60-70
20-30 16 hr
20 cc (Ammonia) (3+3) mmol:316 mmol
CAS-WOA-19 12.5 60-70 20-30 16 hr 20cc (Ammonia) (1+1) mmol: 316 mmol
CAS-WOA-20 13.5 60-70 20-30 16 hr 40cc (Ammonia) (1+1) mmol:316 mmol
371 Y. Vahidshad et al./ JNS 2 (2012) 369-377
washed several times by distilled water and ethanol
and finally dried at 60˚C for 10hr at air condition.
See Table 1 for details concerning solution
preparation. The structural and the optical
properties of the CuAlS2 nanoparticles were
characterized using X-ray diffraction spectrometer (XRD, Panalytical MPD), scanning electron
microscope (SEM, Hitachi S-4800), and UV–
Visible spectrophotometer (Ocean Optics In.
USB-4000 optic spectrometer).
3. Results and discussion
The reaction follows an oxidation/reduction rule,
in which AlCl3 and CuCl are reduced by the strong
reducer NH4OH. The electrochemical and E° for
every half-reaction is given by:
0
0 3
0
4 2 2
0 0
( ) 0.5180
( ) 1.660
(2 6 ) 0.092
( ) ( ) 0 (1)
red red
E Cu Cu V
E Al Al V
E NH OH N H O H V
E reduction process E oxidation process
The high chemical potential gap of the two half
reactive species (equation 1) and high temperature
of solvent provides a strong reaction dynamic. then this is resulted to produce a supersaturation large
enough to overcome the energy barrier of
nucleation as a reductive agent is injected in. Amount of reducer is very important because the
standard reduction potential for Al3+ is more
negative than to ammonia and we need adequate amounts of ammonia for reducing of aluminum
ions. The mechanism of reaction in this polyol
method can be described as following. At solution of 1, the metals salt was solved as ion and then was
complex with DEG (equation 2, 3):
3 2 2 2
3 3
2 2 2
2 2 2
1 2 2 2
3( )
3( ) ) 3 ( ) (2)
3( )
3( ) ) ( ) (3)
AlCl HOCH CH O
Al HOCH CH O Cl Al DEG
CuCl HOCH CH O
Cu HOCH CH O Cl Cu DEG
Also, the PEG as a capping agent forms stable
complexes with the precursor on the nanocrystal
surface (carboxylic COOH and amine NH2
ligands), which slows the nucleation and growth process, leading to reducing the reaction rate
(fig.1):
Fig.1. Schematic of capping agent forms.
At solution no. 2, the thiourea and NH4OH have
been solved as ion and reducing agent and ion of
S2- is formed:
2 2 2 2 2 4
2
3 2 2 2 2
4 ( ) 3( ) 8
4 12 4 3( ) ) 8 (4)
SC NH HOCH CH O NH OH
S NH CO HOCH CH O O H
When the solution no. 2 (equation 4) is injected
into the solution no. 1, fast nucleation is followed
by slower nanocrystal growth. This reaction mechanism can be explained based on formatiom
of [Cu(DEG)2]1+ and [Al(DEG)2]3+ complex and
then decomposition and reaction with S2- for
formation of chalcopyrite nanocrystal:
1
3 22
( ) ( ) 2 (5)
Cu DEG Al DEG S CuAlS DEG
After nanocrystals formation (equation 5),
environment situation (high temperature) derives
the sample to reach a crystalline phase. The effect of salt to solvent molar ration and amount of
372
Y. Vahidshad et al./ JNS 2 (2012) 369-377
the other parameters. In the first stage of
experimental design, we study the effect of heat
treatment duration and pH on the chalcopyrite
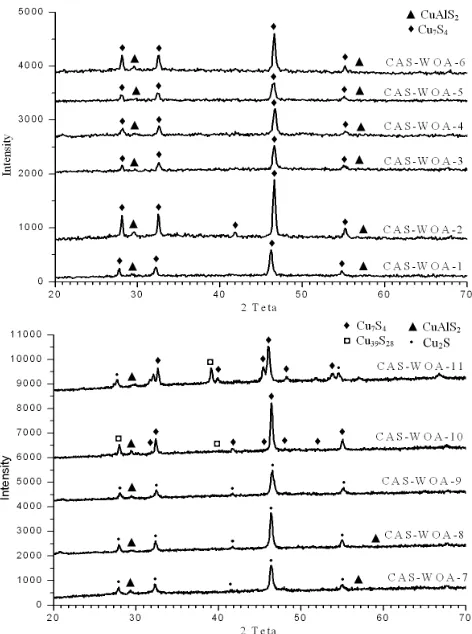
formability. Figure 2a shows the chalcopyrite was
formed very weakly and the CuxS (JCPDS
23-0960, 23-0961, 36-0380 and 33-0489) was the major phase (CAS-WOA-1 to 6). In second stage,
three of samples (CAS-WOA-7, 8 and 9), we used
more amount of reducer for study of chalcopyrite
formability but the copper sulfide still was the major phase and the chalcopyrite was formed too
weakly. Also we used from different type of reducer and we have seen no change in the
chalcopyrite formability CAS-WOA-10 and 11
samples (figure 2b). In the third stage we
synthesized six samples with more amount of reducer than before but still chalcopyrite phase was
formed weaker than copper sulfide (figure 3a). At least, in the fourth stage, according to previous
results we founded the salt to solvent molar ratio
was the most influence in the synthesis and formability of aluminum chalcopyrite structure. As
a result, we synthesized four samples with lower
amount of precursors in the solvent.
Figure 3b shows that the chalcopyrite structure
forms in these samples. The CAS-WOA-21 was
the best condition synthesis for chalcopyrite formability (JCPDS 25-0014) and the three main
peaks and planes of chalcopyrite structure were at
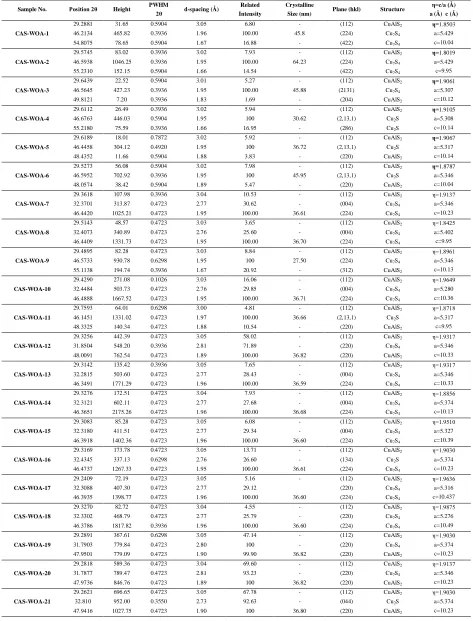
47.941 (220), 29.262 (112), 59.379 (116). The calculation results such as peak position, lattice
constant, crystalline size and the tetragonal
distortion were given in table 2. However, from all of the synthesized samples observed that the lateral
phase copper sulfide was formed in the any
condition, but it could be more or less according to
the test conditions. The crystallite size could be determined by considering full width of main
diffraction peak in Scherrer equation [17]:
0.9
(6) cos
d
The calculation results are given in table 2 and
show that the size of the all samples is nanometer.
Fig 2. X-ray diffraction patterns of CuAlS2 for (a) first
stage and (b) second stage experimental design.
Fig 3. X-ray diffraction patterns of CuAlS2 for third
373
Y. Vahidshad et al./ JNS 2 (2012) 369-377
Table 2. Experimental detail for polyol method.
η=c/a (Å)
a (Å) c (Å) Structure Plane (hkl) Crystalline Size (nm) Related Intensity d-spacing (Å) PWHM 2θ Height Position 2θ Sample No. η=1.8503 a=5.429 c=10.04 CuAlS2 (112) -6.80 3.05 0.5904 31.65 29.2881
CAS-WOA-1 46.2134 465.82 0.3936 1.96 100.00 45.8 (224) Cu7S4 Cu7S4 (422) -16.88 1.67 0.5904 78.65 54.8075 η=1.8019 a=5.429 c=9.95 CuAlS2 (112) -7.93 3.02 0.3936 83.02 29.5745
CAS-WOA-2 46.5938 1046.25 0.3936 1.95 100.00 64.23 (224) Cu7S4 Cu7S4 (422) -14.54 1.66 0.5904 152.15 55.2310 η=1.9061 a=5.307 c=10.12 CuAlS2 (112) -5.27 3.01 0.5904 22.52 29.6439
CAS-WOA-3 46.5645 427.23 0.3936 1.95 100.00 45.88 (2131) Cu7S4 CuAlS2 (204) -1.69 1.83 0.3936 7.20 49.8121 η=1.9105 a=5.308 c=10.14 CuAlS2 (112) -5.94 3.02 0.3936 26.49 29.6112
CAS-WOA-4 46.6763 446.03 0.5904 1.95 100 30.62 (2,13,1) Cu2S Cu2S (286) -16.95 1.66 0.3936 75.59 55.2180 η=1.9067 a=5.317 c=10.14 CuAlS2 (112) -5.92 3.02 0.7872 18.01 29.6189
CAS-WOA-5 46.4458 304.12 0.4920 1.95 100 36.72 (2,13,1) Cu2S CuAlS2 (220) -3.83 1.88 0.5904 11.66 48.4352 η=1.8787 a=5.346 c=10.04 CuAlS2 (112) -7.98 3.02 0.5904 56.08 29.5273
CAS-WOA-6 46.5952 702.92 0.3936 1.95 100 45.95 (2,13,1) Cu2S CuAlS2 (220) -5.47 1.89 0.5904 38.42 48.0574 η=1.9137 a=5.346 c=10.23 CuAlS2 (112) -10.53 3.04 0.3936 107.98 29.3618
CAS-WOA-7 32.3701 313.87 0.4723 2.77 30.62 - (004) Cu7S4 Cu7S4 (224) 36.61 100.00 1.95 0.4723 1025.21 46.4420 η=1.8425 a=5.402 c=9.95 CuAlS2 (112) -3.65 3.03 0.4723 48.57 29.5143
CAS-WOA-8 32.4073 340.89 0.4723 2.76 25.60 - (004) Cu7S4 Cu7S4 (224) 36.70 100.00 1.95 0.4723 1331.73 46.4409 η=1.8961 a=5.346 c=10.13 CuAlS2 (112) -8.84 3.03 0.4723 82.28 29.4895
CAS-WOA-9 46.5733 930.78 0.6298 1.95 100 27.50 (224) Cu7S4 CuAlS2 (312) -20.92 1.67 0.3936 194.74 55.1138 η=1.9649 a=5.280 c=10.36 CuAlS2 (112) -16.06 3.03 0.1026 271.08 29.4290
CAS-WOA-10 32.4484 503.73 0.4723 2.76 29.85 - (004) Cu7S4 Cu7S4 (224) 36.71 100.00 1.95 0.4723 1667.52 46.4888 η=1.8718 a=5.317 c=9.95 CuAlS2 (112) -4.81 3.00 0.6298 64.01 29.7593
CAS-WOA-11 46.1451 1331.02 0.4723 1.97 100.00 36.66 (2,13,1) Cu2S CuAlS2 (220) -10.54 1.88 0.4723 140.34 48.3325 η=1.9317 a=5.346 c=10.33 CuAlS2 (112) -58.02 3.05 0.4723 442.39 29.3256
CAS-WOA-12 31.8504 548.20 0.3936 2.81 71.89 - (220) Cu7S4 CuAlS2 (220) 36.82 100.00 1.89 0.4723 762.54 48.0091 η=1.9317 a=5.346 c=10.33 CuAlS2 (112) -7.65 3.05 0.3936 135.42 29.3142
CAS-WOA-13 32.2815 503.60 0.4723 2.77 28.43 - (004) Cu7S4 Cu7S4 (224) 36.59 100.00 1.96 0.4723 1771.29 46.3491 η=1.8856 a=5.374 c=10.13 CuAlS2 (112) -7.93 3.04 0.4723 172.51 29.3276
CAS-WOA-14 32.3121 602.11 0.4723 2.77 27.68 - (004) Cu7S4 Cu7S4 (224) 36.68 100.00 1.96 0.4723 2175.26 46.3651 η=1.9510 a=5.327 c=10.39 CuAlS2 (112) -6.08 3.05 0.4723 85.28 29.3083
CAS-WOA-15 32.3180 411.51 0.4723 2.77 29.34 - (004) Cu7S4 Cu7S4 (224) 36.60 100.00 1.96 0.4723 1402.36 46.3918 η=1.9030 a=5.374 c=10.23 CuAlS2 (112) -13.71 3.05 0.4723 173.78 29.3169
CAS-WOA-16 32.4345 337.13 0.6298 2.76 26.60 - (134) Cu2S Cu7S4 (224) 36.61 100.00 1.95 0.4723 1267.33 46.4737 η=1.9636 a=5.316 c=10.437 CuAlS2 (112) -5.16 3.05 0.4723 72.19 29.2409
CAS-WOA-17 32.3088 407.30 0.4723 2.77 29.12 (220) Cu7S4 Cu7S4 (224) 36.60 100.00 1.96 0.4723 1398.77 46.3935 η=1.9875 a=5.276 c=10.49 CuAlS2 (112) -4.55 3.04 0.4723 82.72 29.3270
CAS-WOA-18 32.3302 468.79 0.4723 2.77 25.79 - (220) Cu7S4 Cu7S4 (224) 36.60 100.00 1.96 0.3936 1817.82 46.3786 η=1.9030 a=5.374 c=10.23 CuAlS2 (112) -47.14 3.05 0.6298 367.61 29.2891
CAS-WOA-19 31.7903 779.84 0.4723 2.80 100 - (220) Cu7S4 CuAlS2 (220) 36.82 99.90 1.90 0.4723 779.09 47.9501 η=1.9137 a=5.346 c=10.23 CuAlS2 (112) -69.60 3.04 0.4723 589.36 29.2818
CAS-WOA-20 31.7877 789.47 0.4723 2.81 93.23 - (220) Cu7S4 CuAlS2 (220) 36.82 100 1.89 0.4723 846.76 47.9736 η=1.9030 a=5.374 c=10.23 CuAlS2 (112) -67.78 3.05 0.4723 696.65 29.2621
374
Y. Vahidshad et al./ JNS 2 (2012) 369-377
The optical properties of nanocrystalline are
determined from absorbance measurement in the
range of 200–1100nm carried out on the colloidal
nanocrystalline. The absorption coefficient (α)
could be obtained from Beer–Lambert law:
0
1
ln I 2.303 A (7)
d I d
Where A is absorption of nanocrystallite
obtained from spectrometer and d is a
nanocrystallite diameter (equation 7). The band
gap is determined from Tauc’s equation:
( h )n c h( Eg) (8)
Where c is a constant, Eg was the band gap, n is
the index indicating the type of the transition. It is
known that the values of n for direct, indirect,
forbidden direct and indirect optical transitions in equation 8 are 0.5, 2, 1.5 and 3, respectively
[18-21].
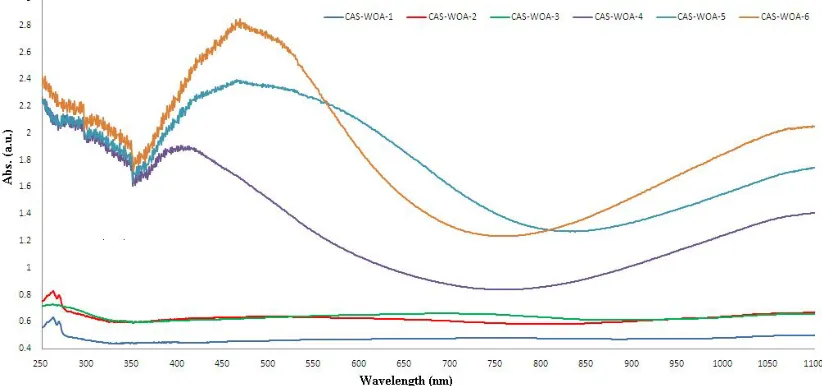
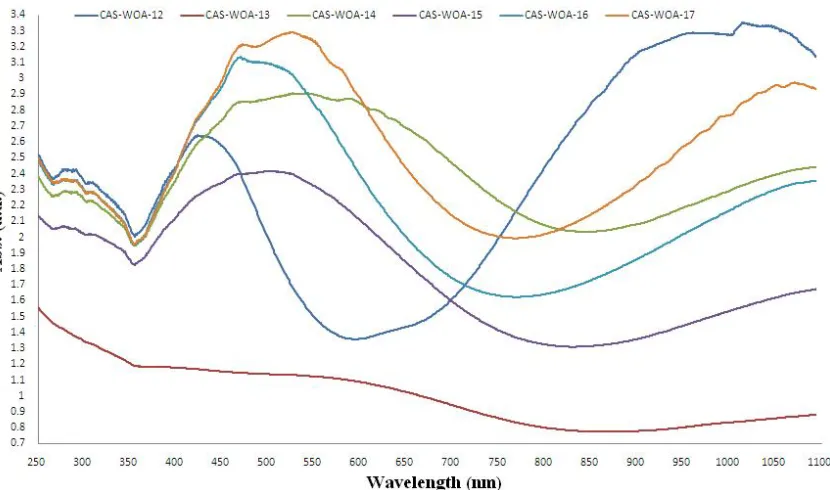
Figure 4 to 7 are the plots of absorbance against
wavelength in the UV and VIS region for samples
CAS-WOA-1 to CAS-WOA-21. The derived date
from pictures shows that the chalcopyrite phase
and most phases of CuxS (x=1-2) are exited in the
synthesized samples. The edge of absorbance in
the around the 324-369nm is for CuAlS2
chalcopyrite but CuxS compounds show different
values of the optical properties for each phase.
At this research, two absorption regions can be
observed for CuxS in the absorption graphs; the
widening of the 383-664nm and 747-1002nm is for
CuxS compounds. This wide of absorbance is
based on type of CuxS formability such as Cu2S,
Cu7S4, Cu39S28 and Cu1.765S. Table 3 shows the
absorption edge and band gap for all of the synthesized samples. The samples were dispersed
in a mixture of methanol and ethylene glycol under
intense sonication of 15 min and also a mixture as
a reference (the samples were dispersed with 0.3mg/ml). The band gap of samples is calculated
by MATLAB software based on the data derived from UV-Vis spectrophotometer data. Also, the
optical band gap of synthesized nanocrystalline can
be calculated from the extrapolation of the linear
portion of the (αhν)2 plots versus hν to α = 0.
375 Y. Vahidshad et al./ JNS 2 (2012) 369-377
Fig. 5. UV-Vis spectra determined for second experimental design of synthesized samples.
376
Y. Vahidshad et al./ JNS 2 (2012) 369-377
Fig.7. UV-Vis spectra determined for fourth experimental design of synthesized samples.
Table 3. UV-Vis results for synthesized samples Band gap (eV) Edge of Absorption (nm)
CuxS
compounds CuAlS2
CuxS
compounds CuAlS2
Sample No.
1.33 2.98 4.14 890 410 324 CAS-WOA-1
1.22 3.05 4.08 808 440 347 CAS-WOA-2
1.21 3.07 3.33 891 446 353 CAS-WOA-3
2.09 2.82 3.82 769 446 353 CAS-WOA-4
1.56 2.79 3.70 839 433 354 CAS-WOA-5
1.88 2.80 3.48 761 446 353 CAS-WOA-6
1.64 2.65 3.34 807 514 355 CAS-WOA-7
1.88 2.77 3.64 748 458 354 CAS-WOA-8
1.76 2.82 3.70 747 383 353 CAS-WOA-9
1.27 2.60 4.13 838 -369 CAS-WOA-10
1.43 2.63 3.42 947 505 354 CAS-WOA-11
2.24 2.72 3.79 1002 590 355 CAS-WOA-12
1.45 2.86 4.26 880 -358 CAS-WOA-13
1.38 2.64 3.66 841 575 356 CAS-WOA-14
1.60 2.50 3.45 833 -355 CAS-WOA-15
1.75 2.71 3.71 772 -356 CAS-WOA-16
1.36 2.71 3.71 770 483 356 CAS-WOA-17
1.67 2.60 3.50 849 -355 CAS-WOA-18
1.87 2.75 3.68 1002 664 355 CAS-WOA-19
2.30 2.66 3.51
-599 358 CAS-WOA-20
1.84 2.56 3.65 925 623 355 CAS-WOA-21
Figure 8 shows curves of (αhν)2 vs. hν for the
CuAlS2 nanocrystalline. Based on table 3, the
direct energy gap Eg of the nanocrystalline has
been calculated and there are between 3.33 to
4.26eV. The difference in band gap calculated may
be attributed to shallow level (i.e., donor and acceptor level) present in between the valence and
conduction bands or effect of crystalline size.
377 Y. Vahidshad et al./ JNS 2 (2012) 369-377
4. Conclusion
In this paper we reported the preparation of the
CuAlS2 chalcopyrite nanocrystalline using the
polyol method. Complex mixtures of copper
sulfides (CuxS, x=1-2) and aluminum chalcopyrite
were obtained. X-ray diffraction pattern confirms that the molar ratio of salt to the solvent and the
reducer solvent are very effective on the formation
of the chalcopyrite phase. The lateral phase copper
sulfide is formed in every situation, but in optimal conditions of synthesis of the copper sulfide
chalcopyrite phase has the highest value. The optimal conditions for synthesis are as follows:
molar ratio of metal salts to DEG is 2 to 316. Also,
the amount of ammonia as reducer is 20cc for
2mmol of metal salts.
Acknowledgment
This work has been financially supported by
Engineering Research Institute and Iran University
of Science and Technology and Sharif University of Technology.
References
[1]
S. Kodigala, Cu(In1-xGax)Se2 Based Thin FilmSolar Cells, Academic Press, 2010.
[2] G. Harichandran, N.P. Lalla, Materials Letters 62
(2008) 1267–1269.
[3] M. Caglar, S. Ilican, Y. Caglar, Optics
Communications 281 (2008) 1615–1624.
[4] G.H. Yue, X. Wang, L.S. Wang, W. Wang, D.L.
Peng, Physics Letters A 372 (2008) 5995–5998. [5] Yu-Hsiang A. Wang, N. Bao, A. Gupta, Solid
State Sciences 12 (2010) 387–390.
[6] G. Chen, L. Wang, X. sheng, H. Liu, X. Pi,
D.Yang, Journal of alloys and compounds, (2010) 317-321.
[7] G. Chen, L. Wang, X. sheng, D.Yang, Journal of
sol-gel science and technology 58 (2011)
162-169.
[8] P. Luo, P. Yu, R. Zuo, J.Jin, Y. Ding, J. Song, Y. Chen, Physica B 405 (2010) 3294-3298.
[9] M. S. Park, S. Y. Han, E.J. Lee, C. H. Chang, S. O. Ryu, Current Applied Physics 10 (2010)
5379-5382.
[10] H. Wei, W. Guo, Y. Sun, Z. Yang, Y. Zhang,
Materials letters 64 (2010) 1424-1426.
[11] J. Zhou, S. Li, X. Gong, Y. Yang, L. You, Y.
Guo, Materials Lettes 65 (2011) 3465-3467. [12] A. E. Pop, V. Popescu, M. Danila, M. N. Batin,
Chalcogenide Letters 8 (2011) 363 – 370.
[13] B. L. Cushing, V. L. Kolesnichenko, and C. J.
O’Connor, Chemical Reviews 104 (2004) 3893−3946.
[14] M. S. Park, S. Y. Han, E. J. Bae, T. J. Lee, C. H. Chang, S. O. Ryu, Current Applied Physics 10
(2010) S379–S382.
[15] C. Steinhagen, M. G. Panthani, V. Akhavan, B. Goodfellow, B. Koo, B. A. Korgel, Journal of
American Chemical Society, (2009), 131, 12554–
12555.
[16] L. Z. Pei, J. F. Wang, X. X. Tao, S. B. Wang, Y.
P. Dong, C. G. Fan, Q. F. Zhang, Materials
Characterization 62 (2011) 354 – 359.
[17] A.L. Fahrenbruch, R.H. Bube, Fundamentals of
Solar Cells, Academic Press, New York, 1983.
[18] R. Swanepoel, J. Phys. E: Sci. Instrum. 16 (1983) 1214-1222.
[19] A.E. Rakhshani, J. Appl. Phys. 81 (1997)
7988-7993.
[20] N. Jamali, M. M. B. Mohagheghee, A. Youssefi,
Iranian Physics Conference, Condensed
Matterial: Nano-Structures (2011) 1383-1386.