Vol. 16, 2019, 11-22
ISSN: 2349-0632 (P), 2349-0640 (online) Published 12 April 2019
www.researchmathsci.org
DOI: http://dx.doi.org/10.22457/jmi.137av16a2
11
Journal of
Measuring Productivity of Construction Industry in
Vietnam: Based on Data Envelopment Analysis (DEA)
Method from 2007-2016
Li Wei1 and Le Y Nhi2
School of Economics and Management
Chongqing University of Posts and Telecommunications, Chongqing-400065, China. 1email: [email protected]
2
Corresponding author. email:[email protected]
Received 28 February 2019; accepted 29 March 2019
Abstract. Data envelopment analysis (DEA) measures the relative efficiency of
decision-making units and avoids any functional specification to express production relationship between inputs and outputs. DEA-based Malmquist productivity index (MPI) measures the productivity change over time. In this paper, the MPI is used to measure the productivity changes of Vietnamese construction industry from 2007 to 2016. The results of analyses indicate that productivity of the Vietnamese construction industry experienced a continuous improvement from 2007 to 2016. It is found that there are gaps in productivity development level among six regions in the Vietnamese construction industry. The DEA-based MPI approach provides a good tool to support setting up policies and strategic decisions for improving the performance of the Vietnamese construction industry and promoting the sustainable development of the industry between different regions.
Keywords: Construction; DEA; Efficiency; Total factor productivity AMS Mathematics Subject Classification (2010): 91Cxx
1.Introduction
The construction industry is one of the major economic sectors in Vietnam. It has been widely recognized that the industry plays a vital role in the process of economic growth [1], as illustrated by the following data. Vietnamese construction industry registered a growth rate of 9.1% in 2016, measured at constant 2010 US dollar exchange rates. This was preceded by annual growth rates of 10.8%, 7.6%, 5.9% and 6.4% in 2012, 2013, 2014 and 2015 respectively. This growth was supported by economic recovery, coupled with government investment in infrastructure and residential construction, and the increased issuance of building permits. Vietnam Statistical Yearbook, 2016.
12
after Vietnam’s entry into the World Trade Organization (WTO) in 2006, effect approaches and tools must be adopted to analyze the efficiency and productivity growth of the industry dynamically and continuously in depth. Also, the competitiveness of the construction industry can be enhanced through effective decision making and productivity improvement.
Productivity is not the only one determinant of economic growth, it does provide a measure of economic prosperity and degree of competitiveness of an industry though. Valuable information about the effectiveness of economic policies can be provided by productivity analysis and, thus, provide a useful tool in policy design to improve economic development and industry performance [2].
Envelopment Analysis (DEA) Method from 2007-2016
13
construction benchmarking models and a new construction benchmarking model that provides a performance metric for measuring firm performance on a company-wide basis and supports trade-off analysis among various performance metrics. Their models also tie the resources expended by construction firms to how well those overall firms performance. Additionally, the proposed models provide managers guidance in determining how specific company resources can be reallocated to lead to superior overall company performance. Castro-Lacouture et al. [24] developed an optimization tool for purchasing decisions in B2B construction marketplaces based on the theory of DEA. They addressed the purchase of construction materials as the last component in the construction supply chain. Cheng et al. [25] introduced the application of data envelopment analysis (DEA) as an alternative credit-scoring model. Chiang et al. [26] introduced the DEA method to input-output (I−O) analyses. DEA method was used to calculate the relative efficiency for each industrial sector based on inputs and outputs of an I−O table. They discussed a numerical example based on the Japanese case. Based upon their research results, strategies and policies could be formulated to overcome difficulties and problems faced by the construction related companies, the construction sector as a whole, and the government as well.
The Malmquist index, which measures productivity change over time, was first introduced by Malmquist [27] as a quantity index for use in the analysis of consumption of inputs. The MPI was suggested by Caves et al. [28], who extended the idea of Malmquist. The input-based MPI is defined as the ratio of two input functions by Caves et al. [28], while assuming no technical inefficiency. Färe et al. [29] integrated the method of measuring efficiency from Farrel with the method of measuring productivity from Caves et al. [28] to develop a DEA-based Malmquist index of productivity change using input and output data. This DEA-based MPI has become a popular tool for measuring productivity change of DMUs over time.
14
further analyzing the two Malmquist components: technical change and frontier shift. They believe that their new approach not only reveals patterns of productivity change and presents a new presentation along with the managerial implications of each Malmquist component, but also identified the strategy shifts of individual DMUs based on isoquant changes. González and Gasón [17] estimated MPIs and divided them into tour sources of productivity change to analyze the evolution of the productive patterns in a sample of 80 pharmaceutical laboratories that operated in Spain from 1994 to 2000. Asmild et al. [1] proposed a combination of approaches, combining DEA window analysis with the Malmquist index approach, to calculate efficiency scores and show the Canadian banking industry’s progress over 2 decades (1981–2000). Odeck [24] used a DEA-based Malmquist index to measure productivity growth in target achievements of the operational units of the Norwegian Public Roads Administration (NPRA) charged with traffic-safety services. His DEA framework applied corresponds to a BCC [17] model with unique constant input. Camanho and Dyson [3] used DEA and Malmquist indices to develop measures for comparing groups of DMUs and illustrated the approach with an application to assess the performance of commercial bank branches in Portugal. The analysis involved the construction of an index reflecting the relative performance of branches in four different regions, which can be decomposed into an index for the comparison of within-group efficiency spread, evaluating internal managerial efficiencies, and an index for the comparison of frontier productivity, reflecting the impact of environmental factors and regional managerial policies on branches’ productivity.
The combination of DEA method and Malmquist index allows not only to evaluate the changes in relative productivity but also to determine the factors affecting change (technological change or technological change). All of those support reasons why I go to the thesis Measuring the Malmquist productivity indices (MPIs) of the Vietnamese construction industry by using the data envelopment analysis (DEA) approach over the period of 2007–2016.
In summary MPIs are divided into different components to derive detailed information when applying the DEA-based MPIs to analyze the productivity change in a specific industry. In this paper, the MPI is divided into two components, i.e., the change in technical efficiency and the shift of empirical production frontier, to measure the productivity change of the Vietnamese construction industry from 2007 to 2016. The next section describes the concepts of MPIs and outlines the theoretical foundation of the DEA method of measuring MPI. Its application to the Chinese construction industry is presented and discussed. The conclusions are drawn in the last section.
2. Methodology
2.1. Model of DEA-based malmquist productivity index
Suppose there are n DMUs, each DMUj (j=1, 2,…,n) produces a vector of outputs = ( ,…, ) = by using a vector of inputs = ( ,…, ) at each time period t, t = 1,. . .,T. The DEA model at the time period t can be formulated as follows [13]:
, =
Envelopment Analysis (DEA) Method from 2007-2016
15
≥
≥ 0, = 1, … ,
where = ( ,…, ) and = ( ,…, ) = input and output vectors of DMU0 among others. Note that model (1) is input-oriented constant return to scale (CRS) DEA model. Returns to scale are technical properties of the production function. If we increase the quantity of all factors employed by the same (proportional) amount, output will increase. These three basic outcomes can be identified, respectively, as increasing returns to scale, constant returns to scale, and decreasing returns to scale. The major property of constant returns to scale production functions is that both the average productivities and the marginal productivities of factors are independent of the scale of production, i.e., they depend on factor proportions only.
The efficiency ∗ ∗= , determines the amount by which observed inputs can be proportionally reduced, while still producing the given output level. If
= 1, then DMU0 is efficient in time period t. In this condition, DMU0 is unable to
proportionally reduce its inputs and reaches on the empirical production frontier (EPF). If
∗< 1, then DMU0 is inefficient and can reduce its inputs. This shows that DMU0 is
operating below the EPF [8].
From t to t+1, DMU0’s technical efficiency may change or (and) EPF may shift. MPI can be calculated via the following steps (Färe et al. 1994a; Zhu 2002):
1. Comparing to the EPF at time t, i.e., calculating , in model (1); 2. Comparing " to the EPF at time t+1, i.e., calculating "", " via the following linear program:
"", " =
. . ∑"≤ "(2)
" ≥ "
≥ 0, = 1, … ,
3. Comparing to the EPF at time t+1, i.e., calculating ", via the following linear program:
", =
. . ∑"≤ (3)
" ≥
≥ 0, = 1, … ,
4. Comparing " to the EPF at time t, i.e., calculating " , via the following linear program:
", " =
16
≥ "
≥ 0, = 1, … ,
The MPI is defined as:
#$% = &", , " """, , " ' (⁄
The MPI0 measures the productivity change between periods t and t+1. Productivity declines if MPI0 >1, remains unchanged if MPI0 =1, and improves if MPI0 < 1.
The MPI0 can be divided into two components [29].
#$% = "", , "&""", , """, , ' (⁄
where the first component on the right hand side measures the change in technical efficiency (TEC) between periods t and t+1, so that
*+, = "", , "
The second component, which is the geometric mean, measures the EPF shift (EPFS) between periods t and t+1, so that
+$-. = &""", , """, , ' (⁄
Then, the MPI0 can be formulated as follows: MPI0 = TEC0 · EPFS0
If the value of EPFS0 is less than 1, it signifies a positive shift or technical progress. If the value of EPFS0 is greater than 1, it indicates a negative shift or technical regress, and if the value of EPFS0 is equal to 1, it signifies no shift in EPF [29].
2.2. Data and DMU selection
All DMUs in the industry use four inputsx1,x2,x3 and x4 to produce four outputsy1,y2
,y3 and y4. The data used in this study came from the Statistical Yearbook of Vietnam
Envelopment Analysis (DEA) Method from 2007-2016
17
3. Empirical analysis
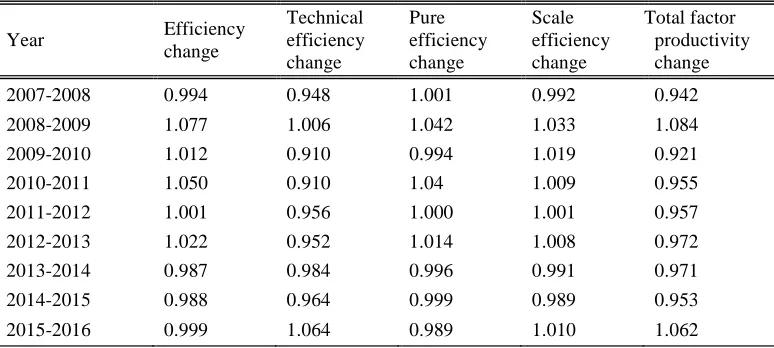
Based on the data discussed in Section 2.2 including inputs (number of businesses, number of laborers, capital, non-current assets) as well as outputs (total revenue, net business revenue, benefit before tax, taxes and others payable to the State budget), the writer apply DEAP software to calculate efficiency change, technical change, pure efficiency change, scale efficiency change, total facts productivity change for six areas. The results are shown in Table 1.
Table 1: Average Malmquist Productivity Index of Vietnamese Construction Industry
Analyzed results show that in the research period, generally Malmquist indicators: Index of efficiency change (effch), technical change (techch), pure efficiency change (pech), scale efficiency change (sech), total facts productivity change (tfpch) of most stages is less than or approximately 1, which indicates decline in productivity and operational efficiency during this period was caused by a decline productivity, performance of construction industry of the following year compared to the previous year. During this period, only effch and sech were approximately 1, and other indicators were quite small leading to the tfpch index is smaller than 1. Except for the period of 2007 - 2008 Malmquist indicators: effch, techch , sech, tfpch of the 2008-2009 and 2011-2012 periods are all larger than 1, so there has been a recovery in production, the productivity of construction companies in year 2009 and year 2012 increased compared to 2008 and 2011 increased compared to 2012. This is also reasonable as in 2009, construction companies received support from the government's policy and the second bailout package, focusing on improving technology, improving technology to save costs in a financial crisis and global recession. This recovery, however, is only temporary, not enough to help the construction industry gain the desired growth (The evidence is that right after this period, all indicators fell sharply).
Throughout the study period, the average values of the indicators: technical efficiency (techch) change = 0.966 smaller than 1. It implies that the performance of the construction industry needs further improvement.The technical productivity and
Year Efficiency change
Technical efficiency change
Pure efficiency change
Scale efficiency change
Total factor productivity change
2007-2008 0.994 0.948 1.001 0.992 0.942
2008-2009 1.077 1.006 1.042 1.033 1.084
2009-2010 1.012 0.910 0.994 1.019 0.921
2010-2011 1.050 0.910 1.04 1.009 0.955
2011-2012 1.001 0.956 1.000 1.001 0.957
2012-2013 1.022 0.952 1.014 1.008 0.972
2013-2014 0.987 0.984 0.996 0.991 0.971
2014-2015 0.988 0.964 0.999 0.989 0.953
18
efficiency of the use of inputs has decreased during this period, construction companies have used an increasing amount of inputs to produce the same outputsin comparison with other industries. Therefore, in order to improve the productivity of the construction industry, it is necessary to renovate the technology, rationalize production, improve management and improve the labor standards of workers.
The average index of scale effectively change (sech) is approximate 1 and almost maintains stability around this level. Thus, according to construction industry scale, productivity is almost unchanged during the study period, which can be explained by the fact that the construction industry activities during this period are effective mainly thanks to the expansion of quantity, the improvement of the scale of operation has not yet been implemented strongly. However, the construction industry's activities in this period still have a fairly reasonable scale.
Total factor productivity (TFP - Total Factor Productivity) is an indicator that reflects the production results by improving the efficiency of using inputs (tangible factors), basing on the impact of invisible factors such as technological innovation, production rationalization, management improvement, improvement of workers' labor standards and the like (general referred as total factors).
The total factor productivity change (tfpch) = 0.979 in the study period is less than 1, indicating that productivity has decreased during this period. The speed of productivity increase of the total factors also reflects the speed of scientific and technological progress. IT is a general indicator reflecting the rapid and slow progress of scientific and technological progress in a certain period time. Table 1 shows that although effchand pech is biger than 1, techch and sech are smaller than 1 which reduced the result of total facts productivity change index.
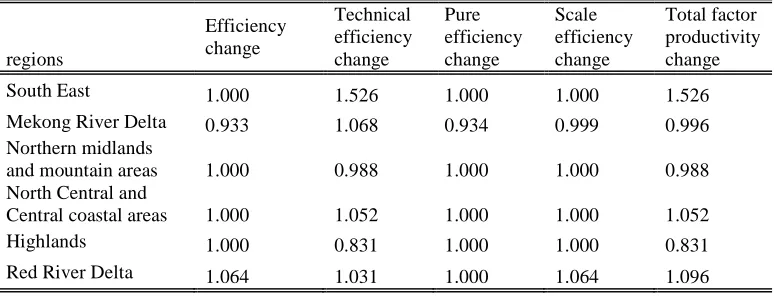
Table 2: Average Malmquist Productivity Index of Vietnamese Construction in six regions
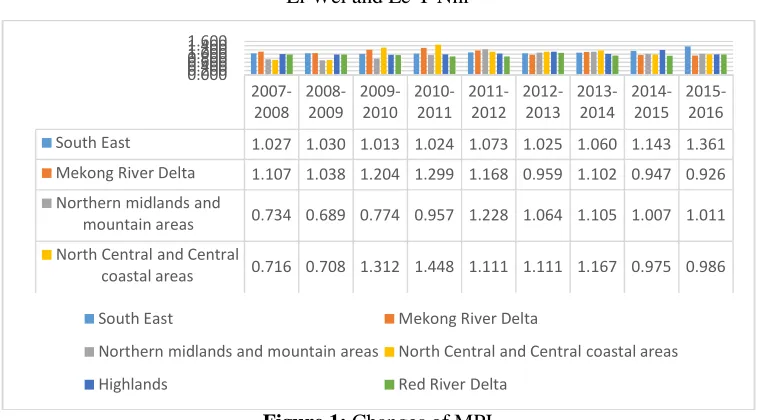
Table 2 reports the MPI of the Vietnamese construction of six regions industry in different time period. The researcher first analyze the data of the south east region reported in Tables 2. The values of MPI are greater than 1 in the reported period, which indicates the decline of productivity in the south east regions from 2007 to 2016. The productivity of the construction industry in south east regionimproves during the time period and markedly increases from 2015 to 2016 (Fig 1)
regions
Efficiency change
Technical efficiency change
Pure efficiency change
Scale efficiency change
Total factor productivity change
South East 1.000 1.526 1.000 1.000 1.526
Mekong River Delta 0.933 1.068 0.934 0.999 0.996 Northern midlands
and mountain areas 1.000 0.988 1.000 1.000 0.988 North Central and
Central coastal areas 1.000 1.052 1.000 1.000 1.052 Highlands 1.000 0.831 1.000 1.000 0.831
Envelopment Analysis (DEA) Method from 2007-2016
19
Regarding the Mekong River Delta region, its productivity of the construction industry declined during the time period 2007-2016, except for the period 2009-2010, 2010-2011. The improvement of productivity in the time period 2008-2009 is the highest during the time periods.
For the North Central and North Coastal areas the productivity of the construction industry improves respectively during the time period from 2007 to 2019, except for the periods 2011–2012 and 2014-2015. The improvement of productivity in the time period 2009–2010 is the highest during the time periods and among the six regions. The construction industry in Northern midlands and mountain areas also has this phenomenon in the time period 2011-2012.
According to Fig.1, it is obvious that the productivity of construction industry in Highland region experienced an improvement during the time period 2007-2016, except period 2015-2016. The construction industry in the Red River Delta region almost improves and only slightly declines in 2010-2011, 2013-2014 periods. Overall, there is an improvement in productivity from 2007 to 2016.
Looking at the industry average of the Vietnamese construction industry, it can be seen that the productivity of the industry respectively improved in the time periods 2009-2010, 2010-2011. It is worthwhile to note that the productivity of the Vietnamese construction industry starts to decline in 2011-2012, after experiencing continuous improvement from 2007 to 2011.
Comparing the four regions with the industry average (see Table 2 and Fig. 1), it can be found that the improvement of productivity in Northern midlands and mountain areas and Highland is less than the improvement of productivity of the industry average, and the improvement of productivity in Mekong River Delta and south east regions is greater than the industry average. Furthermore, the improvement of productivity in the Red River Delta region is less than the other regions in most time periods. In summary, there are still gaps in the productivity level between different regions in the Vietnamese construction industry, especially the improvement of productivity in the south east region, as this is more prominent than the other five regions.
4. Conclusions
It is widely known that the DEAmodel can avoid using functional specification to express production relationships between inputs and outputs. The DEA-based MPI approach has been applied to measure the productivity in various industries by many researchers. The input-oriented CRS DEA-based MPIs are used to measure the productivity changes of the Vietnamese construction industry over the time period from 2007-2016 based on eightindicators.
20
Figure 1: Changes of MPI
The above approach has an overview and provides important information about efficiency change, technical efficiency change and the total facts productivity of the construction industry in Vietnam. Since then, it would support for managers, policy makers and investors in making policies, measures to improve efficiency and productivity for Vietnam's construction industry. However, the study of productivity changes associated with other factors (such as performance, factors affecting performance ...) based on the DEA model,could be carried out for a longer period of time, will provide more accurate and valuable information for the construction industry in particular and for the whole economy in general. The above mentioned issues will be the direction for future studies to be carried out in the future.
REFERENCES
1. M.Asmild, J.Paradi, V.Aggarwall and C.Schaffnit, Combining DEA window analysis with the Malmquist index approach in a study of the Canadian banking industry, J. Prod. Anal., 21 (2004) 67–89.
2. R.D.Banker, A.Charnes and W.W.Copper, Some models for estimating technical and scale efficiency in data envelopment analysis, Manage. Sci., 30(9) (1984) 1078–1092. 3. A.S.Camanho and R.G.Dyson, Data envelopment analysis and Malmquist indices for
measuring group performance, J. Prod. Anal., 26 (2006) 35–49.
4. D.Castro-Lacouture, A.L.Medaglia and M.Skibniewski, Supply chain optimization tool for purchasing decisions in B2B construction marketplaces, Autom. Constr., 16 (2007) 569–575.
5. D.W.Caves, L.R.Christensen and W.E.Diewert, The economic theory of index numbers and the measurement of input, output, and productivity, Econometrica, 50(6) (1982) 1393–1414.
6. A.A.Charnes, W.W.Cooper and E.Rhodes, Measuring the efficiency of decision making units, Eur. J. Oper. Res., 2(6) (1978) 429–444.
2007-2008
2008-2009
2009-2010
2010-2011
2011-2012
2012-2013
2013-2014
2014-2015
2015-2016
South East 1.027 1.030 1.013 1.024 1.073 1.025 1.060 1.143 1.361
Mekong River Delta 1.107 1.038 1.204 1.299 1.168 0.959 1.102 0.947 0.926
Northern midlands and
mountain areas 0.734 0.689 0.774 0.957 1.228 1.064 1.105 1.007 1.011
North Central and Central
coastal areas 0.716 0.708 1.312 1.448 1.111 1.111 1.167 0.975 0.986
0.000 0.200 0.400 0.600 0.800 1.000 1.200 1.400 1.600
South East Mekong River Delta
Northern midlands and mountain areas North Central and Central coastal areas
Envelopment Analysis (DEA) Method from 2007-2016
21
7. K.W.Chau, S.W.Poon, Y.S.Wang and L.L.Lu, Technological progress and the productive efficiency of construction firms in Hong Kong 1981–2001, J. Constr. Res., 6 (2005) 195–207.
8. Y.Chen, A nonradial Malmquist productivity index with an illustrative application to Chinese major industries, Int. J. Prod. Econ., 83(1) (2003) 27–35.
9. Y.Chen and A.I.Ali, DEA Malmquist productivity measure: New insights with an application to computer industry, Eur. J. Oper. Res., in press.
10. E.W.L.Cheng, Y.H.Chiang and B.S.Tang, Alternative approach to credit scoring by DEA: Evaluating borrowers with respect to PFI projects, Build. Environ., 42 (2007) 1752–1760.
11. Y.H.Chiang, E.W.L.Cheng and B.S.Tang, Examining representations of consump -tions and inputs placed on the construction sector by use of I-O tables and DEA,
Build. Environ., 41 (2006) 1–11.
12. M.S.El-Meshaleh, R.E.Minchin and W.J.O’Brien, Management of construction firm performance using benchmarking, J. Manage. Eng., 23(1) (2007) 10–17.
13. R.Färe, S.Grosskopf, B.Lindgren and P.Roos, Productivity change in Swedish pharmacies 1980-1989: A nonparametric Malmquist approach, J. Prod. Anal., 3 (1992) 85–102.
14. R.Färe, S.Grosskopf, B.Lindgren and P.Roos, Productivity developments in Swedish hospitals: A Malmquist output index approach, Data envelopment analysis: Theory, methodology and applications, A.Charnes, W.W.Cooper, A.Y.Lewin, and L.M.Seiford, eds., Kluwer Academic, Boston (1994).
15. R.Färe, S.Grosskopf and C.A.K.Lovell, Production frontiers, Cambridge University Press, Cambridge, U.K (1994).
16. M.J.Farrell, The measurement of productivity efficiency. J. R. Stat. Soc. Ser. A (Gen.) 120(3) (1957) 253–281.
17. E.González and F.Gasón, Sources of productivity growth in the Spanish pharmaceu -tical industry (1994–2000), Res. Policy, in press.
18. E.Grifell-Tatjé and C.A.K.Lovell, Deregulation and productivity decline: The case of Spanish savings banks, European Economic Review, 40(6) (1996) 1281–1303. 19. P.Lall, A.M.Featherstone and D.W.Norman, Productivity growth in the western
hemisphere (1978-94): The Caribbean in perspective, J. Prod. Anal., 17 (2002) 213– 231.
20. Y.J.Lu and P.W.Fox, The construction industry in China: Its image, employment prospects, and skill requirement, International Labour Office, Geneva, Switzerland (2001).
21. S.Mahadevan, A DEA approach to understanding the productivity growth of Malaysia’s manufacturing industries, Asia Pac. J. Manage., 19 (2002) 587–600. 22. S.Malmquist, Index numbers and indifference surfaces, Trabajos de Estatistica, 4
(1953) 209–242.
23. B.McCabe, V.Tran and J.Ramani, Construction prequalification using data envelopment analysis, Can. J. Civ. Eng., 32 (2005) 183–193.
22
25. V.Shestalova, Sequential Malmquist indices of productivity growth: An application to OECD industries activities, J. Prod. Anal., 19 (2003) 211–226.
26. T.Sueyoshi and M.Goto, Slack-adjusted DEA for time series analysis: Performance measurement of Japanese electric power generation industry in 1984–1993, Eur. J.
Oper. Res., 133 (2001) 232–259.
27. F.Taskin and O.Zaim, Catching-up and innovation in high and low-income countries,
Econ. Lett., 54(1) (1997) 93–100.
28. Y.B.Yun, H.Nakayama, andT.Tannino, A generalized model for data envelopment analysis, Eur. J. Oper. Res., 157 (2004) 87–105.