Issues
ISSN: 2146-4138
available at http: www.econjournals.com
International Journal of Economics and Financial Issues, 2017, 7(2), 733-738.
Study of Commitment Items Quality Members Effect on Price
Synchronism in Tehran Stock Exchange
Morteza Doosti Seyyed Shekari
1, Babak Jamshidinavid
2*
1Department of Accounting, Collage of Humanities, Kermanshah science and Research Branch, Islamic Azad University,
Kermanshah, Iran, 2Department of Accounting, College of Humanities, Kermanshah Branch, Islamic Azad University, Kermanshah,
Iran. *Email: [email protected]
ABSTRACT
Accounting profit always as an exhibited item in financial statements has been considered by investors whom are attended as the most significant users of financial statements, so profit is a basis for the most economical decisions. In the research, effect of committing item quality members with price synchronism (a criterion to measure the proportional amount of corporating special information, which has been reflected in price) has been investigated in accepted corporations in Tehran stock exchange. In research, committing item quality members are independent variables and price synchronism is dependent variable. Price synchronism is an amplitude which shows industry and market returns and stock return differences in corporation level. The research is application based on its aim, is measuring and describing based on its performance and is one of the best. 127 corporations from 2010 to 2014 have been chosen by systematic deletion. To test research hypotheses panel data method and fixed effect method have been used. Research conclusions show that there is no relationship between involuntary commitment items qualities with price synchronism, but there is a meaningful direct effect between voluntary committing items with price synchronism for accepted corporations in Tehran stock exchange.
Keywords: Commitment Items Quality, Involuntary Commitment Items Quality, Price Synchronism
JEL Classifications: E37, E32, C53, C5
1. INTRODUCTION
Accounting profit always as an exhibited item in financial
statements has been considered by investors whom are attended
as the most significant users of financial statements, so profit is a
basis for the most economical decisions. One of the characteristics
of stock exchange is parting ownership from their management. So, the situation is created for managers to exclusively access information and exhibit financial information. This characteristic
and commitment accounting characteristic because of postpones
(difference between cash profit and commitment profit), reward motivations, profit smoothing, and rule regulating give managers
motivations and situations to invest information for ejection their
benefits against other groups benefits, in otherwise managers want to create profit managers works (Mashayekhi et al., 2014). Accounting profit is produced by commitment system. Some of the users believe that financial statements are instruments for corporations
operation evaluation. Corporations operation evaluation mean total
evaluation of financial situations and operations conclusions to make logical decisions. Profit, as an important basic accessible information
for users, can be changed by managers with different motivations.
Corporations managers for intended profit report try to direct profit
management. Price synchronism means limitation of corporation return which is described by industry and market returns and use of low price synchronism means low effect of industry information on
price (Arab et al., 2006).
This research wants to answer to this question “Whether commitment items quality members effect on corporations stock price synchronism in Tehran stock exchange or not?”
2. REVIEW OF RELATED LITERATURE
price. Hirshleifer et al. (2003), and Healy and James (1999), defined stock return synchronism as an attribution amount of
industry and market returns to describe corporation stock return
changes. So, it can be said that price synchronism is equal to
division of the systematic risk ratio on unsystematic risk. Stock price behavior will follow market movement and corporation
special information. Market movement is included different topics such as internal, external, political and etc. and corporation
special information is related to the corporation. So, investors
can trust more to dependent corporation profit of the corporation special information. When the relationship between corporation return and market return (price synchronism) is low, it shows
corporation special information more. So, low price synchronism of corporations stock show that their prices are dependent less on a market movement because market actives trust to corporation special information more.
Dopuch et al. (2005) investigated the relationship between commitment items and cash flow with stock market measure.
They found many positive relationships between commitment item measure and stock market. However, negative relationship
existed between cash flows and stock market.
Thomas and Zhang (2002) investigated the relationship between commitment quality and disclosure quality and showed that how
these variables for the description of time serial changes had been used interchangeably in fort fuses durations.
Chan et al. (2013) investigate the relationship between
commitment items and stock future return and concluded that the stock market of corporations with high commitment
item in next duration of financial information reporting would decrease. These findings indicate that time investors would discover profit low quality and the stock price would decrease
with delay, too.
2.1. Research Hypotheses
Two following hypotheses would be introduced based on research theoretical bases and review of literature:
• Involuntary commitment items’ quality effect on price
synchronism.
• Voluntary commitment items’ quality effect on price
synchronism.
3. RESEARCH METHODOLOGY
The research is an applicational research based on its aim, and is correlative research based on research hypotheses deduction. Eviews 7 has been used to analyze research data. The panel data method has been used, but before research data analysis, variables lasting should be investigated.
As said before, research is an applicational one, so describing and
analyzing methods have been used to answer research questions.
The dominant view on the research atmosphere of systematic view is based on system view. The research is a sectional one based on its time because it has been done in one duration time and searched realities. It is an applicational criterion based
on applicational researches. For research performance levels
both library and squaring data gathering methods have been
used. Research information has been gathered by referring to
corporations financial statements sites in stock exchange and
Rahnavard software.
Research statistic population includes all accepted corporations
in Tehran stock exchange from 1389 to 1393 which have been
chosen by systematic deletion, but 127 corporations have been considered as research statistic population. It should be said that
each corporation includes 5 collections of exploitable financial information in financial statements and other related information
sources.
3.1. Variables Defining and Introducing
This research has two kinds of variables, dependent variable and independent variables.
In the first hypothesis involuntary commitment items quality
are independent variables and price synchronism is dependent variable.
In the second hypothesis voluntary commitment items quality
are independent variables and price synchronism is dependent variable.
3.2. Commitment Items Quality
Commitment item quality has been created by corporation profit nearness with cash flows degrees. To measure involuntary and voluntary commitment item quality Francis et al. (2004) model
should be used. Many researchers have used this model to
investigate the effect of the degree of the involuntary factors
on commitment items quality which have been introduced as
follows:
Francis et al. (2005) model:
AQi,t = λ0+λ1sizei,t+λ2δ(CFO)i,t+λ3δ(sales)i,t+λ4OperCyclei,t+
λ5NegEarni,t+µi,t
AQi,t = Commitment quality of i corporation in t year
Sizei,t = Corporation size in t year
δ(size)i,t = Standard deviation cash flow of I corporation operation
in t year
δ(sales)i,t = Standard deviation of received income from I corporation sale in t year
OperCyclei,t = i corporation operation logarithm cycle, which is
needed time amount to change the cash flow into productions or services until related demands come back as cash flow to cycle
NegEarni,t = Numbers of years during 6 years studied profit before
the unusual item has been less than zero
Size = Log (all assets values).
To calculate commitment items quality Dechow and Dychv (2002)
model has been used:
TCAi,t = β0+β1*CFOi,t−1+β2*CFOi,t+β3*CFOi,t+1+β4*∆REVi,t+β5* PPEi,t+Ui,t
TCAi,t =
Total cash flow commitment item of i corporation in t year ∆REVi,t = Change in net sale from t−1 year to t year
PPEi,t = Value of impure properties and machinery in t year
CFOi,t = Operating cash flow cycle
Ui,t = Estimating error
β0 = Independent variable coefficient. TCA = ∆ CA - ∆CL - ∆Cash + ∆STDEBT ∆CA = Change in flow properties
∆CL = Change in flow liabilities ∆Cash = Change in cash flow
∆STDEBT = Change in long term liabilities (Chan et al., 2013).
At first each sample of flow commitment items should be
calculated by the model. To situate them in Regression quotation, we should test flow commitment items to be normal. Then they
will be in 5-1 related Regression. Estimating error is estimated
by different flow commitment items and calculating commitment items. When estimating error amount is less, commitment items quality will be better. Involuntary commitment items are calculated by the following quotation:
InnatAQi,t = λ0+λ1sizei,t+λ2δ(CFO)i,t+λ3δ(sales)i,t+λ4OperCyclei,t+
λ5NegEarni,t
Voluntary commitment items quality are received by the rest of
the model:
DiscAQi,t = µi,t Mashayekhi and et al. (2014).
3.3. Price Synchronism
To calculate price synchronism Kasznik (1996) model is used:
Synch = log ( R 1 R
2
2
− )
R2 in the above quotation is received determination coefficient
from two factors changes, market and industry monthly returns
in one financial year and its effect on corporation stock monthly
return.
Rit = α+βRmt+γRit+e
Rit = i corporation stock return for t month
Rmt = i corporation market return for t month
Rit = i corporation industry return for t month.
Above quotation is used for 12 months duration in each year. R2
is used as a criterion to measure price synchronism.
4. RESEARCH DATA ANALYSES AND
DESCRIPTIONS
Gathered information descriptions are one of the research level in research data analysis part and their reports are important in research. Research data with use of second hand information sources have been gathered and classified. Descriptions of information and statistic data are chosen based on measuring criteria. So, in this part statistic sample characteristics and related
indicators to the financial statement of statistic sample members
are investigated.
4.1. Research Variables Descriptions and Analyses Research variables analyses have been used as a methodological aim to describe research conclusions and research hypotheses evaluation description characteristics are statistic deduction based on variables indicators. Research variables are described and analyzed based on statistic indicators of dispersal and central trends. Totally, all the methods, which are describing data are processed and summarized, are called descriptive statistic. It should be said that after omitting additional data and arranging data, corporations numbers of research variables years will decrease.
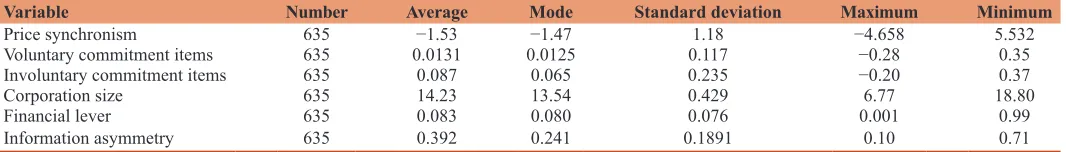
Descriptive statistic in Table 1 shows standard deviation, minimum
and maximum amount of each dependent, independent, and central
variable. In this table, the main central indicator is average, which
Table 1: Descriptive indicators of studied variables
Variable Number Average Mode Standard deviation Maximum Minimum
Price synchronism 635 −1.53 −1.47 1.18 −4.658 5.532
Voluntary commitment items 635 0.0131 0.0125 0.117 −0.28 0.35
Involuntary commitment items 635 0.087 0.065 0.235 −0.20 0.37
Corporation size 635 14.23 13.54 0.429 6.77 18.80
Financial lever 635 0.083 0.080 0.076 0.001 0.99
Information asymmetry 635 0.392 0.241 0.1891 0.10 0.71
shows balance point and distribution exertion center, which is a
good indicator to show data center.
As shown in Table 1, average amount of price synchronism is
−1.53 and variable mode is −1.47. Totally, dispersal criteria are the
criteria which investigate and compare dispersal observations, for
example standard deviation is one of the dispersal criteria which
is 1.18 for price synchronism in the Table 1.
4.2. Analysis Methodology of Test Type Determination
To determine mixture data and homogenous or inhomogeneous specifications of data, Chow Test and F Limer statistic are used.
Test hypotheses are:
H0: Polled data
H1: Panel data.
If test conclusions are based on paneling data uses, one of the
models of random effects or fixed effect will be chosen. To choose
one of these models, Hausman test will be done.
H0: Random effects
H1: Fixed effects.
As indicated in Table 2, Chow rest conclusions show that the received probability for the F statistic in all research hypotheses
are <0.05. So, data in all models are chosen as paneling to test
this hypothesis.
4.3. Hausman Test
In this test Cheedow statistic with freedom degree K is used. If
received Cheedow is more than table amount, H0 based on random
will be rejected and fixed effects will be accepted (Table 3).
In this test, H0 is based on panel data model with random effects
and its contrary hypothesis is based on panel data with fixed effects
model. If the Hausman test is more than its critical amount or its
probability is <0.05, H0 will be rejected and H1 will be accepted.
Based on received conclusions of the Hausman Test for research
model α = 0.05, statistic Hausman for research model is 48.365 and P < 0.05, so H0 is rejected. H0 rejection shows that random
effects are incoherent and fixed effects should be used.
5. RESEARCH HYPOTHESES TEST
CONCLUSIONS
In this study panel data model is dominate, this model is a time
mixture serial information (1389-1393) and research sectional data are gathered by 127 corporations data in Tehran stock exchange,
all the calculated amounts for variables are based on million Rials. Eviews 7 and 8 softwares have been used based on research models hypotheses.
5.1. First Hypothesis Test Conclusions
H0: Involuntary commitment items’ quality has a meaningful effect
on price synchronism.
H1: Involuntary commitment items’ quality has no meaningful
effect on price synchronism.
The main important aim of the Table 4 is its statistic presentation for practice goodness measuring which is done by determination
coefficient. Determination coefficient is a criterion for measuring relationship intensity between x and y which is 0.145. It means that the determination coefficient can describe 0.014 of dependent variable changes (price synchronism). Continuous correlation
among the remainders mean observations effects on each other.
Based on Watson Doorbin statistic amount 1.905, there aren’t
any continuous correlations between data. After investigating total model meaningfulness with use of accepted F statistic, we
should investigate coefficients meaningfulness by t-test. The
following Table 5 describes meaningfulness of Regression model
coefficients.
Based on research first model test conclusions, F statistic
meaningful level 0.000 is less than accepted error level 0.05, so total regression model is meaningful. Watson Durbin statistic amount 1.905 is situated from 1.5 to 2.5. Then correlations among error members aren’t existed. Based on high t statistic (P-value) of accepted error level for β1 coefficient, test conclusions show
no meaningful effect on involuntary commitment items on price Table 2: Chow test conclusions, sections homogenous or
inhomogeneous specifications Chow test
conclusion F statistical probability F Hypothesis test H0 is rejected 0.000 3.902 Research model
Table 3: Hausman test conclusions to determine use of
random or fixed effects models Test
conclusion F statistical probability F Hypothesis test
Fixed effects 0.000 48.365 Research model
Table 4: First model descriptive statistic
Watson doorbin statistic Meaningful level F statistic Adjusted determination
coefficient Determination coefficient model
1.905 0.000 38.396 0.145 0.159 first
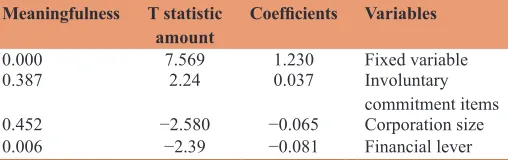
Table 5: Coefficients and t statistic amounts Meaningfulness T statistic
amount Coefficients Variables
0.000 7.569 1.230 Fixed variable
0.387 2.24 0.037 Involuntary
commitment items
0.452 −2.580 −0.065 Corporation size
synchronism. So, the research zeros hypothesis of first model can’t be rejected in 0.05 error level. Research conclusions show entered controlling variables in financial lever regression have
a meaningful effect on price synchronism and corporation size
doesn’t have any meaningful effects on price synchronism
determination coefficient and adjusted the determination
coefficient show that entered variables in regression can describe 0.014 of dependent variables changes. Following regression model for the first hypothesis is accepted:
Synch = 1.230+0.037 Innat±0.065SIZE±0.081LEV
As indicated in the Table 5, involuntary commitment items
variable with 0.037 coefficient and 0.387 meaningful level have
entered the model. So, there is no meaningful effect of involuntary
commitment items and price synchronism. Then H0 of first research
hypothesis is not rejected.
5.2. Second Hypothesis Test Conclusions
H0: Voluntary commitment items’ quality has a meaningful effect
on price synchronism.
H1: Voluntary commitment items’ quality has no meaningful effect
on price synchronism.
The main important aim of the Table 6 is its statistic presentation for practice goodness measuring which is done by determination
coefficient. Determination coefficient is a criterion for measuring relationship intensity between x and y which is 0.145. It means that the determination coefficient can describe 0.014 of dependent variable changes (price synchronism). Continuous correlation
among the remainders mean observations effects on each other.
Based on Watson Durbin statistic amount 1.905, there aren’t
any continuous correlations between data. After investigating total model meaningfulness with use of accepted F statistic, we
should investigate coefficients meaningfulness by t-test. The
following Table 7 describes meaningfulness of regression model
coefficients.
Based on research first model test conclusions, F statistic
meaningful level 0.000 is less than accepted error level 0.05, so total regression model is meaningful. Watson Durbin statistic amount 1.905 is situated from 1.5 to 2.5. Then correlations among
error members aren’t existed. Based on high t statistic (P-value) of accepted error level for β2 coefficient, test conclusions show
no meaningful effect on a voluntary commitment item on price
synchronism. So, the research zeros hypothesis of first model can’t be rejected in 0.05 error level. Research conclusions show entered controlling variables in financial lever regression have
a meaningful effect on price synchronism and corporation size
doesn’t have any meaningful effects on price synchronism
determination coefficient and adjusted the determination
coefficient show that entered variables in regression can describe 0.014 of dependent variables changes. Following regression model for the first hypothesis is accepted:
Synch = 1.230+0.037 Innat±0.065SIZE±0.081LEV
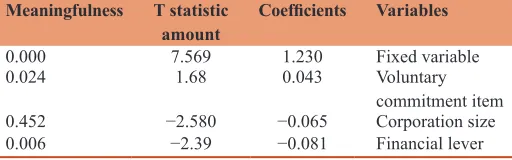
As indicated in the Table 7, voluntary commitment items vary
with 0.043 coefficient and 0.024 meaningful level has entered the
model. So, there is a meaningful effect of involuntary commitment
items on price synchronism. Then H0 of second research hypothesis
is rejected.
6. CONCLUSION
• Based on received conclusions of first hypothesis, there are
some suggestions which attend involuntary commitment item factors to avoid managers manipulations because involuntary commitment items are considered by management.
• Based on received conclusions of first hypothesis, involuntary
commitment items are limited because of organizations rules and other outside factors. Involuntary commitment items can be performed by management. Total commitment items which a corporation uses for its business accounts are received accounts and documents, payment accounts and documents, pre-payment and parts of incomes and costs (however, increase or decrease in incomes and costs are results of the
recorded in assets and liabilities). Above factors aren’t done by management, so they don’t effect on price synchronism
and should be considered.
• Based on received conclusions of second hypothesis which
suggest factors related to internal corporation costs and incomes should be considered because these factors can play important roles for effecting on price and stock return.
REFERENCES
Arab, M., Mashayekhi, M.B., Rafiee, A. (2006), Information content of cash flows and accruals in Iran capital market. The Iranian Accounting and Auditing Review, 43, 99-118.
Chan, K., Chan, L., Jegadeesh, N., Lakonishok, J. (2013), Earnings quality and stock. Journal of Business, 79(3), 1041-1082.
Dopuch, N., Mashruwala, R., Seethamraju, C., Zach, T. (2005), Accrual Determinants, Sales Changes and their Impact on Empirical Accrual Table 7: Coefficients and t statistic amounts
Meaningfulness T statistic
amount Coefficients Variables
0.000 7.569 1.230 Fixed variable
0.024 1.68 0.043 Voluntary
commitment item
0.452 −2.580 −0.065 Corporation size
0.006 −2.39 −0.081 Financial lever
Table 6: Second model descriptive statistic
Watson doorbin statistic Meaningful level F statistic Adjusted determination
coefficient Determination coefficient Model
Models. Retrieved March, 14. p2006.
Francis, J., LaFond, R., Olsson, P., Schipper, K. (2004), Costs of equity and earnings attributes. The Accounting Review, 79, 967-1010. Healy, P.M., James, M.W. (1999), A review of the earnings management
literature and its implications for standard setting. Accounting Horizons, 13(4), 365-383.
Hirshleifer, D., Hou, K., Teoh, S.H. (2009), Accruals, cash flows, and aggregate stock returns. Journal of Financial Economics, 91(3), 389-406.
Kasznik, R. (1996), On the association between voluntary disclosure and
earnings management. Journal of Accounting Research, 37, 57-81. Mashayekhi, B., Mehrani, S., Karami, K., Karami, G.H. (2014), Trade
and Development Aspects of Insurance Services and Regulatory Frameworks - II. Trade and Development Aspects of Insurance Services and Regulatory Frameworks: 6.t.
Scott, W. (2009), Financial Accounting Theory. Toronto, Ontario: Prentice Hall. p402-431.