Issues
ISSN: 2146-4138
available at http: www.econjournals.com
International Journal of Economics and Financial Issues, 2020, 10(3), 208-216.
The Testing of Efficient Market Hypotheses: A Study of Indian
Pharmaceutical Industry
Abhay Kumar
1, Rashmi Soni
2, Iqbal Thonse Hawaldar
3*, Meghna Vyas
4, Vaibhav Yadav
41MPSTME-NMIMS University, Mumbai India, 2KJ Somaiya Institute of Management - Somaiya Vidyavihar University, Mumbai India, 3Department of Accounting and Finance, College of Business Administration, Kingdom University, Bahrain. 4Final Year Student (MBA Tech), NMIMS University, Mumbai, India. *Email: [email protected]
Received: 10 March 2020 Accepted: 04 May 2020 DOI: https://doi.org/10.32479/ijefi.9764
ABSTRACT
The purpose of this study is to test whether the Indian pharmaceutical companies support efficient market hypotheses (EMH) and examine the efficiency of the Indian stock market in three forms, i.e., the weak, the semi-strong, and the strong form of market efficiency. For testing the weak form of efficiency, researchers collected stock price data of 10 listed pharmaceutical companies for the past 6 years, from 2012 to 2017 from the NSE website, and conducted a run test. To test the efficiency of semi-strong form, researchers collected data on the announcement of events like buyback, stock split, rights issue, dividend, bonus issue. They conducted an event study on the data. For testing the strong form of efficiency, researchers collected data consisting of NAV of some mutual funds (pharmaceutical funds) and the returns of a benchmarking index to compare. The study concludes that the pharmaceutical companies and Indian stock market is efficient in the weak form of EMH and not efficient in the semi-strong and strong form of EMH.
Keywords: Stock Market Efficiency, Buyback, Stock Split, Rights Issue, Dividend Announcement, Bonus, Mutual Funds, Benchmarking Index
JEL Classifications: G13, G14, G 15, G18
1. INTRODUCTION
The Efficient Market Hypothesis the financial economics theory suggests that the stock price is the reflection of the information available in the market. Market efficiency refers to the degree to which stock prices reflect all the relevant available information. When all the public and private data available about the stock is fully reflected in its price is called an efficient stock market. Whenever any new information comes into the market, stock prices affected immediately. Not any analysis (fundamental or technical) can help investors to generate a higher return. According to the EMH, the investor can gain higher returns by making riskier investments.
The efficient market efficiency theory has researched extensively across the world. Some of the research supports the argument of an efficient market and some not. There are three forms of
efficient market hypotheses (EMH) i.e., weak form, semi-strong form and strong form. These classifications were attributed to Fama (1970). Fama (1991) renamed the above three categories as “Return Predictability,” “Event Studies,” and “Test for Private Information” for weak form, semi-strong form, and the strong form of the efficient market hypothesis, respectively. Thus, the purpose of this study is to test whether the Indian pharmaceutical companies support efficient market hypotheses (EMH) and examine the efficiency of the Indian stock market in three forms.
2. LITERATURE REVIEW
There are many studies conducted on efficient market hypothesis in the developed and developing economies, including India. Hawaldar et al. (2017) tested a weak form of efficient market hypothesis on Bahrain Bourse and found that Bahrain Bourse is
not efficient in the weak form. Poshakwale (1996) tried to define the efficiency of the stock market in India. His study period was 1987-1994, based on tests for serial correlation and runs test found evidence that weak form efficiency on the Bombay Stock Exchange (BSE) was being violated. Gupta and Gupta (1997) showed a similar study and obtained resembling results for 1988-1996. Since even the weak form of efficiency is being violated, both technical and fundamental analysis could be used to help determine and predict the stock values and exploit the market. As the theory suggests, the weak form market should not be predictable by technical analysis.
Hawaldar (2016) tested the reaction of Bahrain Bourse to annual earnings announcements. He found that the response to yearly earnings announcements are delayed, and Bahrain Bourse is not efficient in the semi-strong form of an efficient market hypothesis. Hawaldar (2018) tested the reaction of stock prices to earnings announcements in the Indian stock market. He found that the response to earnings announcements are delayed, and the Indian stock market is not efficient in the semi-strong form of the efficient market hypothesis. Iqbal (2014) studied seasonal analysis of abnormal returns after the announcement of quarterly earnings in the Indian stock market and found that abnormal returns persist after the announcement of quarterly earnings. He concluded that the Indian stock market is not efficient in the semi-strong form. Iqbal and Mallikarjunappa (2011, 2010, 2009, 2007) empirically tested the responses of stock prices to quarterly earnings announcements. Their study covered an event window of 61 days, i.e., 30 days before the announcement of quarterly earnings (event day) and 30 days after the event day and day 0 as event day. The results of the study revealed that the responses of stock prices to earnings announcement was delayed and abnormal return persists after the event window. They concluded that the Indian stock market is not efficient in the semi-strong form of the efficient market hypothesis.
Siddikee and Begum (2015) examine the market efficiency of the pharmaceutical company of the Dhaka stock exchange (DSE). The results showed that there exists a predictable pattern in the data, which suggests that formulating a technical trading rule can result in investors making large profits. Sharma and Lacey (2004) observe a significant effect on stock volatility in a 3-day window around innovative announcements; they also note that the result was not there for periods that lie beyond the window. They found that the market responds to FDA approval of a drug positively. Loughran and Ritter (2004) studied the performance of American companies concerning the right issues, selected companies that offer rights issues to tend to underperform in the long term as compared to the companies that do not. Suresha and Gajendra (2012) find that previous studies suggest that stock returns are affected significantly either positively or otherwise around rights issue announcement dates. Their study concludes that the Indian market reacts negatively to the rights issue announcement. Kumar and Halageri (2011) observed the market efficiency of the Indian stock market for 15 days before and after the bonus announcement for 54 bonus announcements from listed companies. The study indicated that the stock price didn’t absorb the information of the announcement immediately, leaving scope for making abnormal profits. Muscarella and Vetsuypens (1996)
find that after the stock split, the liquidity improves, resulting in wealth gain for investors. Their conclusions back the model of Amihud and Mendelson (1986), which predicts a positive relation between equity value and liquidity. Mishra (2005) studied the price reaction on the announcement of share buyback empirically when a company wants to go ahead with targeted share buybacks.
3. OBJECTIVES AND HYPOTHESIS
The review of literature on testing of efficient market hypothesis in the Indian stock market showed that there is no conclusive evidence to accept that an Indian stock market is a weak form, semi-strong form and strong form efficient or inefficient. In this background, this study is conducted with the following objective.3.1. Objective
To test whether the weak form, semi-strong form, and strong form of efficient market hypothesis hold in the Indian stock market.
3.2. Hypotheses
Since the study examines the weak, semi-strong, and strong form of the efficient market hypothesis, taking different information and data, the hypotheses being tested are:
The pharmaceutical company’s stock prices are efficient in the weak form of an efficient market hypothesis
That the responses of stock prices to the event announcements are complete on the day of the event announcement
That the investors cannot earn excess returns by trading on inside information.
4. METHODOLOGY
Mallikarjunappa and Iqbal (2003) empirically tested the stock price reactions to quarterly earnings announcements in the Indian stock market. They used the event study methodology and selected companies with at least 20 percent foreign holdings. The results of the study indicated that the Indian stock market is not efficient in semi-strong from efficient market hypothesis.
4.1. Weak form of Market Efficiency
given in Table 1. The following equations were used in calculating the run test.
T=R–X/σ
R=Total number of runs
X=(2×n1×n2)/(n1+n2)+1
n1=Number of positive runs n2=Number of negative runs
σ2=2×n1n2 (2×n1n2–n)/(n2 n–1)
n=n1+n2
If n, which is the total number of runs as a summation of the number of positive and negative runs lies between the upper and lower limits, the market is concluded to be weakly efficient. The market cannot be predicted using historical stock data of the company for the past few years. We carried out the runs test for the analysis by collecting stock data for each of the company for the past 6 years, which is from 2012 to 2017. Author’s calculated the change in closing price for each month and then used the change to code it to a binary form of data. Using the coded data, then determine the number of runs for that data set.
4.2. Semi-strong of Market Efficiency
For testing for the semi-strong form of efficiency in the pharmaceutical industry, the announcement of events is analyzed. The closing stock price of a few companies listed on NSE 20 days before the announcement of the event and 20 days after the announcement of events. For this purpose, we have obtained the announcement dates from moneycontrol.com and have extracted the price related data from the NSE website. To analyze if the market is in a semi-strong form of efficiency, we studied an event study for the following events after the announcement: Stock split, rights issue, dividend announcement, buyback, and bonus issue. All the pharmaceutical companies may not have all the events during the period of our study from 2012 to 2017. Therefore, only the companies which had an event during the period of our study have been taken.
For Bonus Announcement, we analyzed the following companies: Pfizer Limited, Lupin Limited, Glenmark Pharmaceutical, Biocon Limited, and Sun Pharmaceutical Industry.
For Buyback Announcement, we analyzed the following companies: Dr. Reddy’s Laboratories, Pfizer Limited, Ajanta Pharmaceutical Limited, GlaxoSmithKline, and Sun Pharmaceutical Industry.
For dividend announcement, we analyzed the following companies: Sun Pharmaceutical Industry, Biocon Limited, Glenmark Pharmaceutical, Lupin Limited, and Pfizer Limited.
For the rights issue announcement, we analyzed the following companies: 1. Neuland Labs, Sun Pharmaceutical Industry, and Piramal Enterprises.
For stock split announcement, we analyzed the following companies: NatcoPharma, Sun Pharmaceutical Industry, Ajanta Pharmaceutical Limited, and Dr. Reddy’s Laboratories.
For analysis of the above data, we planned to conduct an event study. For which we assigned dummy days for standardization of every firm being analyzed under the type of announcement also we calculated the percentage return of the stocks, the expected return, the daily abnormal returns, and the CAR or cumulative abnormal returns for each company. Then the average CAR for the event announcement in concern plotted the graphs to better understand the average CAR for the event announcement.
4.2.1. Stock split
A corporate action in which a company splits the face value of outstanding shares and thereby increases the number of shares. Existing shareholders get multiple shares for every share held. It helps in boosting the liquidity of the shares is known as stock split. As this action does not add or reduce any value, the total dollar value of the shares remains unchanged, i.e., as it was pre-split. However, there is an increase in the number of shares outstanding. Commonly 2-for-1 or 3-for-1 are the most known split ratios. The companies analyzed for this event are Natco Pharmaceutical, Sun Pharmaceutical, Ajanta Pharmaceutical (for two different dates), and Dr. Reddy’s Laboratories.
4.2.2. Rights issue
Inviting the existing shareholders to purchase additional new shares in the company is called a rights issue. Through Rights Issue, existing shareholders are given securities called “rights” that give existing shareholders the right to buy new shares at a discounted rate in the same proportion in which it has on the record date. The companies analyzed for this event are Neuland Laboratories, Sun Pharmaceutical, and Piramal.
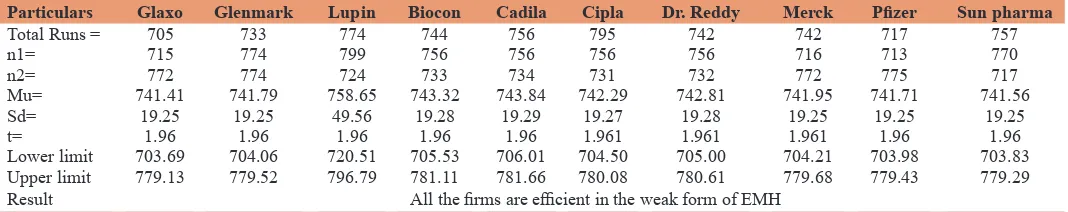
Table 1: Runs test result for testing the weak form of efficiency
Particulars Glaxo Glenmark Lupin Biocon Cadila Cipla Dr. Reddy Merck Pfizer Sun pharma
Total Runs = 705 733 774 744 756 795 742 742 717 757
n1= 715 774 799 756 756 756 756 716 713 770
n2= 772 774 724 733 734 731 732 772 775 717
Mu= 741.41 741.79 758.65 743.32 743.84 742.29 742.81 741.95 741.71 741.56
Sd= 19.25 19.25 49.56 19.28 19.29 19.27 19.28 19.25 19.25 19.25
t= 1.96 1.96 1.96 1.96 1.96 1.961 1.961 1.961 1.96 1.96
Lower limit 703.69 704.06 720.51 705.53 706.01 704.50 705.00 704.21 703.98 703.83 Upper limit 779.13 779.52 796.79 781.11 781.66 780.08 780.61 779.68 779.43 779.29
Result All the firms are efficient in the weak form of EMH
4.2.3. Dividend
It is the proportion of earnings distributed among shareholders. The board of directors decides the payout ratio. The dividend is paid in any form like a bank credit, as shares of stock, etc. The companies analyzed for this event are Sun Pharma, Biocon, Glenmark, Lupin, Pfizer.
4.2.4. Buyback
A buyback is the purchase of its outstanding shares open market. Because of buyback number of shares outstanding is reduces, it is also called repurchase. There are various reasons behind the companies buying back their shares, for example, using simple economics of demand and supply, by reducing the number of shares to increase the value of stocks. The companies analyzed for this event are Dr. Reddy, Pfizer, Ajanta Pharmaceutical, Glaxo, Sun Pharmaceutical.
4.2.5. Bonus
The act of offering free additional shares to existing shareholders is known as Bonus Issue. It is also known as capitalization issue as reserve and surplus are capitalized by issuing shares free of cost. It increases the number of shares, thereby increasing the dividend payout. The bonus shared are paid in the same proportion in which the existing shareholder is holding the stock. The companies analyzed for this event are Pfizer, Lupin, Glenmark, Biocon, Sun Pharma.
The percentagechange in return calculated by taking a difference in the share price. A fake time series assigned to the daily returns starting from the first % change in the return value. An event time series is attached to the regular returns. The expected return is calculated using the CAPM model. To calculate the abnormal return, we subtract expected return from the actual return, then the cumulative abnormal returnwas calculated by summing all the abnormal returns up to that point.
Ri,T=µi+ϵi,T
E[ϵi,T]=0
VAR εi,T =σε2i
1
0 T
i i=T +1 i,T
i 1
ˆ = R
M
µ
∑
Where
µ is an arithmetic mean
Mi is the number of non-missing returns.
Constant mean model is simple and highly restrictive compared to other models. However, the result based on this model does not systematically deviate from the results of different models (Brown and Warner 1980, 1985) for analyzing short term event studies.
4.3. Strong form of Market Efficiency
For testing of the strong form of market efficiency in the pharmaceutical sector, we needed to find if the asset manager of various mutual fund companies can earn more return than the market return using insider information. To test this form of efficiency, following mutual fund schemes (pharmaceutical funds) from www.amfiindia.com selected. UTI Pharmaceutical and healthcare fund-income option, UTI pharmaceutical and healthcare fund-growth option, Tata India pharmaceutical and healthcare fund-direct plan-dividend payout, Tata India Pharmaceutical and healthcare fund-direct plan-growth, SBI pharmaceutical – regular plan – dividend, SBI pharmaceutical – direct plan-growth, reliance pharmaceutical fund - direct plan dividend plan, reliance pharmaceutical fund - direct plan-growth plan - growth option.
The return of these mutual funds schemes has compared with the nifty pharmaceutical index for a period of 6 years from 2012 to 2017. To analyze the above data, we calculated the percentage return for the funds, and the index also calculated the cumulative percentage return for both. We investigated if the NAV return of the fund consistently beats the benchmark used for analysis purposes. If the mutual fund returns outperform the index returns, one could conclude that the market is not the strong form of market efficiency as the asset manager can use the insider information to his benefit.
5. RESULTS
5.1. Weak Form of EfficiencyWe accept the hypothesis that pharmaceutical companies’ stock prices are efficient in the weak form of an efficient market hypothesis.
5.2. Semi-Strong form of Efficiency
Stock split - The CAAR graph (Graph 1) for the stock split event indicates that the market changes behavior. It has linearly increased from 20 days before the event to 17 days before the
Graph 1: Stock split
event, then decreasing till 13 days before the event announcement. Then again linearly increasing till 2 days before the event before a steep decline 2 days before the announcement of the event then sharply increasing till the event announcement. The CAAR then decreases steadily till 8 days after the event before linearly increasing till 20 days after. Since the CAAR curve depicts a predictable behavior, the market can be said to be inefficient since the information takes time to make an impact. Such a pattern can help us conclude that the investors had some idea of the announcements before they happened. After the event date, the new information was not efficiently incorporated into the stock price, leaving room for some investors to make abnormal returns on their investments.
Rights issue-The The CAAR graph (Graph 2) for the rights issue event indicates that before the announcement of the event, the CAAR curve does not show any pattern that investors can make an extraordinary return. It seems the announcement of the event has no short-term impact on CAAR. The curve shows a linear decline until 14 days after the announcement of the event. Again, the return is linearly increasing for a few days till 16 days after the event and then still declining for 2 days till 18 days after the event announcement, signifying that the announcement information was not incorporated in the stock price effectively and immediately, but
instead over the time. Since the CAAR curve shows, a pattern of linear decline and information does not have an immediate impact on the market, and it can be said to be inefficient.
Dividend-The CAAR graph (Graph 3) for the announcement of the dividend event indicates that from 20 days before to 8 days before the announcement of the event, the CAAR gradually increases. Then it declines relatively till 5 days before the event announcement before increasing till 4 days before the event announcement. Again dropping till 2 days before the event announcement, the market is inefficient throughout this period. After the event announcement, the CAAR curve shows no significant pattern, although a gradual linear increase till 20 days after the event announcement; hence the market can be said to be inefficient.
Buyback-The CAAR graph (Graph 4) for the Buyback event announcement shows a pattern of decline from 18 days before the event announcement to 13 days before the event announcement. Then increasing till 4 days before the event announcement then gradually declining till the event announcement leaving room for some investors with extra information to make abnormal gains. After the event announcement, the CAAR curve shows an increase to 6 days, indicating the slow incorporation of information in the price again, leaving room for some abnormal investor gains.
Graph 2: Rights issue
Source: Author’s compilation
Source: Author’s compilation
Graph 3: Dividend
Source: Author’s compilation
Bonus-The CAAR curve (Graph 5) shows a gradual decrease from 20 days before the event announcement till the day of the event, indicating some prior information to the investors, making it possible for them to make abnormal gains. Eight days after the event announcement, the CAAR curve shows no pattern. It is showing a steep decline until 13 days after the event announcement. There is again steeply declining from 14th day to 15th day after the event and gradually increasing till 17 days. It shows a very slow incorporation of the information in the stock prices. Thus, one may say that the market is inefficient.
For all the five events, investors could gain abnormal returns as either there was some prior information or slow incorporation of the information provided in the announcement in the price of the stock. Thus, we can conclude that the responses of stock prices to the event announcements are not complete on the day of the event
announcement. Therefore, the Indian stock market is not efficient in the semi-strong form of EMH.
5.3. Strong form of Efficiency
Cumulative percentage return calculated to test the strong form of efficiency for Nifty Pharmaceutical and pharmaceutical funds. Analyzed whether the NAV return of the fund consistently beats the benchmark or not. If fund return is beating the benchmark return, then the market is not efficient in strong form.
5.3.1. UTI Pharmaceutical and healthcare fund-growth option
Graph 6. depicts the performance of UTI pharmaceutical and healthcare fund-growth option fund in comparison to the nifty pharmaceutical. It is seen from the graph that the performance of the fund is higher than that of the Nifty Pharmaceutical for most of the period starting 2016, indicating the use of insider information to beat the market ever since. The average cumulative return of
Source: Author’s compilation
-20 0 20 40 60 80 100
1-Jan-13 1-Jan-14 1-Jan-15 1-Jan-16 1-Jan-17
UTI Pharma & Healthcare Fund-Growth Option
NiftyPharma
Graph 6: UTI pharmaceutical and healthcare fund-growth option
Source: Author’s compilation
-35 -30 -25 -20 -15 -10 -5 0 5
29-Dec-15 29-Jun-16 29-Dec-16 29-Jun-17
Tata India Pharma & Healthcare Fund-Direct Plan-Dividend Payout
Graph 7: Tata India pharmaceutical and healthcare fund-direct plan-dividend payout Graph 5: Bonus
the fund is 49.63%, as compared to the average cumulative return of the index is 49.62%.
5.3.2. Tata India pharmaceutical and healthcare fund-direct plan-dividend payout
Graph 7 depicts the performance comparison of Tata India pharmaceutical and healthcare fund-direct plan-dividend payout with nifty pharmaceutical. It has seen from the above depiction that the performance of the fund is superior to nifty pharmaceutical for most of the period, indicating the use of insider information to beat the market ever since. The average cumulative return of the fund is −12.27%, whereas the average cumulative return of the index is −7.18%, which signifies better performance.
5.3.3. Tata India pharmaceutical and healthcare fund-direct plan-growth
Graph 8 shows the performance comparison of Tata India pharmaceutical and healthcare fund-direct plan-growth and nifty pharmaceutical. The graphical representation shows that the performance of the fund is superior to that of nifty pharmaceutical, which is used as a benchmarking index for our analysis for most of the period, indicating the use of insider information to beat the market ever since. The average cumulative return of the fund is −12.27% whereas the average cumulative return of the index is −7.18%.
5.3.4. SBI pharmaceutical – regular plan – dividend
Graph 9 depicts the performance of SBI pharmaceutical – regular plan – dividend as compared to the nifty pharmaceutical. It is observed from the graph that the performance of the fund is superior to the benchmarking index. Indicating the use of insider
information to beat the index ever since. The average cumulative return of the fund is 49.64% whereas the average cumulative return of the index is −56.68%.
5.3.5. SBI pharmaceutical – direct plan-growth
Graph 10 depicts a comparison of the performance of the benchmark for analysis, SBI pharmaceutical – direct plan-growth with the nifty pharmaceutical. It is observed from the graph that the performance of the fund is superior to the index. Indicating the use of insider information to beat the market ever since. The average of cumulative return of the fund is 49.64% whereas the average cumulative return of the index is 64.73%.
5.3.6. Reliance pharmaceutical fund - direct plan dividend plan
Graph 11 depicts the performance comparison of reliance pharmaceutical fund - direct plan dividend plan with the nifty pharmaceutical index chosen as the benchmark for the study. It witnessed the performance of the fund is inferior to that of nifty pharmaceutical for most of the period. The average of cumulative return of the fund is 49.64% whereas the average cumulative return of the index is 36.66%.
5.3.7. Reliance pharmaceutical fund - direct plan-growth plan - growth option
Graph 12 depicts the performance comparison of reliance pharmaceutical fund - direct plan-growth plan with the nifty pharmaceutical chosen as the benchmarking index for our analysis. The performance of the fund is not superior to that of the index for most of the period. The average cumulative return of the fund is 49.64%, whereas the average cumulative return of the index is 52.17%.
Source: Author’s compilation
-40 -30 -20 -10 0 10
30-Dec-15 30-Jun-16 31-Dec-16 30-Jun-17
Tata India Pharma & Healthcare Fund-Direct Plan-Growth
Niy Pharma
Graph 8: Tata India pharmaceutical and healthcare fund-direct plan-growth
-20 0 20 40 60 80 100
1-Jan-13 1-Jan-14 1-Jan-15 1-Jan-16 1-Jan-17 SBI PHARMA REGULAR PLAN
-DIVIDEND NiyPharma
Source: Author’s compilation
Thus, we conclude that as the Pharmaceutical funds are beating the index most of the time. It shows that insider information is available to the asset managers. Thus, indicating the availability of insider information to the asset managers and assets, mangers use this inside information to earn excess returns. Therefore, we conclude that the Indian stock market is not efficient in the strong form of EMH.
6. CONCLUSION
It is found that investors cannot earn an excess return based on historical information related to pharmaceutical companies in India. Therefore, we accept the hypothesis that the pharmaceutical
-20 0 20 40 60 80 100
1-Jan-13 1-Jan-14 1-Jan-15 1-Jan-16 1-Jan-17 Reliance Pharma Fund - Direct
Plan Dividend Plan NiyPharma
Source: Author’s compilation
Graph 11: Reliance pharmaceutical fund - direct plan dividend plan
-20 0 20 40 60 80 100
1-Jan-13 1-Feb-13 1-Mar-13 1-Apr-13 1-May-13 1-Jun-13 1-Jul-13 1-Aug-13 1-Sep-13 1-Oct-13 1-Nov-13 1-Dec-13 1-Jan-14 1-Feb-14 1-Mar-14 1-Apr-14 1-May-14 1-Jun-14 1-Jul-14 1-Aug-14 1-Sep-14 1-Oct-14 1-Nov-14 1-Dec-14 1-Jan-15 1-Feb-15 1-Mar-15 1-Apr-15 1-May-15 1-Jun-15 1-Jul-15 1-Aug-15 1-Sep-15 1-Oct-15 1-Nov-15 1-Dec-15 1-Jan-16 1-Feb-16 1-Mar-16 1-Apr-16 1-May-16 1-Jun-16 1-Jul-16 1-Aug-16 1-Sep-16 1-Oct-16 1-Nov-16 1-Dec-16 1-Jan-17 1-Feb-17 1-Mar-17 1-Apr-17 1-May-17 1-Jun-17 1-Jul-17 1-Aug-17 1-Sep-17 1-Oct-17 1-Nov-17 1-Dec-17
Reliance Pharma Fund - Direct Plan Growth Plan - Growth Opon
NiyPharma
Source: Author’s compilation
Graph 12: Reliance pharmaceutical fund - direct plan-growth plan - growth option
companies’ stock prices in the Indian stock market are efficient in the weak form of EMH. For all the five events, investors could gain abnormal returns due to delay in reaction of stock prices to events. We can conclude that the responses of stock prices to the event announcements are not complete on the day of the event announcement. Therefore, the Indian stock market is not efficient in the semi-strong form of EMH. For the strong form of efficiency, we conducted a comparison between the NAV Returns of some of the significant Pharmaceutical Funds and the Nifty Pharmaceutical Index.
We found that in most of the cases, the fund was able to beat the industry and index returns. Thus, indicating the availability of insider Source: Author’s compilation
-20 0 20 40 60 80 100 120
2-Jan-13 2-Mar-13 2-May-13 2-Jul-13 2-Sep-13 2-Nov-1
3
2-Jan-14 2-Mar-14 2-May-14 2-Jul-14 2-Sep-14 2-Nov-1
4
2-Jan-15 2-Mar-15 2-May-15 2-Jul-15 2-Sep-15 2-Nov-1
5
2-Jan-16 2-Mar-16 2-May-16 2-Jul-16 2-Sep-16 2-Nov-1
6
2-Jan-17 2-Mar-17 2-May-17 2-Jul-17 2-Sep-17 2-Nov-1
7
SBI PHARMA DIRECT PLAN -GROWTH
NiyPharma
information to the asset managers and assets, mangers use this inside information to earn excess returns. Therefore, we conclude that the Indian stock market is not efficient in the strong form of EMH.
REFERENCES
Amihud, Y., Mendelson, H. (1986), Asset pricing and the bid-ask spread.
Journal of Financial Economics, 17(4), 223-249.
Brown, S., Warner, J. (1980), Measuring security price performance. Journal of Financial Economics, 8, 205-258.
Brown, S., Warner, J. (1985), Using daily stock returns: The case of event
studies. Journal of Financial Economics, 14, 3-31.
Fama, E.F. (1970), Efficient capital markets: A review of theory and empirical work. Journal of Finance, 25(2), 383-417.
Fama, E.F. (1991), Efficient capital markets II. Journal of Finance, 46(5),
1575-1617.
Gupta, O.P., Gupta, V. (1997), A re-examination of weak-form efficiency of Indian share market. Finance India, 11(3), 619-632.
Hawaldar, I.T. (2016), The reaction of Bahrain bourse to announcement of annual financial results. International Review of Business Research
Papers, 12(1), 64-75.
Hawaldar, I.T. (2018), The reaction of stock prices to earnings announcements. Asian Journal of Multidimensional Research, 7(9),
282-293.
Hawaldar, I.T., Rohit, B., Pinto, P. (2017), Testing of weak form of efficient market hypothesis: Evidence from the Bahrain bourse. Investment
Management and Financial Innovations, 14(2), 376-385.
Iqbal, T.H. (2014), Seasonal analysis of abnormal returns after quarterly
earnings announcements. International Journal of Accounting and
Financial Reporting, 4(2), 501-519.
Iqbal, T.H., Mallikarjunappa, T. (2007), Market reaction to earnings
information: An empirical study. AIMS International Journal of Management, 1(2), 153-167.
Iqbal, T.H., Mallikarjunappa, T. (2009), Indian stock market reaction
to quarterly earnings information. Indian Journal of Finance, 3(7), 43-50.
Iqbal, T.H., Mallikarjunappa, T. (2010), A study of efficiency of the Indian stock market. Indian Journal of Finance, 4(5), 32-38.
Iqbal, T.H., Mallikarjunappa, T. (2011), The Efficiency of Stock Market: A Study of Stock Price Responses to Earnings Announcements.
Germany: LAP Lambert Academic Publishing Company.
Kumar, S., Halageri, S. (2011), Testing the semi-strong form efficiency of Indian stock market with respect to information content of bonus announcement. International Journal of Exclusive Management Research, 10(1), 250-280.
Loughran, T., Ritter, J. (2004), Why has IPO underpricing changed over
time? Financial Management, 33(3), 5-37.
Mallikarjunappa, T., Iqbal, T.H. (2003), Stock price reactions to earnings announcement. Journal of IAMD and IUCBER, 26(1), 53-60. Mishra, A.K. (2005), An empirical analysis of market reaction around
the rights issue in India. The ICFAI Journal of Applied Finance, 14(2), 1-37.
Muscarella, C.J., Vetsuypens, M.R. (1996), Stock splits: Signalling or liquidity? The case of ADR solo splits. Journal of Financial
Economics, 42(2), 3-26.
Poshakwale, S. (1996), Evidence on weak form efficiency and day of the week effect in the Indian share market. Finance India, 10(3), 605-616. Sharma, A., Lacey, N. (2004), Linking product development outcomes
to market valuation of the firm: The case of the U.S. pharmaceutical
industry. Journal of Product Innovation Management, 21(5), 297-308.
Siddikee, N., Begum, N. (2015), Is pharmaceuticals industry efficient? Evidence from Dhaka stock exchange. Accounting and Finance Research, 4(3), 46-54.
Suresha, B., Gajendra, N. (2012), An empirical study on announcement
effect of right issue on share price volatility and liquidity and its impact on market wealth creation of informed investors in Bangalore with special reference to CNX nifty stocks of NSE. International