in the population sciences published by the Max Planck Institute for Demographic Research Doberaner Strasse 114 · D-18057 Rostock · GERMANY www.demographic-research.org
DEMOGRAPHIC RESEARCH
VOLUME 7, ARTICLE 4, PAGES 67-144
PUBLISHED 02 AUGUST 2002
www.demographic-research.org/Volumes/Vol7/4/
DOI: 10.4054/DemRes.2002.7.4
Research Materials
Life-table representations of family
dynamics in Sweden, Hungary, and 14
other FFS countries:
A project of descriptions of demographic
behavior
1 Introduction: Creative description 68
2 Life-table descriptions 69
3 Data 71
3.1 Cleaning procedures 72
3.2 Synthetic cohorts 74
4 Outline of the study 76
5 Single-sex tables of family formation, men and women 79
5.1 Experience of nest-leaving 80
5.2 Experience of union formation 81
5.3 Experience of becoming a parent 88
5.4 Experience of the combination of being a parent and being in different union statuses
89
5.5 Experience of specific contexts of family-formation/ childbearing events
92
6 Pooled tables of union transformation and union disruption 98 6.1 Childless couples: Experience of childbearing or separation 98 6.2 Consensual unions: Experience of marriage formation or
separation
101
6.3 Couples’ experience of union disruption 107
7 Summary measures of time spent in various family statuses 113
8 Children’s experience of family dynamics 117 8.1 Children’s experience of family disruption 118 8.2 Children’s experience of family formation 122 8.3 A competing-risks model of family transformation for
children born in a consensual union
127
8.4 Children’s experience of family re-formation 130 8.5 Summary measures of children’s family experience 132
9 Life tables for other countries 135
10 Other possible measures … 136
11 Further descriptions 137
12 Acknowledgements 137
Research Materials
Life-table representations of family dynamics in Sweden, Hungary,
and 14 other FFS countries:
A project of descriptions of demographic behavior
Gunnar Andersson1 Dimiter Philipov2
Abstract
In this study, we present a system of descriptions of family-demographic behavior in developed countries. We use life-table techniques in order to describe the experience of men, of women, and of children in processes related to family formation and family dissolution. We develop a large number of descriptive measures, and apply them to survey data from Sweden, Norway, Finland, France, the USA, Austria, Germany (East and West Germany separately), Flanders, Italy, Spain, the Czech Republic, Hungary, Slovenia, Latvia, Lithuania, and Poland, in order to describe patterns in the family-demographic behavior during the late 1980s - early 1990s. We use Sweden and Hungary as examples when presenting the outline of our system of tabulations and provide results for the whole set of countries in an Appendix to the paper.
1 Max-Planck-Institute for Demographic Research, Doberaner Str. 114, 18057 Rostock, Germany;
Email: [email protected]
2 Max-Planck-Institute for Demographic Research, Doberaner Str. 114, 18057 Rostock, Germany;
1. Introduction: Creative description
Any sound investigation of a demographic phenomena must originate from some knowledge about its very basic patterns: how common the demographic event of interest is, at what ages it typically occurs, and how such patterns in a country differ from those in other countries and periods. During the last few decades we have witnessed an upsurge in research on family dynamics in developed countries. This is following an observed, or at least perceived increase in the diversity that people tend to organize their family lives. A vast amount of research has been carried out in order to explain the character of this “second demographic transition” (using the terminology of van de Kaa 1987 and Lesthaeghe 1995), and to examine the role of different determinants of, for example, union formation and union dissolution in explaining new patterns of behavior.
The role of the present study is not to provide any further investigation of determinants of family-demographic behavior. It is instead carried out in the belief that there is still a need for more and better basic descriptions of the actual state of family dynamics and of life courses of individuals in Europe and in other developed countries. We think it is important, still, to have a better overall picture of the state of affairs in family demography. Then one knows exactly what there is to explain before one starts to look for explanations for various types of phenomena and before one turns to more sophisticated means of analysis. The aim of our study therefore is to provide a detailed picture of existing patterns of family-related life trajectories of people in a wide range of European countries and in the US.
of our tabulations will provide for a better picture of the actual state of family dynamics in the countries concerned and that they can serve as a basis for more in-depth cross-country comparisons.
In our presentation, we develop our descriptive measures and apply them to data from 15 of the countries that participated in the last round of Fertility and Family Surveys (FFS) conducted in Europe between 1989 and 1997. In addition, we use corresponding data from the US National Survey of Family Growth of 1995 in order to contrast patterns in Europe to those prevailing on the other side of the Atlantic. We use the data from just two countries, Sweden and Hungary, in order to present the outline of our system of demographic description and to give an example of what kind of cross-country comparisons that can be made with it. This pair of countries offers a contrast between the demographic regime of one modern Western European country and that of one former Soviet Bloc country. Both countries have a long tradition of demographic research so we are well equipped to judge the validity of the results we present. We provide the complete tabulations covering all countries examined, in a readable manner in an Appendix to this paper. As an additional service, we offer our tabulations in the form of a set of Excel files to those who want to use our results for further purposes. These files can be downloaded from the present online article in Section 9. The Appendix as well as the Excel files are also made available at the article’s HTML start-up page.
2. Life-table descriptions
women, or children, or a real marriage cohort, is a straightforward matter, it requires that one can follow the cohort of interest up to the highest age limit of the tabulation, for example up to age 40. We prefer to be able to say something about the demographic behavior during the most recent calendar period. For that purpose, we construct a life table based on transition probabilities calculated from reported events of a specific kind and recorded months of exposure to that event during our period of interest, i.e., during the latest period for which we have data, so that we can describe the most recent patterns of family-demographic affairs. As any synthetic-cohort measure, our life tables thus give information on the demographic pattern that would arise if the calculated age-specific transition probabilities prevail during a generation or so.
In our tables, we present measures such as “the cumulative percentage of men and women who have ever experienced the event of entering a first union”, by single-year ages attained from the situation at the 15th birthday to the 40th birthday. In the tabulations, we also present a number of mean and percentile values in order to derive some summary information from our life tables. For example, we present values of mean ages of transition for those men and women who actually experience the event of interest before the upper age limit of 40 years. For children the upper age limit is 15 years, and we also follow unions until their 15th anniversary. We may refer to these mean values as conditional means in that they are conditional on the occurrence of an event before the upper age limit of the table. We also present the first exact age where at least 10, 25, 50, and 75 percent of the synthetic life-table population have experienced the event under study, i.e., ages of the first decile, the first quartile, the median, and the third quartile.
When we follow unions, and also when we follow children, we sometimes give yet another type of mean value. This value is calculated at the upper age limit of the life table as the mean duration of all episodes of the synthetic population, regardless of whether they are censored at that time horizon or whether individuals have experienced the event under study before that age. These truncated mean values give information on the average amount of time that is spent in a certain family status during the interval we study, i.e., during the first 15 years from union formation or birth.
3. Data
Our tabulations are based on raw data gathered at the Fertility and Family Surveys that were conducted in a large number of European countries in 1989-1997. We have used comparable data from the US National Survey of Family Growth in order to derive corresponding tabulations for the USA. The data have been provided to us by the Population Activities Unit in Geneva. However, for Sweden we have used instead a cleaned national version of the data.
researchers outside that country, but it is still possible to add data from a number of other countries to our descriptive analysis (Note 3).
3.1 Cleaning procedures
Before calculating the various life-table measures we present, it was necessary to perform a considerable amount of data cleaning. As a result, we have removed a number of respondents from the initial study population with incomplete information or illogical sequences of events. The raw data for Austria and Germany, just to mention one example, contained a large number of observations with no dates of union formation for respondents who reported that they had experienced at least one union, so we had to exclude them from our study population. Table A contains the total number of male and female respondents, mothers, and children of female respondents that, for each country, remain in our data set after our cleaning. It also gives the age ranges of respondents. We use the available demographic information of these remaining individuals, pertaining to the calendar-period that we want to investigate, when we perform our calculations. We do not include any children as reported by fathers since children more often co-reside with a mother than with a father and therefore larger segments of children’s lives are missing in their reports.
Table A: Size of remaining study population, by country
Ages of respondents Men Women Mothers Children Men Women
Austria 1428 4260 3217 6485 20-54 20-54
Flanders 2104 3143 1911 3602 20-40 20-40
Czech Rep. -- 1719 1222 2331 -- 15-44
Finland 1592 4040 2895 6043 25-49 22-51
France 1915 2930 2194 4527 20-49 20-49
E Germany 1875 2810 2025 3437 20-39 20-39
W Germany 1863 2743 1223 2113 20-39 20-39
Hungary 1899 3498 2622 4908 20-44 19-40
Italy 1175 4745 2858 5410 20-49 20-49
Latvia 1338 2622 2080 3787 18-49 18-49
Lithuania 1948 2924 2113 3742 18-49 18-49
Norway 1515 3969 2367 4523 28-43 20-43
Poland -- 4165 3184 6752 -- 18-49
Slovenia 1716 2761 2116 3953 15-45 15-45
Spain 1951 3981 2450 4991 18-49 18-49
Sweden 1495 2986 2247 4638 28-43 23-43
USA -- 10510 6609 14357 -- 15-44
For Poland and the Czech Republic, we have excluded all male respondents from our calculations since they are all partners to the female respondents there. It makes no sense to study family-formation events of a population where we have no information on individuals who have not experienced the events of interest. There are no men in the study population for the US either but this is just because no men were interviewed in the survey that had been launched in the USA.
no information on country of birth of survey respondents, nor any information about actual dates of migration. This means that possible immigrants are included in our study and that we cannot distinguish between demographic events that occurred in the country of origin and in the country of destination. This is a less desirable feature of our data, which we unfortunately cannot deal with further.
3.2 Synthetic cohorts
Table B: Study period of life tables of men, of women, of unions, and of children
Country women/men unions children
Austria 1990-1996 1990-1996 1990-1996
Flanders 1985-1992 1985-1992 1985-1992
Czech Rep. 1992-1997 1992-1997 1992-1997
Finland 1979/83-1989/92 1983-1992 1983-1989
France 1988-1994 1988-1994 1988-1994
E Germany 1984-1989 1984-1989 1984-1989
W Germany 1986-1992 1986-1992 1986-1992
Hungary 1988-1993 1988-1993 1988-1993
Italy 1990-1995 1990-1995 1990-1995
Latvia 1989-1995 1989-1995 1989-1995
Lithuania 1989-1995 1989-1995 1989-1995
Norway 1974-1989 1983-1989 1983-1989
Poland 1986-1991 1986-1991 1986-1991
Slovenia 1989-1995 1989-1995 1989-1995
Spain 1989-1995 1989-1995 1989-1995
Sweden 1978-1993 1985-1993 1987-1993
USA 1989-1995 1989-1995 1989-1995
We have applied weights in our calculations of life-table estimates for France and the US since the sampling procedures in these countries were performed in a way that were dependent on the outcomes we want to study. As a final remark, we want to point out the need for further data validation in this project – as in most other projects that use standard files of FFS data (see Lesthaeghe 2000 for more comments on this issue). Despite our cleaning efforts, we have not been able to go through all details at all corners of our data sets. We have also not been able to deal with all types of differences that exist in sampling procedures between countries. One important issue is to what extent immigrants tend to show up in the various data sets we have used. In our case, we have just used the data provided to us but have at least removed a number of evident cases of inconsistencies in it.
4. Outline of the study
The rest of our paper is devoted to the presentation of our life-table estimates. In Sections 5-8, we give a detailed description of the different types of life tables and other measures that we include in our system of demographic description. We use data from Sweden and Hungary as an illustration when presenting our system. As a consequence, we also offer a detailed comparison of the family-demographic behavior in these two countries. In Section 9, we give access to the same type of tabulations for all countries we have performed our calculations for – that is for 17 different geographical entities (when we count Western and Eastern Germany separately). The whole amount of life tables is offered in a manner of a number of Excel files that can be downloaded directly from the present online article. In addition, the same set of tabulations is given in Appendix 2 of this paper in a readable manner. In Table C below, we give an overview of the tabulations we present. We provide 45 different sets of tables.
Table C: List of contents
Section 5, Tables 1-16: Single-sex tables of family formation of men and women
5.1 Experience of nest-leaving
5.2 Experience of union formation
2. First union, as a cohabitation (censoring at marriage) 3. First union, as a marriage (censoring at cohabitation) 4. First union, as a cohabitation (competing-risks model) 5. First union, as a marriage (competing-risks model) 6. First union, as a marriage or a cohabitation (4+5)
7. First marriage
5.3 Experience of becoming a parent
8. First child
5.4 Experience of the combination of being a parent and being in different union statuses
9. Parent and in a union
10. Parent and married
11. Parent and not in a union (lone parent)
5.5 Experience of specific contexts of family-formation/childbearing events
12. Marriage during a first union 13. First child during a first union 14. First child during any union 15. First child during any marriage 16. First child when out of union
Section 6, Tables 17-28: Pooled tables of union transformation and union disruption
6.1 Childless couples: Experience of childbearing or separation
17. First child of a childless couple
18. Separated before a birth, childless couple
6.2 Consensual unions: Experience of marriage formation or separation
19. Married before dissolution
20. Separated before marriage
21. Married (competing-risks model) 22. Separated (competing-risks model) 23. No longer in a consensual union (21+22)
6.3 Couples’ experience of union disruption
24. Separation for unions begun as a cohabitation 25. Separation for unions begun as a marriage 26. Separation for all unions
Section 8, Tables 30-45: Children’s experience of family dynamics
Family type at birth
30. Percent of births by family type
8.1 Experience of family disruption
31. Ever out of union (all children) 32. Ever out of marriage (all children) 33. Out of union (children born in union)
34. Out of union (children born in consensual union) 35. Out of union (children born in marriage)
8.2 Experience of family formation
36. In union (children born to lone mother) 37. In marriage (children born to lone mother) 38. In marriage (children born to cohabiting mother) 39. In marriage (children born to non-married mother)
8.3 Competing-risks model for children born in consensual union
40. In marriage
41. Out of union
42. No longer in consensual-union family (40+41)
8.4 Experience of family re-formation
43. Again in union (after parental separation) 44. In marriage (after parental separation)
8.5 Summary measure
45. Percent of time spent In different family types
The FFS of Hungary and Sweden were conducted more or less at the same time, in 1992/1993. In the subsequent cross-country comparison between Hungary and Sweden, we have to keep in mind that our life tables for the former country are based on the demographic situation in the six-year period that ends in 1993, i.e., in the years just before and after the political and economical turnaround in that country, while the life tables of family formation of adult Swedes describe the demographic situation in the more extended period of 1977/1978-1992/1993 (a consequence of the particular sampling procedure of the Swedish FFS). When our unit of observation is unions of Swedes, we can use a shorter period for our synthetic-cohort measures that better corresponds to that of Hungary. When we describe the family-transformation experiences of children in Sweden, we use the six-year period before the survey in 1992/1993, as we do for Hungary.
Before we start, we want to make a short comment on the effects of the Swedish marriage boom in 1989 on estimated patterns of family transformations for Sweden. Since an unusually large number of marriages were formed in that year (see Hoem 1991), and since these marriages occurred in the period for which we estimate our synthetic-cohort measures, these measures will be strongly influenced by that specific event. We would get a different picture of the marriage-formation patterns in Sweden if this event had not occurred. Our estimates of union-disruption patterns are also affected by this event since divorce risks of the marriage cohort of 1989 have been generally lower than for other marriage cohorts (Andersson 1998). Similarly, in the case of Hungary, there have been a number of changes in demographic behavior during our study period that will not be accounted for explicitly by our tabulations. These changes have occurred more gradually over time, however, so that in any case we are able to derive meaningful information on patterns of demographic behavior during this transitional period. As an initial check, we have performed separate calculations for the first and the second half of the study period we use (not shown here) in order to be sure that the basic patterns that we observe have not changed extensively over time.
In the final presentation of life tables for all countries we cover, we do not even try to make any comments or reflections on the abundance of information that arises from the tabulations we give. We merely present our results to a broader audience in order to invite to further contemplation. It is our hope that the tabulations we produce will provide a better picture of various aspects of family dynamics in the countries we study and that they can serve as a basis for a number of more specific cross-country comparisons (see Andersson 2001 for an example). Evidently, if one choose to focus on just a subset of our tabulations, one can derive detailed information on a certain topic in family demography – as seen from the point of view of men, of women, or of children.
5. Single-sex tables of family formation, men and women
5.1 Experience of nest-leaving
We begin with a presentation of patterns of leaving the parental home in Sweden and Hungary (Table 1). The two countries provide a clear contrast. Sweden has a pattern where home-leaving occurs very rapidly around the age of 20, and where practically everybody has left their parental home at age 25-26 while in Hungary home-leaving takes place at a much slower pace and substantial fractions of young people never leave the parental home at all during the life segment considered. In the latter case, family formation may occur anyway but then within the original home.
Table 1: Cumulative percent ever leaving the parental home
Age Swedish men Swedish
women
Hungarian men Hungarian women (1978-93) (1978-93) (1988-93) (1988-93)
16 4 6 1 2
18 19 29 2 7
20 46 73 7 25
22 78 93 19 46
24 91 98 35 63
25 94 99 43 69
26 96 99 49 72
28 98 -- 58 77
30 98 -- 65 80
35 -- -- 74 83
40 -- -- 75 84
Mean age: 20 19 25 22
(at transition, conditional on transition before age 40)
1st decile at age: 17 17 21 19
1st quartile: 19 18 23 20
Median at age: 21 19 27 23
5.2 Experience of union formation
We proceed with a presentation of measures on (i) the cumulative percent ever starting a first union as a cohabitation by single year of age, and (ii) the cumulative percent ever starting a first union as a marriage according to age. In a case like this, when there is more than one way of exiting from the original state of “never having lived in a union”, we can describe the decrements by using two different sets of life tables. First, we present a single-decrement life table for each of the two events (Tables 2 and 3) where we censor an individual at the occurrence of the competing event and otherwise ignore this decrement. The separate tables then describe the family-formation intensities by just one way of entering a union for people who have never yet lived in a union. It is important to be aware that these tables thus cover a hypothetical situation which describes how family formation would look like if the alternative way of entering a union did not exist (would there be independence between the event and the censorship). The purpose of such a tabulation is to get a picture of the “pure” propensity to enter a union in a specific way so that one can compare it to similar propensities in other populations. Such models are often used in multivariate analyses to get at the underlying propensities in different sub-populations. In reality, the existence of different decrements results in observed outcomes of real populations that differ from those depicted by the life-table methods used in Tables 2 and 3.
Table 2: Cumulative percent ever starting a first union as a cohabitation, single-decrement life-table method with censoring at direct marriage
Age Swedish men Swedish women Hungarian men Hungarian women (1978-93) (1978-93) (1988-93) (1988-93)
16 0 2 0 1
18 3 12 1 6
20 16 38 5 14
22 40 62 12 24
24 60 76 20 34
25 67 81 25 38
26 72 84 30 42
28 80 88 37 45
30 84 91 39 51
35 90 94 48 55
40 92 95 53 62
Mean age: 23 22 26 25
(at transition, conditional on transition before age 40 and disregarding competing decrement)
1st decile: 20 18 22 20
1st quartile: 21 20 25 23
Median: 23 21 37 30
--Table 3: Cumulative percent ever starting a first union as a marriage, single-decrement life-table method with censoring at entry into cohabitation
Age Swedish men Swedish women Hungarian men Hungarian women (1978-93) (1978-93) (1988-93) (1988-93)
16 0 0 0 0
18 0 0 0 5
20 0 1 3 24
22 1 2 12 46
24 2 4 29 65
25 3 4 37 71
26 4 5 44 75
28 7 6 55 78
30 8 9 61 79
35 14 12 67 82
40 18 15 68 84
Mean age: 30 29 25 22
(at transition, conditional on transition before age 40 and disregarding competing decrement)
1st decile: 32 31 22 19
1st quartile: -- -- 24 21
Median: -- -- 27 23
3rd quartile: -- -- -- 26
a tabulation of the sum of the two, i.e., the fractions who ever enter any union at all (Table 6).
Table 4: Cumulative percent ever starting a first union as a cohabitation, competing-risks life-table method with direct marriage as a competing event
Age Swedish men Swedish women
Hungarian men Hungarian women (1978-93) (1978-93) (1988-93) (1988-93)
16 0 2 0 1
18 3 12 1 5
20 16 38 4 12
22 40 62 11 19
24 59 76 17 24
25 66 80 21 25
26 72 83 24 26
28 78 87 27 27
30 83 90 28 28
35 88 92 31 29
40 89 93 33 30
Mean age: 23 21 25 22
(at transition, conditional on transition before age 40)
1st decile: 20 18 22 20
1st quartile: 21 20 27 25
Median: 23 21 --
--Table 5: Cumulative percent ever starting a first union as a marriage, competing-risks life-table method with entry into cohabitation as a competing event
Age Swedish men Swedish women
Hungarian men Hungarian women (1978-93) (1978-93) (1988-93) (1988-93)
16 0 0 0 0
18 0 0 0 4
20 0 0 3 22
22 1 1 11 40
24 1 2 25 53
25 1 2 32 57
26 2 2 37 59
28 3 2 44 61
30 3 2 48 62
35 3 3 51 63
40 4 3 52 64
Mean age: 27 25 25 22
(at transition, conditional on transition before age 40)
1st decile: -- -- 22 19
1st quartile: -- -- 24 21
Median: -- -- 32 24
--=> Table 6: Cumulative percent ever in a union
Age Swedish men Swedish women
Hungarian men Hungarian women (1978-93) (1978-93) (1988-93) (1988-93)
16 0 2 0 1
18 3 12 2 10
20 16 39 8 34
22 41 63 22 59
24 61 77 43 77
25 68 81 53 82
26 73 85 60 85
28 81 89 71 88
30 86 92 76 90
35 91 94 82 92
40 93 96 85 94
Mean age: 23 22 25 22
(at transition, conditional on transition before age 40)
1st decile: 20 18 21 18
1st quartile: 21 20 23 20
Median: 23 21 25 22
3rd quartile: 27 24 30 24
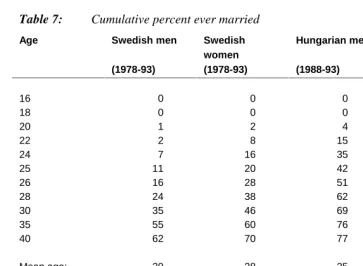
From Table 6 we can see that men in Sweden enter their first union at a faster pace than men in Hungary, while patterns for women are quite similar in the two countries. We can also see that practically all people in Sweden actually start their first union as a cohabitation, while the majority of Hungarians do so by direct marriage. In these tabulations it would have been nice if we were able to present results also for ages above the upper limit of 40 years of age since, at least for men in Hungary, union formation might continue above that age.
Table 7: Cumulative percent ever married
Age Swedish men Swedish women
Hungarian men Hungarian women (1978-93) (1978-93) (1988-93) (1988-93)
16 0 0 0 0
18 0 0 0 5
20 1 2 4 26
22 2 8 15 48
24 7 16 35 67
25 11 20 42 74
26 16 28 51 78
28 24 38 62 82
30 35 46 69 84
35 55 60 76 88
40 62 70 77 89
Mean age: 29 28 25 22
(at first transition, conditional on transition before age 40)
1st decile: 25 23 22 19
1st quartile: 29 26 23 20
Median: 33 31 26 23
3rd quartile: -- -- 34 26
5.3 Experience of becoming a parent
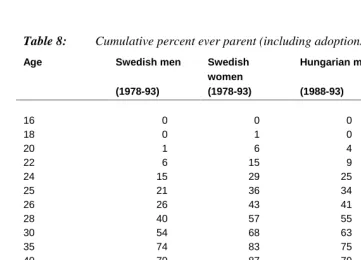
Next, Table 8 reports the cumulative percent who ever become a parent, for men and women, separately, where entry into parenthood includes the arrival of both biological and adopted children. This table mainly reveals differences in timing between the two countries. Childbearing in Hungary starts at much earlier ages than in Sweden.
Table 8: Cumulative percent ever parent (including adoptions)
Age Swedish men Swedish women
Hungarian men Hungarian women (1978-93) (1978-93) (1988-93) (1988-93)
16 0 0 0 0
18 0 1 0 3
20 1 6 4 17
22 6 15 9 38
24 15 29 25 57
25 21 36 34 64
26 26 43 41 71
28 40 57 55 81
30 54 68 63 84
35 74 83 75 91
40 79 87 79 93
Mean age: 28 26 26 24
(at transition, conditional on transition before age 40)
1st decile: 23 21 23 20
1st quartile: 26 24 24 21
Median: 30 27 28 24
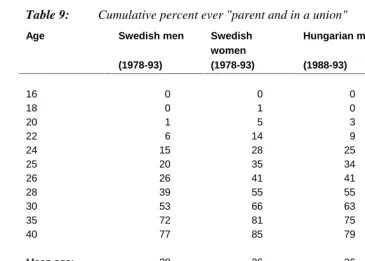
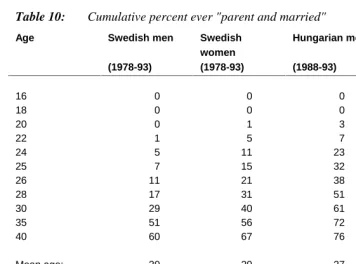
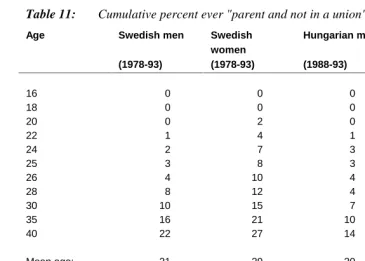
5.4 Experience of the combination of being a parent and being in different union statuses
We proceed to present three measures that combine information on the status of being a parent and the union status during parenthood. We present tables that give information about experiences of the combination of being a parent and being in any union (Table 9), a parent in a marital union (Table 10), or a parent outside any union (Table 11), with the attainment of the combination of these states at either a childbirth (or adoption) or a union event (union formation or union dissolution), whichever comes last. The entry into the state of ever being both a parent and in a union can thus occur at the childbirth of a partnered person or by the union formation of a lone parent. Similarly, the entry into the state of ever being a parent out of a union, i.e., a lone parent, can occur by the entry into parenthood by a person who does not live in a union or by the union dissolution of a parent. We do not discriminate between union orders so any combination of interest can be attained at any union order.
Note that these measures of parenthood do not give full information on the real living arrangements of people, i.e., on whether parents actually live together with their children in a specific type of family. In this data representation, we have not, for example, used information on whether children continue to live with a parent after a union disruption or whether new stepchildren arrive to a family. We just use the information on parity changes of the adult respondents in order to define their parenthood status.
Table 9: Cumulative percent ever "parent and in a union"
Age Swedish men Swedish women
Hungarian men Hungarian women (1978-93) (1978-93) (1988-93) (1988-93)
16 0 0 0 0
18 0 1 0 3
20 1 5 3 16
22 6 14 9 36
24 15 28 25 54
25 20 35 34 62
26 26 41 41 70
28 39 55 55 80
30 53 66 63 83
35 72 81 75 90
40 77 85 79 92
Mean age: 28 26 26 24
(at transition, conditional on transition before age 40)
1st decile: 23 22 23 20
1st quartile: 26 24 24 21
Median: 30 28 28 24
Table 10: Cumulative percent ever "parent and married"
Age Swedish men Swedish women
Hungarian men Hungarian women (1978-93) (1978-93) (1988-93) (1988-93)
16 0 0 0 0
18 0 0 0 2
20 0 1 3 14
22 1 5 7 34
24 5 11 23 52
25 7 15 32 60
26 11 21 38 68
28 17 31 51 77
30 29 40 61 81
35 51 56 72 87
40 60 67 76 90
Mean age: 30 29 27 24
(at transition, conditional on transition before age 40)
1st decile: 26 24 23 20
1st quartile: 30 27 25 22
Median: 35 32 28 24
Table 11: Cumulative percent ever "parent and not in a union" (lone parent)
Age Swedish men Swedish women
Hungarian men Hungarian women (1978-93) (1978-93) (1988-93) (1988-93)
16 0 0 0 0
18 0 0 0 1
20 0 2 0 3
22 1 4 1 5
24 2 7 3 8
25 3 8 3 9
26 4 10 4 10
28 8 12 4 13
30 10 15 7 16
35 16 21 10 22
40 22 27 14 26
Mean age: 31 29 30 28
(at transition, conditional on transition before age 40)
1st decile: 30 26 35 26
1st quartile: -- 38 -- 39
Median: -- -- --
--3rd quartile: -- -- --
--5.5 Experience of specific contexts of family-formation/childbearing events
and Hungary. However, since our exposure groups contain very different types of persons, it is difficult to know the reason why one gets a specific pattern and why patterns look different in different study populations.
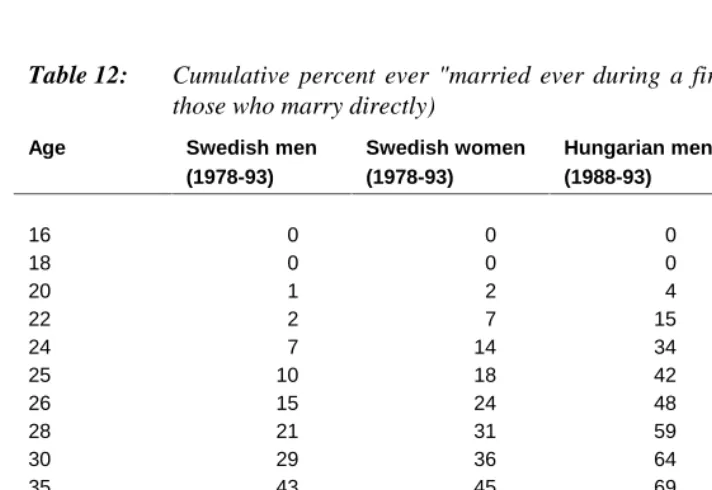
The first table of this kind (Table 12) presents the cumulative percentages by age who ever get married while also living in a first union. (The decrement under study is the combination of an event and a family context and the risk population consists of those who have never experienced that particular combination.) In Sweden, just around half of both men and women ever experience such a combination before age 40 despite the fact that around two thirds of them eventually get married (Table 7). Evidently, first marriage in Sweden often occurs in higher-order unions.
Table 12: Cumulative percent ever "married ever during a first union" (including those who marry directly)
Age Swedish men Swedish women Hungarian men Hungarian women (1978-93) (1978-93) (1988-93) (1988-93)
16 0 0 0 0
18 0 0 0 5
20 1 2 4 26
22 2 7 15 48
24 7 14 34 66
25 10 18 42 72
26 15 24 48 76
28 21 31 59 80
30 29 36 64 81
35 43 45 69 84
40 48 53 71 86
Mean age: 29 28 25 22
(at transition, conditional on transition before age 40)
1st decile: 25 23 22 19
1st quartile: 29 27 23 20
The next four tables (Tables 13-16) all give information about the experience of the combination of becoming a parent and of living in different family contexts. We present the cumulative percentages of men and women who will ever have the experience of entry into parenthood while living in a first union (Table 13), in any union at all (Table 14), in a marriage (Table 15), or not in a union (Table 16). Again, the decrement under study is the combination of an event and a family context and the risk population consists of those who have never experienced that particular combination (Note 7).
Table 13: Cumulative percent ever "having a first birth ever in a first union"
Age Swedish men Swedish women
Hungarian men Hungarian women (1978-93) (1978-93) (1988-93) (1988-93)
16 0 0 0 0
18 0 1 0 3
20 1 5 3 15
22 5 12 8 34
24 13 23 23 52
25 17 28 31 59
26 21 33 37 65
28 31 44 50 74
30 42 52 55 76
35 55 60 65 81
40 57 62 68 82
Mean age: 28 26 26 23
(at transition, conditional on transition before age 40)
1st decile: 24 22 23 20
1st quartile: 27 25 25 22
Median: 33 30 28 24
Table 14: Cumulative percent ever "having a first birth ever in any union"
Age Swedish men Swedish women
Hungarian men Hungarian women (1978-93) (1978-93) (1988-93) (1988-93)
16 0 0 0 0
18 0 1 0 3
20 1 5 3 15
22 5 13 8 35
24 14 27 23 53
25 19 33 32 60
26 25 39 39 67
28 38 53 52 76
30 51 63 61 80
35 69 76 73 86
40 73 79 76 87
Mean age: 28 26 27 24
(at transition, conditional on transition before age 40)
1st decile: 24 22 23 20
1st quartile: 26 24 25 21
Median: 30 28 28 24
Table 15: Cumulative percent ever "having a first birth ever in any marriage"
Age Swedish men Swedish women
Hungarian men Hungarian women (1978-93) (1978-93) (1988-93) (1988-93)
16 0 0 0 0
18 0 0 0 2
20 0 1 2 13
22 1 2 6 32
24 3 5 21 49
25 4 7 29 57
26 5 9 36 64
28 9 15 48 72
30 14 20 57 76
35 23 26 68 81
40 26 28 72 83
Mean age: 30 28 27 24
(at transition, conditional on transition before age 40)
1st decile: 29 27 23 20
1st quartile: 37 33 25 22
Median: -- -- 29 25
Table 16: Cumulative percent ever "having a first birth ever out of a union"
Age Swedish men Swedish women
Hungarian men Hungarian women (1978-93) (1978-93) (1988-93) (1988-93)
16 0 0 0 0
18 0 0 0 1
20 0 1 0 2
22 1 2 1 3
24 1 3 2 4
25 1 3 2 4
26 2 3 2 4
28 2 4 2 4
30 2 4 2 4
35 3 4 2 5
40 3 5 2 5
Mean age: 26 25 22 22
(at transition, conditional on transition before age 40)
1st decile: -- -- --
--1st quartile: -- -- --
--Median: -- -- --
--3rd quartile: -- -- --
--The tables that describe the combination of entry to parenthood and living in different family contexts (Tables 13-16) reveal, among other things, that first childbearing in Sweden is not confined to a first union and certainly not to marriage, but nevertheless to a union. For Hungary, on the other hand, Tables 13-15 look very similar to each other simply because there is hardly any distinction between a first union, any union, or any marriage for most people in that country. For both Hungary and Sweden, the fractions of men and women who report that they have become a parent while not living together with a partner are very small.
6. Pooled tables of union transformation and union disruption
In this section, we describe various experiences of men and women at reproductive ages after they have entered a union. We use information on unions as reported by both men and women, but pool them together as each heterosexual union consists of one man and one woman. We thus present life-table estimates for persons in unions and report the cumulative percent who experience a certain event at every exact single year of union duration for the first five years of a union and then at exact durations of 7, 10, and 15 years after union formation. In all our life-table estimations, we censor our observation at the possible but rare event of a reported partner’s death.
Concern is sometimes expressed regarding the reliability of men’s reporting about issues such as union formation, and even about the possibility of non-reporting of unions that do not lead to marriage or to childbearing. We have experimented with separate life tables for unions reported by the two sexes in Hungary and Sweden but have found no really striking differences in patterns of union transformations. We conclude that there should be no problem in combing information on heterosexual unions as reported by men with those reported by women.
6.1 Childless couples: Experience of childbearing or separation
Table 17: Cumulative percent parents, by time since formation of a union by a childless couple, single-decrement life-table method with censoring at union dissolution
Duration (years)
Sweden (1985-93)
Hungary (1988-93)
0 0 0
1 8 28
2 23 56
3 38 72
4 51 81
5 61 86
7 75 90
10 86 93
15 91 95
Mean duration: 4 2
(to first childbirth /conditional on childbirth within 15 years and disregarding union disruption)
1st decile at dur: 2 1
1st quartile: 3 1
Median at dur: 4 2
3rd quartile: 7 4
Table 18: Cumulative percent separated, by time since formation of a childless union, single-decrement life-table method with censoring at childbirth
Duration (years)
Sweden (1985-93)
Hungary (1988-93)
0 0 0
1 9 5
2 19 13
3 29 20
4 36 26
5 42 28
7 52 36
10 60 48
15 72 54
Mean dur: 5 5
(at union disruption /conditional on disruption within 15 years and disregarding childbearing)
1st decile: 2 2
1st quartile: 3 4
Median: 7 12
3rd quartile: --
6.2 Consensual unions: Experience of marriage formation or separation
We proceed with a description of the destiny of consensual unions: how they are either transformed into a formal marriage, or get dissolved. As in Section 5.2, we describe this pair of decrements by using two different life-table methods. Our first table (Table 19) is a single-decrement life-table of the cumulative percent married, by time since formation of the consensual union. Individuals under risk are censored at the alternative event of union disruption, so this table gives information on the “pure” propensity of partners in consensual unions to transform their union into a marriage (would there be independence between the two events) in the hypothetical situation where no one is to face a dissolution of their union. The table reveals that high fractions of remaining unions eventually end up in a marriage, both in Hungary and in Sweden. However, the transformation occurs at a much faster rate in Hungary than in Sweden, and is concentrated to the first few years of the union. Again, we need to keep in mind that the patterns of marriage formation, as they appear for Sweden, are still affected by the extraordinary marriage boom in 1989.
In Table 20, conversely, we present the cumulative percent of consensual unions that are dissolved if we ignore the alternative event of a transformation of the union into a marriage and censor at that event. This single-decrement life-table thus depicts the propensities of union dissolution in the situation where no one is to marry. It shows that consensual unions are very unstable in both countries. Union disruption is common and the majority of remaining consensual unions are dissolved at a duration of 5-7 years from union formation. Consensual unions in Hungary are less stable than those in Sweden.
Table 19: Cumulative percent married, by time since formation of a consensual union, single-decrement life-table method with censoring at union dissolution
Duration (years)
Sweden (1985-93)
Hungary (1988-93)
0 0 0
1 6 25
2 14 40
3 23 49
4 32 53
5 40 58
7 53 63
10 67 67
15 78
--Mean dur: 6
--(at marriage /conditional on marriage within 15 years and disregarding union disruption)
1st decile: 2 1
1st quartile: 4 1
Median: 7 4
--Table 20: Cumulative percent separated, by time since formation of a consensual union, single-decrement life-table method with censoring at marriage formation
Duration (years)
Sweden (1985-93)
Hungary (1988-93)
0 0 0
1 8 11
2 19 26
3 28 35
4 36 45
5 41 50
7 50 56
10 56 68
15 64
--Mean dur: 5
--(at union disruption /conditional on disruption within 15 years and disregarding marriage formation)
1st decile: 2 1
1st quartile: 3 2
Median: 7 5
3rd quartile: --
Table 21: Cumulative percent married, by time since formation of a consensual union, competing-risks life-table method with union dissolution as a competing event
Duration (years)
Sweden (1985-93)
Hungary (1988-93)
0 0 0
1 6 24
2 13 36
3 20 42
4 26 44
5 31 47
7 38 50
10 44 51
15 49
--Mean dur: 5
--(at marriage /conditional on marriage within 15 years)
1st decile: 2 1
1st quartile: 4 2
Median: -- 7
--Table 22: Cumulative percent separated, by time since formation of a consensual union, competing-risks life-table method with marriage formation as a competing event
Duration (years)
Sweden (1985-93)
Hungary (1988-93)
0 0 0
1 8 10
2 17 20
3 25 25
4 31 30
5 34 32
7 39 34
10 41 38
15 43
--Mean dur: 3
--(at union disruption /conditional on disruption within 15 years)
1st decile: 2 1
1st quartile: 3 3
Median: --
--=> Table 23: Cumulative percent no longer in a consensual union, by time since union formation
Duration (years)
Sweden (1985-93)
Hungary (1988-93)
0 0 0
1 14 34
2 30 55
3 45 67
4 57 74
5 65 79
7 77 84
10 86 90
15 92
--Mean dur: 4
--(at exit /conditional on exit within 15 years)
1st decile: 1 1
1st quartile: 2 1
Median: 4 2
3rd quartile: 7 5
Mean dur: 5
--(of all episodes /truncated after 15 years)
6.3 Couples’ experience of union disruption
Next we provide a number of life tables that give more information on patterns of union dissolution in Sweden and Hungary. The life tables concern disruptions of (i) unions begun as a consensual union (including disruptions occurring after any transformation of that union into a formal marriage), (ii) unions begun as a direct marriage, and (iii) all unions taken together, regardless of how they were started. Again we use unions of all orders as the basis for our computations and the possible event of union disruption is assigned to the date when respondents reported that they stopped living with their partner.
Table 24 displays very similar patterns of union dissolution for unions started as a consensual union in Hungary and Sweden. In the same way, both countries have very similar patterns of union dissolution for unions begun as a marriage (Table 25). The rate of union dissolution is much higher for the former type of union: More than half of these unions eventually end in disruption while only a fifth of unions begun as a marriage end in this manner within a period of 15 years.
Table 24: Cumulative percent separated, by time since union formation, for unions begun as a cohabitation (without censoring at marriage formation)
Duration (years)
Sweden (1985-93)
Hungary (1988-93)
0 0 0
1 8 10
2 18 20
3 26 26
4 32 32
5 37 35
7 43 40
10 49 46
15 55 53
Mean dur: 4 4
(at union disruption /conditional on disruption within 15 years)
1st decile: 2 1
1st quartile: 3 3
Median: 11 14
3rd quartile: --
--Mean dur: 9 9
Table 25: Cumulative percent separated, by time since union formation, for unions begun as a marriage
Duration (years)
Sweden (1985-93)
Hungary (1988-93)
0 0 0
1 3 2
2 5 4
3 5 6
4 5 7
5 5 9
7 8 12
10 14 16
15 20 20
Mean dur: 7 6
(at union disruption /conditional on disruption within 15 years)
1st decile: 8 6
1st quartile: --
--Median: --
--3rd quartile: --
--Mean dur: 14 13
=> Table 26: Cumulative percent separated, by time since union formation, all unions
Duration (years)
Sweden (1985-93)
Hungary (1988-93)
0 0 0
1 8 5
2 17 10
3 26 14
4 32 16
5 36 19
7 42 22
10 48 26
15 54 30
Mean dur: 4 5
(at union disruption /conditional on disruption within 15 years)
1st decile: 2 2
1st quartile: 3 9
Median: 12
--3rd quartile: --
--Mean dur: 9 12
We conclude our presentation of estimates of union-dissolution patterns with two further life tables. The first one (Table 27) gives estimates of union dissolution of marriages by time since marriage formation. This includes all marriages, whether they are preceded by cohabitation or not. Close to 30 percent of all marriages in Sweden end up in divorce/dissolution, while around a fifth of Hungarian marriages are dissolved after a period of 15 years from the marriage date. The propensity to divorce is a bit higher in Sweden than in Hungary at the higher marital durations.
Table 27: Cumulative percent separated, by time since marriage formation, all marriages
Duration (years)
Sweden (1985-93)
Hungary (1988-93)
0 0 0
1 2 2
2 5 4
3 7 6
4 9 7
5 11 9
7 15 13
10 21 17
15 28 21
Mean dur: 7 6
(of marriage, at union disruption /conditional on disruption within 15 years)
1st decile: 5 6
1st quartile: 13
--Median: --
--3rd quartile: --
--Mean dur: 13 13
(of all marriages /truncated after 15 years)
formation, whichever comes last, and is then followed until union disruption or censoring. Nevertheless, our tabulation demonstrates that unions of parents are dissolved at a much higher rate in Sweden than in Hungary (Note 8). We present more family-formation and family-dissolution measures in Section 8, where we study the experience of various family-transformation events from the point of view of children.
Table 28: Cumulative percent separated, by time since union formation/entry into parenthood, unions of parents
Duration (years)
Sweden (1985-93)
Hungary (1988-93)
0 0 0
1 4 3
2 8 5
3 12 7
4 16 9
5 20 11
7 24 14
10 29 18
15 36 21
Mean dur: 6 6
(at union disruption /conditional on disruption within 15 years)
1st decile: 3 5
1st quartile: 8
--Median: --
--3rd quartile: --
--Mean dur: 12 13
(of all episodes /truncated after 15 years)
than first-order ones, which more often end up in marriage. However, an exclusion of higher-order unions in Hungary results in even smaller number of exposed individuals and thus gives even less information on consensual-union behavior in that country than what we now can provide.
7. Summary measures of time spent in various family statuses
Before turning to our presentation of children’s experience of various family transformations, we complete our presentation of the adult individuals’ experience of different family-demographic events by displaying a few diagrams which present fractions of time spent in different family types at different ages. We present two diagrams for Sweden and two for Hungary, with one diagram for each sex and country. The diagrams display the observed distribution of men and women over family types at each exact age from age 15 to age 40, as given by the family statuses that respondents reported that they had at ages that fall in the calendar period we study (Note 9). Finally, the information in these diagrams is summarized directly in Table 29, which thus shows the total fraction of time that adult individuals spend in different family types during their reproductive ages if the distributions remain like those presented in our diagrams.
Figure 1: Distribution of Swedish men, by family type, ages 15-40 years
Figure 2: Distribution of Swedish women, by family type, ages 15-40 years
0% 10% 20% 30% 40% 50% 60% 70% 80% 90% 100%
15 16 17 18 19 20 21 22 23 24 25 26 27 28 29 30 31 32 33 34 35 36 37 38 39 40
age
disrupted union and parent disrupted union, no child married and parent married, no child cohabiting and parent cohabiting, no child single and parent single, no child in parental home, no family
0% 10% 20% 30% 40% 50% 60% 70% 80% 90% 100%
15 16 17 18 19 20 21 22 23 24 25 26 27 28 29 30 31 32 33 34 35 36 37 38 39 40
Figure 3: Distribution of Hungarian men, by family type, ages 15-40 years
Figure 4: Distribution of Hungarian women, by family type, ages 15-40 years
0% 10% 20% 30% 40% 50% 60% 70% 80% 90% 100%
15 16 17 18 19 20 21 22 23 24 25 26 27 28 29 30 31 32 33 34 35 36 37 38 39 40
age
disrupted union and parent disrupted union, no child married and parent married, no child cohabiting and parent cohabiting, no child single and parent single, no child in parental home, no family
30% 40% 50% 60% 70% 80% 90% 100%
Table 29: Percent of time spent in different family types at ages 15-39 years
Swedish: Hungarian:
men women men women
(1978-93) (1988-93)
In parental home /no family 23 17 41 26
Single and never in union/ no child
15 12 2 2
Single and never in union/ parent
0 1 0 1
In consensual union /no child 14 14 2 2
In consensual union /parent 11 13 1 3
In marriage /no child 3 3 6 7
In marriage /parent 26 31 43 54
Single after family disruption/ no child
5 4 2 1
Single after family disruption/ parent
3 6 2 5
(Note 10)
Time in union 54 61 52 65
- in union as a parent 37 44 44 56
- in union but no child 17 18 8 9
Time as parent 41 50 46 62
- as parent in union 37 44 44 56
8. Children’s experience of family dynamics
(as reported by their mothers)
In this last section of life-table presentations, we present various estimates of children’s experience in different types of families: experience of family dissolution and of family (re-)formation. We use children from the mother’s birth records as our units of observation. We leave out children from the fathers’ records since children live separated from their fathers more often than from their mothers (e.g., in case of union disruption) and we lack information on large segments of these latter children’s lives. Again we present estimates for a synthetic cohort corresponding to the period shortly before each survey date. In this section, our period of study is the six-year period just before the survey both for Hungary and for Sweden, relating to children’s experiences during the late 1980s to early 1990s.
Our tables describe the family-transformation experience of biological children in Hungary and Sweden (of women at reproductive ages born in any country of the world). For Hungary, we have no information about the migration histories of mothers so we do not know to what extent reported children really have lived in the country that we study. For Sweden, we have access to such information and we have included all children that were born in that country in our study population. For both countries, we censor observation at the child’s 15th birthday. Likewise, we censor a record when a child dies and, where appropriate, when a child stops living with its mother. We do not include any information on the family experience of stepchildren or adopted children. We report the cumulative percent of a given group of children who have experienced a particular event by each of their first four birthdays, followed by exact ages 6, 9, 12, and 15 years.
Table 30 presents the distribution of births that mothers had reported for the six-year period immediately prior to the survey(s).
Table 30: Relative distribution of births (percent)
Sweden (1987-93)
Hungary (1988-93)
Children born to mother never in union 1 2
Very few children in both countries are born to a lone mother. In Hungary, the great majority of children are born to a married mother while almost half of the children born in Sweden reportedly are born to a mother in a consensual union.
8.1 Children’s experience of family disruption
In our first two life tables related to children’s family experience, we describe their experience of living outside a traditional family of two (married) biological parents. We present the cumulative percent of children who have ever lived outside a union (Table 31) and outside a marriage (Table 32), by age of child. In these first two tabulations, we count children born to a lone mother, or to an unmarried mother, already at age 0, i.e., we allow the starting values of our life tables to be positive.
In all our tabulations of children’s subsequent experience of family disruption, we account for three different ways that a child can leave the union of its family of origin, namely (i) the departure of the father from the family in connection with union dissolution / divorce, (ii) the death of the father, and (iii) the separation of the child itself from its mother. The latter event can occur either in connection with a union dissolution of the parents, namely if the child leaves the mother in order to live with the father, or when the child leaves the mother in order to live on its own or with some other person.
Table 31: Cumulative percent ever out of union, by age of child
Age Sweden
(1987-93)
Hungary (1988-93)
0 5 3
1 7 5
2 9 6
3 13 8
4 15 10
6 20 13
9 24 17
12 30 21
Table 31 demonstrates that around one third of all children born in Sweden will experience not living with both parents in a union before their 15th birthday, while around one quarter of children in Hungary will have this experience. If we focus just on marital status, we see that around 60 percent of all children in Sweden will have the experience of not living with two married parents (Table 32).
Table 32: Cumulative percent ever out of marriage, by age of child
Age Sweden
(1987-93)
Hungary (1988-93)
0 49 10
1 50 11
2 51 11
3 52 13
4 53 15
6 55 18
9 57 21
12 60 25
15 61 28
Table 33: Cumulative percent ever out of union, by age of child, for children born in a union
Age Sweden
(1987-93)
Hungary (1988-93)
0 0 0
1 2 1
2 5 2
3 9 4
4 11 7
6 16 10
9 21 14
12 26 18
15 30 22
Mean age: 6 7
(at union disruption /conditional on disruption during childhood)
1st decile at age: 4 6
1st quartile: 11
--Median at age: --
--3rd quartile: --
--Mean duration: 12 13
(of all episodes /truncated after 15 years)
Children born in unions in Sweden more often experience family disruption than children born in Hungarian unions. The cumulative percent who have ever moved out of the original union are higher in Sweden at every single age. Around 30 percent of all children would experience such an event before their 15th birthday – if the disruption rates observed for 1987-93 had prevailed. For Hungary, around 20 percent of children born in a union would have that experience.
or a fourth (Sweden) of such children experience a family dissolution of some kind before they turn 15.
Table 34: Cumulative percent ever out of union, by age of child, for children born in a consensual union
Age Sweden
(1987-93)
Hungary (1988-93)
0 0 0
1 4 7
2 8 11
3 13 17
4 17 26
6 23 42
9 27 48
12 32 52
15 38 58
Mean age: 6 5
(at union disruption /conditional on disruption during childhood)
1st decile: 3 2
1st quartile: 8 4
Median: -- 11
3rd quartile: --
--Mean duration: 12 9
Table 35: Cumulative percent ever out of union/marriage, by age of child, for children born in a marriage
Age Sweden
(1987-93)
Hungary (1988-93)
0 0 0
1 1 1
2 2 2
3 5 4
4 6 5
6 10 9
9 15 12
12 21 17
15 24 20
Mean age: 7 7
(at union disruption /conditional on disruption during childhood)
1st decile: 6 7
1st quartile: --
--Median: --
--3rd quartile: --
--Mean duration: 13 13
(of all episodes /truncated after 15 years)
8.2 Children’s experience of family formation
Births to lone women are relatively uncommon both in Sweden and in Hungary. In addition, substantial fractions of these children experience a family-formation event after some time, so we are faced with data subsets that are too tiny for any extended analyses of these children’s family-formation experience. We have to stop observation at a relatively early stage in these groups of children’s lives. Nevertheless, we can notice that the family-formation process of children born to lone women in Hungary appears to be faster than that of children born to lone women in Sweden.
Table 36: Cumulative percent ever in union, by age of child, for children born to a lone mother
Age Sweden
(1987-93)
Hungary (1988-93)
0 0 0
1 19 23
2 27 37
3 29 52
4 41 62
6 43
--9 52
--12 --
--15 --
--Mean age: --
--(at entry to union /conditional on union formation)
1st decile: 1 1
1st quartile: 2 2
Median: 9 3
3rd quartile: --
--Mean duration: --
Table 37: Cumulative percent ever in marriage, by age of child, for children born to a lone mother
Age Sweden
(1987-93)
Hungary (1988-93)
0 0 0
1 1 11
2 3 18
3 7 30
4 11 39
6 15
--9 25
--12 32
--15 35
--Mean age: 6
--(at entry to marriage /conditional on marriage formation)
1st decile: 4 1
1st quartile: 9 3
Median: --
--3rd quartile: --
--Mean duration: 12
--(of all episodes /truncated after 15 years)
Table 38: Cumulative percent ever in marriage, by age of child, for children born in a consensual union
Age Sweden
(1987-93)
Hungary (1988-93)
0 0 0
1 17 11
2 27 18
3 38 22
4 45 25
6 56 36
9 68 49
12 76
--15 81
--Mean age: 5
--(at entry to marriage /conditional on marriage formation)
1st decile: 1 1
1st quartile: 2 4
Median: 5
--3rd quartile: 12
--Mean duration: 7
--(of all episodes /truncated after 15 years)
The table demonstrates that marriage formation actually is very common in Swedish child families: Eventually, around 80 percent of Swedish children from a consensual union would at some point in time live in a marital family – if the transition patterns as observed in 1987-1993 had prevailed. In Hungary, on the other hand, this process appears to take place at a much slower pace. Again, this might reflect that non-marital unions in that country are not as common as in Sweden and that they mainly occur to a select group of people, with a behavior of relative family instability.
the case of Sweden, and to some extent also for Hungary, the patterns of this table very much resemble those of Table 38, since most children who are born out of wedlock here are born in a consensual union. Again, we have censored our observations when a child dies and when it stops living with its mother but not when it experiences a union dissolution of the mother.
Table 39: Cumulative percent ever in marriage, by age of child, for children born to a non-married mother
Age Sweden
(1987-93)
Hungary (1988-93)
0 0 0
1 15 11
2 26 18
3 35 25
4 43 30
6 53 45
9 65 57
12 73
--15 77
--Mean age: 5
--(at entry to marriage /conditional on marriage formation)
1st decile: 1 1
1st quartile: 2 3
Median: 6 7
3rd quartile: 14
--Mean duration: 7
8.3 A competing-risks model of family transformation for children born in a consensual union
As in our presentation of male and female cohabitants’ experiences in their unions (Section 6.2), we can estimate a competing-risks model for the actual experience of children born in consensual unions. We then follow them until they exit from the state of being in a family with two cohabiting parents – either through the event of a family dissolution of some kind (Table 41) or through the transformation of the parental union into a formal marriage (Table 40). The sum of these two tables then represents the cumulative percent of such children who will ever exit from the consensual-union status of their family of origin (Table 42).
Table 40: Cumulative percent in marriage, by age of child, for children born in a consensual union, competing-risks life-table method with family dissolution as competing event
Age Sweden
(1987-93)
Hungary (1988-93)
0 0 0
1 16 11
2 27 17
3 37 21
4 44 24
6 54 32
9 62
--12 67
--15 70
--Mean age: 4
--(at entry to marriage /conditional on marriage formation)
1st decile: 1 1
1st quartile: 2 5
--Table 41: Cumulative percent out of union, by age of child, for children born in a consensual union, competing-risks life-table method with marriage formation of parents as competing event
Age Sweden
(1987-93)
Hungary (1988-93)
0 0 0
1 4 7
2 8 11
3 11 16
4 14 24
6 19 39
9 20
--12 21
--15 22
--Mean age: 4
--(at union disruption /conditional on disruption)
1st decile: 3 2
1st quartile: -- 5
Median: --
--=> Table 42: Cumulative percent ever out of consensual-union status, by age of child, for children born in a consensual union
Age Sweden
(1987-93)
Hungary (1988-93)
0 0 0
1 20 18
2 35 28
3 48 37
4 58 48
6 73 71
9 82
--12 88
--15 92
--Mean age: 4
--(at exit /conditional on exit from consensual-union status)
1st decile: 1 1
1st quartile: 2 2
Median: 4 5
3rd quartile: 7
--Mean duration: 5
--(of all episodes /truncated after 15 years)