Procedia CIRP 10 ( 2013 ) 271 – 275
2212-8271 © 2013 The Authors. Published by Elsevier B.V.
Selection and peer-review under responsibility of Professor Xiangqian (Jane) Jiang doi: 10.1016/j.procir.2013.08.041
ScienceDirect
12th CIRP Conference on Computer Aided Tolerancing
The assessment of straightness and flatness errors using particle
swarm optimization
C. Cui
a,b,*, T. Li
a, L. A. Blunt
a, X. Jiang
a, H. Huang
b, R. Ye
band W. Fan
b aEPSRC Innovative Manufacure Research Centre in Advanced Metrology, Centre for Precision Technologies, School of Computing andEngineering, University of Huddersfield, Queensgate, Huddersfield, HD1 3DH, UK
b College of Mechanical Engineering and Automation, Huaqiao University, Xiamen, 361021, China
Abstract
The straightness and flatness errors are generally assessed by using the Least Squares Method (LSM). However, the results obtained from LSM often overestimate the tolerances, and are not consistent with the ISO standards’ definitions. To this end, this paper presents a method to evaluate those errors by using particle swarm optimization (PSO). The realization technique is detailed. The experimental data is utilized to verify this algorithm, together with a comparison with some typical optimization algorithms.
© 2012 The Authors. Published by Elsevier B.V. Selection and/or peer-review under responsibility of Professor Xiangqian Jiang.
Keywords: form error; straightness; flatness; assessment; Particle Swarm Optimization(PSO); optimization
1.Introductiona
The evaluation of form errors, such as straightness and flatness, are of importance for the precision mechanical manufacturing. In practice, it is impossible (and also unnecessary in many cases) to obtain the variation over the whole surface of a workpiece. Only finite points, therefore, are collected from the surface to represent its features. To assess the tolerance errors, it is important to select an appropriate algorithm to extract the feature from the measured dataset. Note that an inappropriate algorithm may overestimate the tolerance and lead to unnecessary rejection.
The definitions of straightness and flatness have been specified by the International Standard Organization (ISO) in detail [1] and they have been improved greatly and rapidly with the development of science and technology worldwide. Those errors are determined by
a* Corresponding author. Tel.: +44-1484-471284; fax:+44-1484-472161.
E-mail address: [email protected]
both the location and orientation of a reference datum. The datum is unknown in advance before assessing the tolerance, and their assessments are non-linear issues. Generally, they are evaluated by the Least Squares Method (LSM) and minimum zone algorithms. The LSM is a traditional method which is to find the result under the condition, that the sum of the squares of the residuals (between the sampled values and calculated values) is minimized. It has been widely accepted in many fields such as in the form errors assessment due to the uniqueness of its results and the simplicity on its computation. The problem is that the LSM is an approximative method, which could lead an overestimation the tolerance and results in an unnecessary rejection [2,3]. To replace the LSM, thus, many algorithms have been proposed, e.g. the optimization algorithms. And most of them conform to the minimum zone principle [4,5]. However, some of them have difficulty on its understanding, interpreting and implementing. And some of them cannot assess all items of the geometrical errors at the same time. Thus, researchers introduce the optimization algorithm, such as
© 2013 The Authors. Published by Elsevier B.V.
the genetic algorithm (GA) and particle optimization algorithm (PSO). The GA is a little more complex than PSO in the principle for the same work [6,7]. Some PSO-based algorithms have already been developed to evaluate the cylindricity errors [8-10].
This paper documents the PSO-base algorithm for the evaluation of the straightness and flatness errors. Section 2 presents the modeling of those errors. The implementation is detailed in Section 3. Section 4 presents the verification of this method, together with a comparison between some of the typical methods. Section 5 concludes that PSO has advantages in the assessment on the straightness and flatness.
2.Computation models for straightness and flatness
errors
2.1.Straightness error
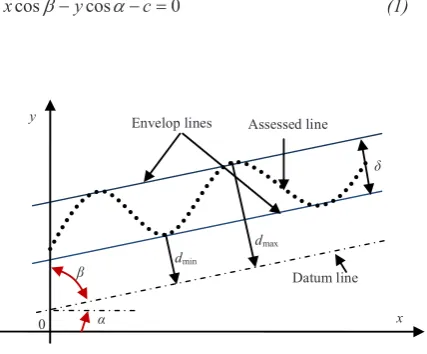
Adhering to the definition given by ISO 1101 [1], the datum of an evaluated straight line can be expressed as:
cos cos 0
x y c (1)
where and are the direction angles ( 90 ), x
and y are the coordinates of the line, and c is a constant (see Fig. 1). Now suppose X ( ) is the unknown parameter vector, and { } {Pi xi yi},(i 1, 2,... )n are the coordinates of samples of the assessed line. The straightness error is,
max min
( ) max{ } min{ } , 1, 2,....,
i i
h X d d
d d i n (2)
where di xicos yicos c. Then the error of the straight line is,
min[ ( )]h X (3)
2.2.Flatness error
Adhering to ISO’s definition [1], the datum plane of an evaluated plane can be expressed as:
cos cos cos 0
x y z c (4)
where, , and are the direction angles of the plane, x,
y and z are the coordinates of the plane, and c is a constant (see Fig. 2). Suppose X ( , , ) is the unknown parameter vector, and
{ } {Pi xi yi zi} (i 1, 2,... )n are the coordinates of samples of the plane. Then the objective function of flatness error is:
max min
( ) max{ } min{ } , 1, 2,....,
i i
h X d d
d d i n (5)
where di xicos yicos zicos c . Then the error of the plane is the minimum of h(X), i.e.
min[ ( )]h X (6)
3.Realization technique of PSO in form errors
optimization
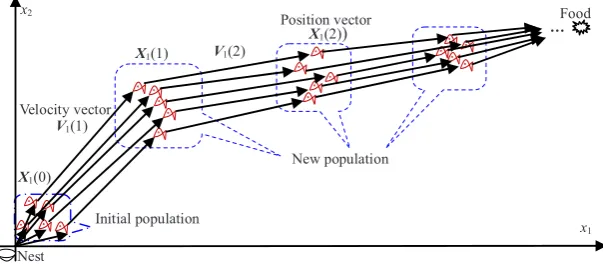
The Particle Swarm Optimization is a stochastic evolutionary method first proposed by Kennedy and Eberhart in 1995 [11,12]. PSO is made up of a swarm of particles. Particle represents a potential solution, and will move within a multidimensional search space in order to find the best position.
Suppose that the search space is D-dimensional, the
ith particle of the swarm is represented by a D -dimensional vector Xi (xi1,...,xid,...,xiD) , and the velocity of this particle is represented by
1
( ,..., ,..., ).
i i id iD
V v v v This two dimensional searching space is shown in Fig.3. The velocity and new position
dmax
dmin
x y
0
[image:2.595.68.285.302.679.2]Datum line Envelop lines Assessed line
[image:2.595.69.283.321.498.2]Fig. 2 Flatness error assessment
Fig. 1 Straightness error assessment model
dmax
dmin
x z
0
y
of the ith particle are updated by the following equations:
1 1
2 2
( 1) ( ) ( ) ( ( ) ( )) ( ( ) ( ))
id id imd
id gd id
v t t v t c r x t
x t c r x t x t (7)
( 1) ( ) ( 1)
id id id
x t x t v t (8)
where, is the inertia weight to control the impact of velocity of previous particles. r1 and r2 are
independently uniformly distributed random variables within range (0,1). c1 and c2 are positive constant
parameters, called acceleration coefficients, which control the maximum step size. xgd is the dth
dimensional parameter of the best point which the swarm can find out. ximd is the dth dimensional
parameter of the best point which the ith particle can get.
t is the evolution generation.
The particles are encoded by using real numbers. For each partical, xid is corresponds to the dth dimensional
variable or optimization parameter of the optimization problem, and vid is the increment or evolutionary step
correspondingly.
The fitness function bridges the problem and the optimization algorithm. Optimization problems can be grouped into two classes, maximization and minimization. For the evaluation of straightness and flatness, the fitness functions of PSO is given as:
1 ( )
( )
f X
h X (9)
where, h(X) is the objective function of straightness and flatness error as shown in section 2, is a small parameter to keep f(X) meaningful.
Inertia weight is used to adjust the impact of the velocity of the previous generation of particles to the new particles. It changes with the evolution to achieve a
finer adjustment. It is expected that the inertia weight decreased gradually with the evolution from a bigger value to a smaller one, and an adjustment strategy [13] is expressed as:
( )( )
( ) s e
e T t t
T (10)
where, t is the current generation of the evolution, T is the total generations of evolution, s is the initial inertia
weight, e is the ultimate inertia weight.
According to the search principle of PSO, the new generation of particles comes from the best particle of the current generation and found by the whole swarm. Suppose that the search space is D-dimensional, and the best particle of the swarm and the velocity of this partial can be represented by Xm=(xm1, …xmd,… xmD), and Vm=(vm1,… vmd, …vmD) respectively. On the basis of
Equ. (7), the new velocity of a particle is generated as follow:
( 1) ( ) ( ) ( ( ) ( ))
id md i gd md
v t t v t cr x t x t (11)
where, ri is a randomly distributed variable with range
(0,1), c is a positive constant parameter.
In terms of Equ. (11), the variation of the random parameter ri can produce a group of increments that their
center is the best particle of the former generation swarm, and generate a group of new particles. Based on Equ. (8), the D-dimension new position of the ith particle is generated as follow:
( 1) ( ) ( 1)
id md id
x t x t x t (12)
4.Experimental validation and discussion
To validate this proposed PSO algorithm, a comparison has undertaken by using datasets in
X1(0)
Initial population
V1(1)
New population
X1(2))
X1(1) V1(2)
Velocity vector
Position vector …
x1
x2
Nest
[image:3.595.71.373.73.205.2]Food
reference [14]. Table 1 & 2 list the results obtained from different algorithms, i.e. Least Squares Method (LSM), Optimization Technique Zone (OTZ) [14], Linear Approximation Technique (LAT) [14], Genetic Algorithm [7] and PSO. The condition for PSO is listed as follows. The constant c in Equ (11) is set to 2. The inertia weight changes from 0.9 to 0.4. The particle number S is 20. The particle dimension D is 1 and 2 for straightness and flatness respectively. The initial particles are produced based on the result given by the LSM. The maximum velocity Vmax is set as the distribution range of the measurement data, and the termination condition is the maximum evolution generations 40.
Compared with LSM, the results in Table 1 & 2 show that the PSO is an effective optimization algorithm which assesses the flatness and straightness errors with improved precision. And the precision of the results of obtained from PSO algorithms are at the same level as that of OTZ, LAT, and GA (see Table 1 & 2). The advantages of PSO are its relative simple principle and the east of its realization.
5.Conclusions
In this paper, a particle swarm optimization algorithm has been developed to solve the optimization problem of straightness and flatness evaluation. The given examples show the improved precision of the proposed algorithm than that of LSM. The effectiveness of those algorithms has been illustrated via a comparison with other optimization algorithms.
Acknowledgements
The Project is supported by the Program for Changjiang Scholars and Innovative Research Team in University (No.PCSIRT1063), Program for New Century Excellent Talents in University (No. NCET-10-0116). The authors would like to thank the EPSRC Centre for Innovative Manufacturing in Advanced Metrology, UK.
References
[1] ISO 1101(2004), Geometrical Product Specification (GPS) - Geometrical tolerancing- Tolerancing of form, orientation, location and run-out.
[2] G.L. Samuel, M.S. Shunmugam. Evaluation of Circularity from Coordinate and Form Data using Computational Geometric Techniques. Journal of the International Societies for Precision Engineering and Nanotechnology. 2001, 25(4): 251-263 [3] Tohru Kanada. Evaluation of Sphericity Form Error-Computation
Sphericity by Means of Minimum Zone Method and Some Examinations with using Simulating Data. Precision Engineering. 1995, 17(4): 281-289
[4] Mark T. Traband, Sanjay Joshi, Richard A. Wysk, Tom M. Cavalier. Evaluation of Straightness and Flatness Tolerance using the Minimum Zone. Manufacturing Review. 1989, 2(3): 189-195 [5] Jyunping Huang. An Exact Minimum Zone Solution for
Three-Dimensional Straightness Evaluation Problems. Precision Engineering. 1999, 23(3): 204-208
[6] Hsin-Yi Lai, Wen-Yuh Jywe, Cha’o-Kuang Chen, Chien-Hong Liu. Precision Modeling of Form Errors for Cylindricity Evaluation using Genetic Algorithm. Precision Engineering. 2000, 24(4): 310-319
a Optimization technique zone b Liner approximation technique c Genetic algorithm
Table1. Results of straightness errors (inch)
Table2. Results of flatness errors (inch)
a Optimization technique zone b Liner approximation technique c Genetic algorithm
Examples LSM OTZ[14]a LAT[14]b GA[7]c PSO
1 0.0017 0.0017 0.0017 0.001672 0.001711
2 0.0015 0.0014 0.0014 0.001428 0.001401
3 0.0049 0.0047 0.0047 0.004687 0.004706
4 0.0025 0.0023 0.0023 0.002266 0.002291
5 0.0011 0.0011 0.0011 0.001079 0.001104
Examples LSM OTZ[14]a LAT[14]b GA[7]c PSO
[7] Changcai Cui, BingLi. Fugui Huang, Rencheng Zhang.(2007) ‘Genetic algorithm based form error evaluation’, Measurement science and technology, Vol. 18, No. 7, pp. 1818-1824. [8] Changcai Cui, Fugui Huang, Rencheng Zhang, Bing Li. Particle
Swarm Optimization and its Application in Cylindricity Error Evaluation. Optics and Precision Engineering. 2006, 14(2): 256-260.
[9] Xiulan Wen, Jiacai Huang, Danghong Sheng, Fenglin Wang. Conicity and cylindricity error evaluation using particle swarm optimization. Precision Engineering, 2010, 34(2):338-344 [10] Xiangchao Zhang, Xiangqian Jiang, Paul J. Scott. A reliable
method of minimum zone evaluation of cylindricity and conicity from coordinate measurement data, Precision Engineering, 2011, 35(3):484-489
[11] Kennedy, J., Eberhart, R.C. (1995) ‘Particle swarm optimization’, Proc. IEEE Conf. on Neural Networks, IV, Piscataway, NJ, USA, pp. 1942-1948.
[12] Eberhart, R.C, Kennedy, J.(1995) ‘A new optimizer using particle swarm theory’, Proc.of the Sixth International Symposium on Micromachine and Human Science, Nagoya, Japan, pp. 39-43. [13] Shi, Y., Eberhart, R.C.(1998) ‘A modified particle swarm
optimizer’, Proc.of the IEEE Conference on Evolutionary Computation, pp69~73.
[14] Weber, T., Motavalli, S., Fallahi, B., Cheraghi, S.(2002) ‘A unified approach to form error evaluation’, Precision engineering, Vol. 26, No. 3, pp. 269~278.