Available online on www.ijpsr.com 319
IJPSR (2011), Vol. 2, Issue 2 (Research Article)
Received on 24 September, 2010; received in revised form 26 November, 2010; accepted 12, January 2011
DEVELOPMENT OF REVERSE PHASE HIGH PERFORMANCE LIQUID CHROMATOGRAPHY METHOD AND ITS VALIDATION FOR ESTIMATION OF FORMOTEROL FUMARATE ROTA CAPS
Siraj Ahmed*1, B. Jayakar 2 and M. A. Aleem 1
Department of Pharmaceutical Analysis, MESCO College of Pharmacy 1, Hyderabad, Andhra Pradesh, India
Department of Pharmaceutical Analysis, Vinayaka missions College of Pharmacy 2, Salem, Tamil Nadu, India
ABSTRACT
A simple, rapid and reproducible HPLC method was developed and validated for the estimation of Formoterol Fumarate Rotacaps. Symmetry C8 (4.6×150mm, 5 µ) column, in isocratic mode with mobile phase containing Ammonium Acetate Buffer pH 5.0 and Acetonitrile (80:20) was used. The flow rate was 1.0 ml/min and the analyte was monitored at 254 nm. The retention time for Formoterol was about 4.6 mins. The system was validated for precision, accuracy, linearity, limit of detection and limit of quantitation. The Linearity was obtained in the concentration range of 30µg/ml to 180µg/ml with correlation coefficient of 0.999. The percentage recovery of Formoterol was found to be in the range of 98% -102%. Therefore it was concluded that the proposed method can be used for routine analysis of Formotero Fumarate Rota caps.
Keywords:
Reverse phase HPLC, Method Development,
Retention time, Validation Parameters
Correspondence to Author:
Siraj Ahmed
Available online on www.ijpsr.com 320 INTRODUCTION: Formoterol fumarate is a selective
β-2-adreno receptor agonist 1, is chemically N- [2-hydroxy- 5- [1- [2-hydroxy-2- [2- (4-methoxyphenyl)-1- methyl- ethyl] amino- ethyl] - phenyl] methanamide 2. Methods for analysis of formoterol fumarate as reviewed from published literature are HPLC 3, 4, Gas Chromatography 5, Spectro photometeric 6 and Electrophoresis 7. In the present work, efforts have been made to develop simple, rapid, specific and sensitive RP-HPLC method for the determination of Formoterol Fumarate in dosage form for a routine analysis and to validate the Propose method according to ICH guidelines 8, 9. Review of the literature for Formoterol Fumarate regarding its physical and chemical properties, various analytical methods that were conducted for Formotero Fumarate form the basis for development of new analytical RP-HPLC method for Formoterol Fumarate rota caps formulation.
MATERIALS AND METHOD: Formoterol Fumarate
was obtained as a gift sample from Pharma-train Laboratories Ltd., and Ammonium acetate, Acetonitrile, Hydrochloric Acid, Glacial Acetic Acid and all other ingredients used were AR Grade. Development of the Method by RP-HPLC: Buffer preparation: Weighed 7gms of Potassium dihyrogen ortho phosphate into 1000ml of HPLC water and the pH was adjusted to 5 with
orthophosphoric acid, filtered through 0.45µm membrane filter and degassed.
Mobile phase: Buffer and acetonitrile were mixed in the ratio of 80: 20 and sonicated to degas. Standard preparation: Accurately weigh and transfer 30 mg of Formoterol Working standard into a 100 mL volumetric flask add about 70 mL of diluent and sonicated to dissolve it completely and make volume up to the mark with the same solvent (Stock solution).Further pipetted 4 ml of the above stock solution into a 10ml volumetric flask and diluted up to the mark with diluent, mixed well and filtered through 0.45µm filter.
Sample Solution:
Preparation: Weigh 100 Formoterol Fumarate Rotacaps and calculate the average weight. Remove the capsule shells and accurately weigh and transfer the content of test substance into a 10mL volumetric flask. Added about 1ml dilute Hydrochloric acid and sonicated to dissolve it completely and made volume up to the mark with diluents. Mixed well and filter through 0.45µm filter.
[image:2.612.78.537.536.678.2]Procedure: Separately injected 10l of the blank, Standard and sample solution into the chromatographic system, chromatographs are recorded and the peak areas were measured.
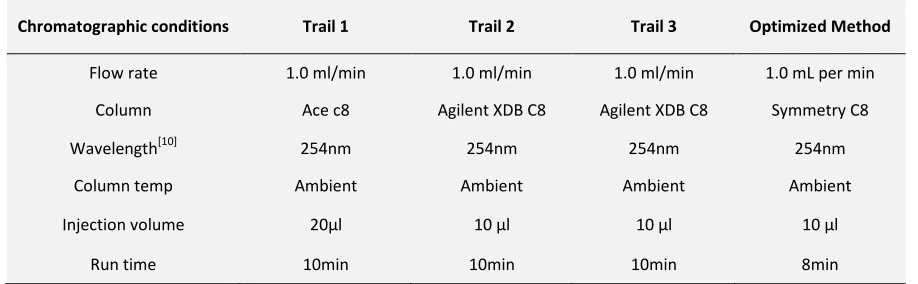
TABLE 1: CHROMATOGRAPHIC CONDITIONS USED FOR METHOD DEVELOPMENT
Chromatographic conditions Trail 1 Trail 2 Trail 3 Optimized Method
Flow rate 1.0 ml/min 1.0 ml/min 1.0 ml/min 1.0 mL per min
Column Ace c8 Agilent XDB C8 Agilent XDB C8 Symmetry C8
Wavelength[10] 254nm 254nm 254nm 254nm
Column temp Ambient Ambient Ambient Ambient
Injection volume 20µl 10 µl 10 µl 10 µl
Available online on www.ijpsr.com 321 Validation of Developed Method:
1. Precision:
a. Standard Precision: The standard solution was injected for five times and the area measured for all five injections in HPLC. The %RSD for the area of five replicate injections was found to be within the specified limits.
b. Intermediate precision (Day to day variability): To evaluate the intermediate precision (also known as Ruggedness) of the method, Precision was performed on different day by using different make column of same dimensions.
c. Method Precision (Sample Precision): Three different sample solutions was prepared as per test procedure and injected into the chromatographic system.
Preparation of stock solution: Accurately 30 mg of Formoterol was weighed and transferred into a 100 mL volumetric flask and about 70mL of diluent was added and sonicated to dissolve it completely and made volume up to the mark with the same solvent (stock solution).
Acceptance Criteria: The %RSD for the area of five standard injections results should not be more than 2%.
2. Accuracy (Recovery): The standard solution, Accuracy 50%, Accuracy 100% and Accuracy -150% solutions of the target concentration was injected and the Amount found and Amount added for Formoterol Fumarate was calculated and then the individual recovery and mean recovery values was calculated.
Acceptance Criteria: The % Recovery for each level should be between 98.0 to 102.0%.
3. Linearity of Test Method: A series of solutions was prepared using Formoterol working standard at concentration levels from 30µg/mL to 180µg/mL (30, 60, 90,120,150,180µg/mL). Each level was injected into the chromatographic system and the peak area was measure. Plot a graph of peak area versus concentration (on X-axis concentration and on Y-axis Peak area) and calculate the correlation coefficient.
Acceptance Criteria: Correlation coefficient should be not less than 0.999.
4. Limit of Detection: Solutions was prepared using Formoterol working standard at concentration of 0.12µg/mL and the signal ratio was calculated.
Acceptance Criteria: S/N Ratio value shall be 3 for LOD solution.
5. Limit Of Quantification: Solutions were prepared using Formoterol working standard at concentration of 0.42µg/mL and calculated the Signal to Noise Ratio as follows.
Acceptance Criteria: S/N Ratio value shall be 10 for LOQ solution
RESULTS AND DISCUSSION:
Development of the Method by RP-HPLC:
Trial 1: Theoretical plates are very less, peak symmetry is not seen.
Trial 2: Theoretical plates are within the limit, retention time is reduced to 2.7 min but there is poor resolution between the blank and the main peak.
Available online on www.ijpsr.com 322
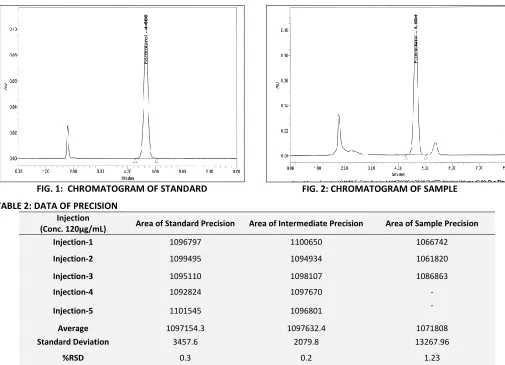
FIG. 1: CHROMATOGRAM OF STANDARD FIG. 2: CHROMATOGRAM OF SAMPLE TABLE 2: DATA OF PRECISION
Injection
(Conc. 120μg/mL) Area of Standard Precision Area of Intermediate Precision Area of Sample Precision
Injection-1 1096797 1100650 1066742
Injection-2 1099495 1094934 1061820
Injection-3 1095110 1098107 1086863
Injection-4 1092824 1097670 -
Injection-5 1101545 1096801 -
Average 1097154.3 1097632.4 1071808
Standard Deviation 3457.6 2079.8 13267.96
%RSD 0.3 0.2 1.23
Result for Standard Precision: The S.D, R.S.D of % amount of Formoterol Fumarate was found to be 3457.6 and 0.3% respectively. The R.S.D was found to be less than 2. Therefore this method has good reproducibility.
Result for Intermediate Precision: The S.D, R.S.D of % amount of Formoterol Fumarate was found to be 2079.8 and 0.2% respectively.
[image:4.612.46.568.556.692.2]Result for Method Precision: The S.D, R.S.D of % amount of Formoterol Fumarate was found to be 13267.96 and 1.23% respectively.
TABLE 3: DATA FOR ACCURACY (RECOVERY)
%Conc. Area Mean Area Amount Added (mg) Amount Found (mg) % Recovery Mean Recovery
50%
550460
549205 14.5 14.32 99%
98.2% 549395
547760
100%
1023594
1055851 28.9 27.53 96.6%
1057949 1086009
150%
1626054
1604678 43 41.84 96.2%
Available online on www.ijpsr.com 323 Result for Accuracy 50%: The % Recovery of
accuracy 50% was found to be 99%.
Result for Accuracy 100%: The % Recovery of accuracy 100% was found to be 96.6%.
Result for Accuracy 150%: The % Recovery of accuracy 150% was found to be 96.2%. The mean recovery of 50%, 100%, and 150% was found to be 98.2%.
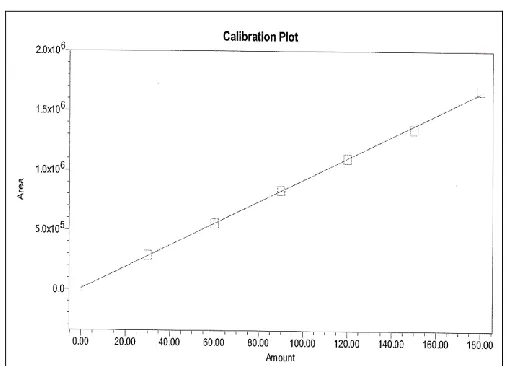
TABLE 4: DATA FOR LINEARITY:
S. No Linearity Level Area
1 30 µg/ml 287232
2 60 µg/ml 555296
3 90 µg/ml 833652
4 120 µg/ml 1099501
5 150 µg/ml 1343476
6 180 µg/ml 1672606
Correlation Coefficient 0.9993
Correlation Coefficient = 0.999
FIG. 3 LINEARITY GRAPH OFFORMOTEROL
[image:5.612.44.297.403.586.2]Result for linearity: With increase in the concentration, area is increasing linearly; hence the method had linearity range from 30ppm to 180ppm.
TABLE 5: DATA FOR LIMIT OF DETECTION
Limit of Detection Value Obtained
Average Baseline Noise obtained from Blank (N)
42 µV
Signal Obtained from LOD solution (S) 146
S/N valve of LOD was found to be 3.4 and is within the limit.
TABLE 6: LIMIT OF QUANTIFICATION
Limit of Detection Value Obtained
Average Baseline Noise obtained from Blank (N) 42 µV
Signal Obtained from LOD solution (S) 415
S/N valve of LOD was found to be 9.9 and is with in the limit.
CONCLUSION: By studying the results generated during Assay method validation of Formoterol Fumarate Rotacaps, it is concluded that the method is precise, accurate, and linear for performing the Assay analysis. A simple, rapid and reproducible HPLC method was developed and validated for the estimation of Formoterol Fumarate Rotacaps. A C8 (4.6×150mm, 5 µ) column, in isocratic mode with mobile phase containing Ammonium Acetate Buffer pH 5.0 and Acetonitrile (80:20) was used. The flow rate was 1.0 ml/min and the analyte was monitored at 254 nm. The retention time for Formoterol was about 4.6 mins.
Available online on www.ijpsr.com 324 REFERENCES:
1. Joseph Caruso, Guangchun Zhou et al., XenoBiotic
Laboratories, A sensitive and specific liquid
chromatographic- tandem mass spectrometric
(LC/MS/MS) method capable of quantifying R,R)/(S,S)- Formoterol and (R,S)/(S,R)-Formoterol (in Human Plasma and Urine is described.
2. Sharma BK. Instrumental methods of chemical analysis, In; Introduction to Analytical chemistry: Goel Publishing House Meerut, 23thedition; 2004.
3. Basic Education in Analytical Chemistry. Analytical Science. 2001:17(1).
4. Willard HH, Merritt LL, Dean JJA, Frank AS. Instrumental method of analysis: CBS Publishers and Distributors, New Delhi, 7th Edition; 1986.
5. D.A, Holler F.J, Nieman, T.A. Principles of Instrumental Analysis 5th edition by Skoog
6. Michael E, Schartz IS, Krull. Analytical method
development and Validation. 2004: 25-46.
7. Sandeep S. K, Balaphanisekhar. HPLCmethod of analysis using wakosil C-18 column for the determination of Formoterol fumarate in rotacap formulation. Indian Drugs 40(10), Oct 2003; 592-593.
8. Quality Assurance of Pharmaceuticals Geneva: World Health Organization, 999.
9. Method validation guidelines International Conference on harmonization; GENEVA; 1996.
10. P.N.S.PAI, S.K. Sandeep and A.B.P.Sekar. A new simple, sensitive spectrometric method was developed on the basis of a colour reaction of formoterol with diazotised p- nitroaniline.