BIROn - Birkbeck Institutional Research Online
dos Reis, M. and Savva, Renos and Wernisch, Lorenz (2004) Solving the
riddle of codon usage preferences: a test for translational selection. Nucleic
Acids Research 32 (17), pp. 5036-5044. ISSN 0305-1048.
Downloaded from:
Usage Guidelines:
Please refer to usage guidelines at
or alternatively
Birkbeck ePrints: an open access repository of the
research output of Birkbeck College
http://eprints.bbk.ac.uk
dos Reis M., Savva R., and Wernisch L.
Solving the riddle of codon usage preferences:
a test for translational selection
Nucleic Acids Research 32 (17),
(2004): 5036-5044.
This is an exact copy of an article published in
Nucleic Acids Research
(ISSN
0305-1048) made available here with kind permission of:
© 2004 Oxford Journals. All rights reserved.
All articles available through Birkbeck ePrints are protected by intellectual
property law, including copyright law. Any use made of the contents should
comply with the relevant law.
Citation for this version:
dos Reis M., Savva R., and Wernisch L.
Solving the riddle of codon usage preferences: a test for translational
selection
London: Birkbeck ePrints.
Available at:
http://eprints.bbk.ac.uk/972
Citation for publisher’s version:
dos Reis M., Savva R. and Wernisch L.
Solving the riddle of codon usage preferences: a test for translational
selection
Nucleic Acids Research
(2004)
32 (17)
: 5036-5044
http://eprints.bbk.ac.uk
Contact Birkbeck ePrints at [email protected]
Solving the riddle of codon usage preferences:
a test for translational selection
Mario dos Reis*, Renos Savva and Lorenz Wernisch
School of Crystallography, Birkbeck College, University of London, Malet Street, London WC1E 7HX, UK
Received June 2, 2004; Revised and Accepted August 31, 2004
ABSTRACT
Translational selection is responsible for the unequal usage of synonymous codons in protein coding genes in a wide variety of organisms. It is one of the most subtle and pervasive forces of molecular evolu-tion, yet, establishing the underlying causes for its idiosyncratic behaviour across living kingdoms has proven elusive to researchers over the past 20 years. In this study, a statistical model for measuring trans-lational selection in any given genome is developed, and the test is applied to 126 fully sequenced gen-omes, ranging from archaea to eukaryotes. It is shown that tRNA gene redundancy and genome size are interacting forces that ultimately determine the action of translational selection, and that an opti-mal genome size exists for which this kind of selection is maximal. Accordingly, genome size also presents upper and lower boundaries beyond which selection on codon usage is not possible. We propose a model where the coevolution of genome size and tRNA genes explains the observed patterns in translational selection in all living organisms. This model finally unifies our understanding of codon usage across prokaryotes and eukaryotes. Helicobacter pylori, Saccharomyces cerevisiae and Homo sapiens are codon usage paradigms that can be better under-stood under the proposed model.
INTRODUCTION
The controversialideasofKimura(1) and of King and Jukes (2) on neutral evolution led some early detractors to postulate that usage of synonymous codons in protein coding genes is not necessarily random and that codon composition could be biased towards codons that would match the tRNA pool of the host organism (3). This prediction was partially confirmed when the first genes were sequenced, in particular for the ribosomal genes ofEscherichia coli(4). Soon after, Granthamet al. (5,6) com-piled codon usage tables for all sequenced genes at that time, and proposed that each genome has a particular codon usage signa-ture that reflects particular evolutionary forces acting within that genome. This genome hypothesis was soon adopted, and exten-sive studies were performed in yeast and other microorganisms (7,8) that confirmed this view. However, it was not until Ikemura
(9,10) performed his elegant experiments on E.colithat the hypothesis of codon adaptation to the tRNA pool was confirmed, giving a plausible explanation for the presence of codon usage bias in highly expressed genes and leading to rapid development in this area of research. These early discoveries led to the formu-lation of a yeast–E.coliparadigm, establishing that highly exp-ressed genes use a subset of optimal codons in accordance with their respective major isoacceptor tRNA levels. The evolution-ary force responsible for this was coinedtranslational selection. However, when attempts were made to extend the findings from unicellular microorganisms to higher eukaryotes, the situation became confusing. Organisms such as humans seem to have their codon usage determined solely by genomic GC content or isochore composition, while others such as the fly or worm, seem to present an intermediate degree of selection partly determining their codon usage. A mutation– selection balance theory of synonymous codon usage was developed to explain these observations (11,12,13).
Although there have been detailed studies on particular organisms and attempts to find trends in larger groups (14,15,16,17), those studies have failed to explain the reasons for the disparity in the action of selection on codon usage across different genomes, giving rise to the notion that the study of codon usage is one of the most controversial areas of molecular evolution (18). After all, why do certain organisms
such as Helicobacter pylori or humans (19,20) present no
evidence of translational selection while others such as
E.colior worms show a marked codon bias due to selection (21,10)? The problem is aggravated since there seems to be no formal measure available for estimating translational selection on a whole genome basis. Such a measure would help in the investigation of the factors shaping translational selection and the trends underlying its idiosyncratic behaviour across living kingdoms could be better understood. The 20-year-old puzzle of the high diversity in codon usage across genomes might then be settled. In this paper, a statistical test for translational selection is developed and applied to a large subset of fully sequenced genomes. As a result, a unified framework is pre-sented for the understanding of translational selection and codon usage trends in prokaryotic and eukaryotic genomes.
MATERIALS AND METHODS
The tRNA adaptation index
The tRNA adaptation index (tAI) (22) is a measure of the tRNA usage by coding sequences inspired by the codon adaptation
*To whom correspondence should be addressed. Tel:+44 20 7631 6869; Fax:+44 20 7631 6803; Email: [email protected]
Nucleic Acids Research, Vol. 32 No. 17ªOxford University Press 2004; all rights reserved
5036–5044 Nucleic Acids Research, 2004, Vol. 32, No. 17 doi:10.1093/nar/gkh834
Published online September 24, 2004
at Birkbeck College on July 20, 2010
http://nar.oxfordjournals.org
index of Sharp and Li (23). In order to develop this index, we take advantage of the fact that the tRNA gene copy number across some genomes has a high and positive correlation with tRNA abundance within the cell (9,24,14,25) and with codon preferences in such genomes. Since tRNA abundance may be thought of as the driving force for translational selec-tion, it is reasonable to speculate that measuring the tRNA usage of a gene may provide an indirect way for detecting translational selection according to how well the gene in ques-tion is adapted to the tRNA gene pool. In order to calculate this index, the absolute adaptiveness valueWifor each codoniis
defined as
Wi=
Xni
j=1
1 sij
tGCNij, 1
whereniis the number of tRNA isoacceptors that recognize the
ith codon, tGCNijis the gene copy number of thejth tRNA that
recognizes theith codon, andsijis a selective constraint on the
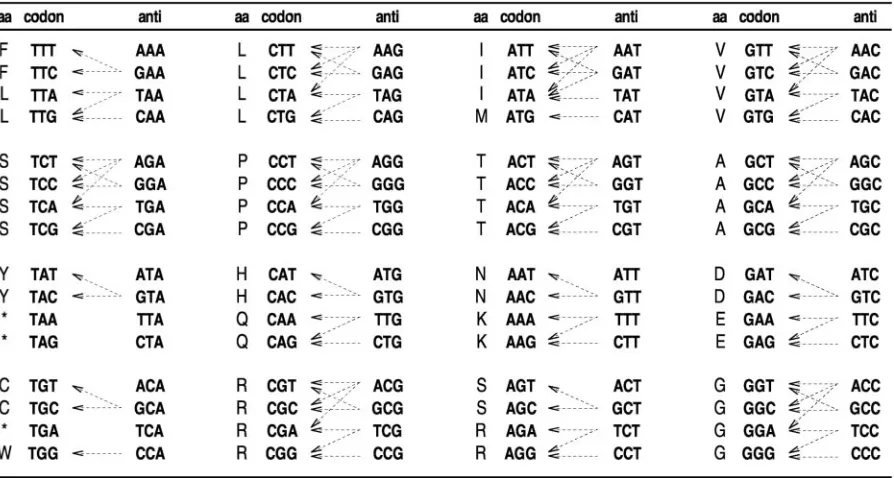
efficiency of the codon–anticodon coupling. To build a table of
Wivalues, it is best to sort the codons as shown in Figure 1 and
to analyse the way in which each tRNA recognizes its parti-cular codons. It can be seen that the 64 codons that comprise the genetic code can be clustered into groups of four elements, which reflect the natural way in which tRNAs recognize them. Based on Figure 1, a simple set of formulae for calculating all
Wi values can easily be drawn taking into account Crick’s
wobble rules (26) for codon–anticodon pairing (Table 1). From the Wi values the relative adaptiveness value wi of a
codon is obtained as
wi =
Wi=Wmax if Wi„0
wmean else
, 2
where Wmax is the maximum Wi value and wmean is the
geometric mean of allwiwithWi„ 0. ThetRNA adaptation
indextAIgof a genegis defined as the geometric mean of the
relative adaptiveness values of its codons
tAIg =
Ylg
k=1
wikg
!1=lg
, 3
whereikgis the codon defined by thekth triplet in genegandlg
is the length of the gene in codons (except the stop codon). Consequently, tAIg estimates the amount of adaptation of a
gene gto its genomic tRNA pool.
The relationship of tAI to Nc
[image:4.612.93.540.79.318.2]The effective number of codons (Nc) is a measure that quan-tifies the departure of a gene from the random usage of synonymous codons (27). Nc is related to the amount of entropy in the codon usage of a sequence. It reaches is maximal value (61) when all codons are used equally and its minimal value (20) when only one codon is used per amino acid. Since the effect of selection is a reduction of
Figure 1.Genetic code and general codon–anticodon recognition rules for tRNA genes. This table simply summarizes all the theoretically possible interactions between the coding codons and the extant tRNA sequences in the organisms analysed in this work. The interested reader is advised to refer to the literature (47,46) for a detailed description of codon–anticodon pairings.
Table 1.Formulas for calculatingWs according to Crick’s wobble rules (26) n Anticodon Codon W
i INN NNU (1 sI:U)tGCNi+(1 sG:U)tGCNi+1 i+1 GNN NNC (1 sG:C)tGCNi+1+(1 sI:C)tGCNi i+2 UNN NNA (1 sU:A)tGCNi+2+(1 sI:A)tGCNi i+3 CNN NNG (1 sC:G)tGCNi+3+(1 sU:G)tGCNi+2
I, inosine. The interested reader should refer to the literature (46,47) for a detailed description of nucleoside modifications and codon–anticodon pairings.
Nucleic Acids Research, 2004, Vol. 32, No. 17 5037
at Birkbeck College on July 20, 2010
http://nar.oxfordjournals.org
[image:4.612.322.572.396.457.2]the entropy of codon usage in a sequence, Nc provides a reliable way of testing this effect. Since the silent GC content
xg of a geneg affects its Nc value, an equation to
approx-imate this relationship under the hypothesis of no selection was proposed by Wright (27):
Ncg =f xg , 4
where
f xg =2+ xg +
29
x2
g + 1 xg
2: 5
This model can easily be extended to account for the selec-tion effectjgon the codon usage of genegand for
uncontrol-lable, random factorseg
Ncg =f xg jg + eg, 6
since the effect of selection is to reduce the value of Nc, it has been assigned a negative value in Equation 6. The random elementegsimply represents sources of variation on Nc that
cannot be accounted for by selection or silent GC content alone, and that cannot be controlled in this study. Since in practical terms we can only calculate Ncgandf(xg) for every
gene, terms jg and eg in Equation 6 are confounded, and
cannot be estimated independently. Consequently, the amount of selection acting on the codon usage of gene g cannot be estimated directly, but the confounded factor,yg= jg egcan
be estimated as
yg =f xg Ncg: 7
We can use tAIg and yg to estimate the degree of
co-adaptation between the codon usage of a set of genes and the genomic tRNA pool. If a sample of genes from a given genome
Gis obtained, then the vectors tAIG=(tAIg) andCG=(yg)
can be calculated. The correlation S between tAIG and CG
measures this co-adaptation. In fact, the squared correlation coefficient S2is the proportion of the variance in codon bias explained by tRNA adaptation that cannot be explained by GC content variation (xg) or other factors (eg) alone. The
correla-tionSis a convenient indicator of the amount of selection due to tRNA adaptation since it is a single number between 1 and 1. It can be seen that the stronger the action of selection, the higher the correlation coefficient. If this test is applied to a representative set of genes in any given organism, a measure of the intensity of translational selection that has acted upon the evolution of its genome will be obtained.
The statistical significance of S can be assessed by a per-mutation test. The method consists in permuting the assign-ment ofwivalues to their respective codons. The permuted set
is then used to calculate tAI andSand the process is repeated iteratively until a sufficiently large sample of S-values is generated to estimate its probability distribution under the assumption of no selection. P-values for the significance
of the naturally observed S-values can be obtained from
this re-sampling distribution.
Non-parametric regression ofS
In order to understand how genome size and tRNA gene copy number contribute to explaining selection on codon usage in
genomes, a non-parametric regression ofSon these variables was performed. A Gaussian processes model (28) was applied to the data since it provides a very flexible and powerful way to analyse data with unusual properties such as highly correlated predictors (such as genome size and tRNA gene number in this case). Gaussian processes are specified by a covariance struc-ture that determines how response values at neighbouring points influence each other. A fully Bayesian treatment of the parameters describing the covariance structure is possible by a Monte Carlo Markov Chain (MCMC) algorithm. Random surfaces are generated according to how well they fit the observed data points, and a consensus regression surface is then obtained by averaging.
Although the smoothness of the surface is essentially derived from the data, it can be influenced by setting a prior on the scale parameter. We intentionally chose a prior that encouraged a smooth appearance of the regression surface. An advantage of the Bayesian approach is that parameters of interest can be given a probabilistic interpreta-tion. For example, we were interested in locating the point of maximum translational selection in the regression surface. A density plot of the most likely location of this point can be easily obtained from the MCMC samples of surfaces by evaluating their maxima.
A logarithmic transformation was used to scale tRNA gene numbers and genome sizes to appropriate values in the regression analysis. Also, a generalized additive model (GAM) (29) was fitted to the data as an independent regression model to confirm the quality of the analysis. Both models agree reasonably well, but the Gaussian model was preferred due to its robustness, so the GAM analysis is not discussed any further.
Genomic sequences
In this work, 126 genomes were analysed for the presence or absence of translational selection. All protein coding
sequences from bacterial genomes and yeast species
(Saccharomyces cerevisiae and Schizosaccharomyces
pombe) were retrieved from NCBI (ftp://ftp.ncbi.nih.gov/
genomes/), sequences from Homo sapiens and Arabidopsis
thaliana were retrieved from RefSeq (http://www.ncbi.nih.
gov/RefSeq/),Mus musculussequences from the Mammalian
Gene Collection (http://mgc.nci.nih.gov), Plasmodium
falciparumsequences from PlasmoDB (http://plasmodb.org),
Neurospora crassa sequences from (http://www.broad.mit.
edu/annotation/fungi/neurospora), Drosophila melanogaster
sequences were obtained from flybase (http://flybase.bio.
indiana.edu/) and Caenorhabditis elegans sequences from
wormbase (http://www.wormbase.org). A detailed list of all organisms studied and their accession numbers is provided as supporting material. Genomic tRNA information was obtained from the Genomic tRNA Database (http://lowelab.ucsc.edu/ GtRNAdb/), and from scanning individual genomes with tRNAscan-SE (30).
Software
Statistical analyses were done using the R software for statis-tical computing (http://www.r-project.org), and the Flexible Bayesian Modeling program suite (R. Neal, http://www.cs. toronto.edu/~radford/fbm.software.html). A modified version
5038 Nucleic Acids Research, 2004, Vol. 32, No. 17
at Birkbeck College on July 20, 2010
http://nar.oxfordjournals.org
of CodonW (J. Penden, unpublished data; http://www.molbiol. ox.ac.uk/cu/) was used to estimate Nc and GC content of the sequences analysed; the modification eliminates the restriction on Nc values bigger than 61. All software developed specific-ally for this work is publicly available (http://people. cryst.bbk.ac.uk/~fdosr01/tAI/).
RESULTS
Choosing appropriates-values for calculating tAI
One of the most challenging issues when computing tAI is the selection of a meaningful set ofsij-values (Equation 1). Since
tRNA usage should be maximal for highly expressed genes, it would be natural to find the set ofsij-values that maximize the
correlation between expression levels and tAI values for any given organism. In this study, microarray data from yeast were obtained (31) and used to optimize these values. A set of highly expressed genes was selected using the criteria chosen previously (32), and tAI was calculated for every one of them, assuming the initialsij-values as shown in Table 2. The
cor-relation between the obtained tAI values for each gene and its corresponding expression level was then calculated iteratively using an implementation of the Nelder and Mead algorithm (R package) until the optimal set ofsij-values that maximized this
correlation (here, Rfinal = 0.71) was obtained (Table 2). A
similar method was used with E.coli microarray data (33)
to obtain an appropriates-value for the recognition of AUA by LAT in prokaryotic genomes (Table 2).
Optimization of Wright’s Nc
A puzzling issue in the study by Wright on Nc (27) is the fact that it is not explained how Equation 5 (f(xg)), was obtained.
Although this formula fits some experimental data, it seems to be biased towards higher Nc values than would be expected. Since an unbiased estimator is needed in Equation 7 to calcu-lateS, its accuracy needs to be reviewed. In order to achieve
this goal, each E.coli K-12 open reading frame (ORF) was
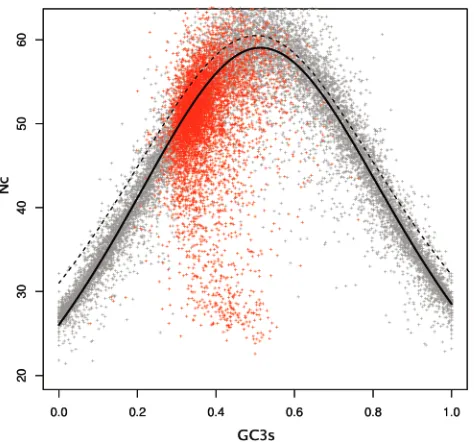
simulated according to the following rules: (i) the amino acid composition should remain intact, (ii) the codon that codes for any given amino acid will be chosen randomly according to a silent set GC content for its gene, (iii) the silent GC content of any given gene will be chosen randomly from a uniform dis-tribution. In order to obtain a sufficiently large dataset, each gene was simulated three times. The result of this simulation is a set of genes whose codon usage is solely determined by their GC content. As can be seen in Figure 2, the equation suggested by Wright has certainly deviated not only from the simulated results but also from real data. The problem was then finding a
better fit for the simulated data utilizing the method of mini-mum squares. For simplicity, it was assumed that the structure of Equation 5 is right but that the constants present in it are inaccurate; based on this, Equation 5 was redefined as
f1 xg = a+xg +
b
x2
g + c xg2
, 8
where a, b and c are constants with unknown values. The
problem was reduced to finding the set of values for these constants that minimize the sum of squares of the residuals for the fitted curve:
Sum of squares =X
n
g=1
f1 xg Ncg
2
, 9
wherenis the total number of simulated sequences. Notice that in this case E[f1(xg) Ncg]=0 as expected, since the effect of
[image:6.612.330.567.387.608.2]selection has effectively been eliminated by the simulation process. The actual minimization of Equation 9 was done using an implementation of the Nelder and Mead algorithm (R software). The obtained parameter values are shown in Table 3. In order to exclude any possible ‘organism’ effect on the estimation ofa,bandc, the simulation experiment and the optimization process were repeated again using human genes (Table 3). We have found that Equation 8 is robust
Table 2.Optimizeds-values
s Fixed s Initial Final
sI:U 0.0 sG:U 0.50 0.41
sG:C 0.0 sI:C 0.50 0.28
sU:A 0.0 sI:A 0.25 0.9999
sC:G 0.0 sU:G 0.50 0.68
— — sL:A 0.50 0.89
L, lysidine.
[image:6.612.53.306.662.733.2]Figure 2.Nc-plot for yeast and simulatedE.coliK12 genes. Grey points, simulated E.coli K12 genes; red points, actual yeast genes; dashed line, Wright’s proposed function (Equation 5); bold line, the function proposed herein (Equation 8) with optimized parameters.
Table 3.Optimized parameters for Equation 8
par E.coliK12 H.sapiens Suggested
a 6.459 6.650 6.0
b 34.01 34.43 34.0
c 1.023 1.028 1.025
Nucleic Acids Research, 2004, Vol. 32, No. 17 5039
at Birkbeck College on July 20, 2010
http://nar.oxfordjournals.org
[image:6.612.321.571.692.745.2]for broad values of a and b, but is very sensitive to small deviations of c.
Distribution of translational selection across prokaryotic and eukaryotic genomes
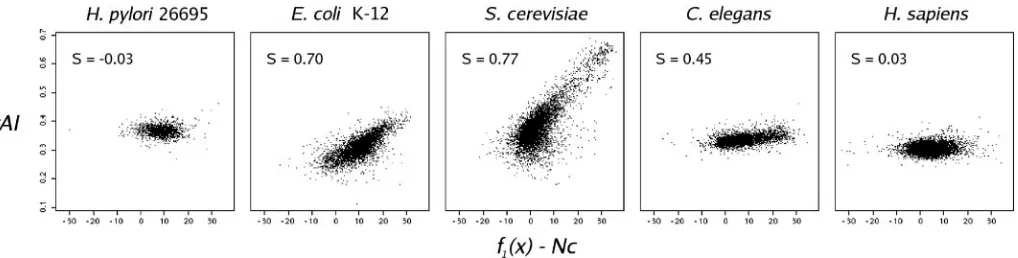
To illustrate how theS-test can be used,S-values were calcul-ated for five organisms in which codon usage has been well studied: H.pylori, E.coli, S.cerevisiae, Caenorhabditis elegans andH.sapiens(19,9,7,21,20). As expected (Figure 3),
S.cerevisiae andE.coli show the highestS-values,C.elegans
shows a moderate S-value, while H.pylori and H.sapiens
show no sign of translational selection acting on their genomes. A total of 126 genomes were tested for translational selec-tion. The organisms analysed ranged in genome size from
0.58 Mb (Mycoplasma genitalium) up to 3000 Mb (H.
sapiens), with total tRNA gene copy numbers ranging from 29 (Mycoplasma pulmonis) to 620 (A.thaliana). We found that the presence or absence of translational selection is indepen-dent of the kingdom being considered; both eukaryotes and prokaryotes presented organisms whose codon usage is deter-mined mainly by selection or mainly by mutational processes.
S-values ranged from 0.28 (Halobacteriumsp.) up to 0.82 (S.pombe). In total, 36 genomes have values ofSstatistically different from zero (P<0.05). A complete table with all the
estimated S-values for each genome and their statistical
significance is available as supporting material.
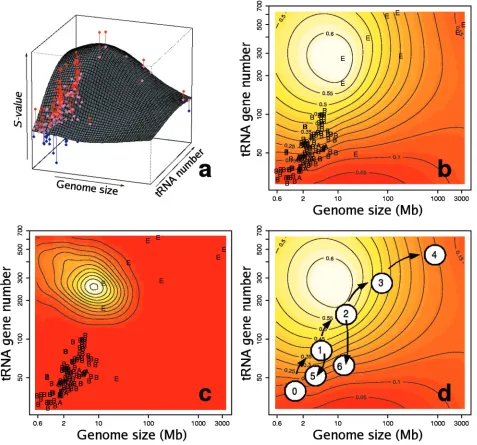
The non-parametric regression of S on genome size and
tRNA gene copy number explains 60% of the variation
observed inS-values. Genome size and tRNA gene copy num-ber interact to form a landscape (Figure 4a) that determines where selection is operative. This landscape can be repre-sented as a thermal image (Figure 4b) that shows the hot regions of selection activity. This landscape shows a conspic-uous hot spot where the activity of selection on silent site evolution is maximal, and cooler, marginal regions of little
selection. Small bacterial genomes (such as H.pylori or
Borrelia burgdorferi) and big eukaryotic genomes (like
those of H.sapiens or M.musculus) fall in these marginal
regions. The yeast genomes fall within the hot spot region. This thermal image is a pan-genomic picture that depicts for the first time where translational selection is operative. It can be used to predict the presence of translational selection in any given genome, provided that genomic size and the number of resident tRNA genes are known. The maximum observed in
the regression surface is highly stable as indicated by the MCMC simulation (Figure 4c).
DISCUSSION
The classic approach to test for natural selection at the mole-cular level has been through alignments of nucleotide sequences and the estimation of the number of synonymous and non-synonymous substitutions that have occurred during the evolution of those sequences. Since codon usage is a par-ticular characteristic of every genome, usually there is not enough polymorphism data available of sequences within genomes to perform this kind of analysis (13), so indirect approaches such as measuring different sorts of codon bias indexes have been the norm in these types of study. Since these indirect approaches do not measure selection itself, most stu-dies embracing larger groups of organisms have focused on the effect of nucleotide composition (such as GC content) on codon usage, and have paid scant attention to the problem of translational selection (16,17).
Presented in this paper is our development of the first con-sistent method to test for translational selection in any given genome, with some very interesting findings. This provides a framework for partially understanding the original observations of Granthamet al. (5) and their genome hypothesis. Further-more, for the first time, the importance of considering the roles of tRNA gene redundancy and genome size in the mutation– selection balance theory of codon usage is emphasized.
Genome size and tRNA gene redundancy are interacting forces that determine the action of natural selection on codon usage bias
Perhaps the most important contribution of this work to the understanding of codon usage is the unexpected finding that genome size and tRNA gene redundancy interact to determine the action of natural selection on codon usage in all living organisms. Our findings suggest that an optimal combination of these factors exists, for which the action of translational selection is maximal. It is now possible to readily predict the presence of translational selection in any given genome given that we know its size and the number of tRNA genes it con-tains. Perhaps Paramecia will provide a good model system to test these predictions. For example,Paramecium aureliahas a
[image:7.612.46.555.77.206.2]genome size of 190 Mb, while P.caudatum has a genome
Figure 3.tAI versusf1(x)–Nc for five organisms for which codon usage has been well studied. 5040 Nucleic Acids Research, 2004, Vol. 32, No. 17
at Birkbeck College on July 20, 2010
http://nar.oxfordjournals.org
size of8900 Mb, so, our model predicts that the former will have a codon usage bias similar to that of fly, i.e. with selection moderately shaping codon usage in highly expressed genes, while the latter should have a codon usage resembling humans, i.e. with no evidence of translational selection.
The lack of tRNA gene redundancy is responsible for the absence of translationally selected codons in small genomes
The adaptation of codon usage to the genomic tRNA gene pool is a well-known phenomenon in various organisms where
[image:8.612.78.555.79.524.2]translational selection is known to be present. In fact, some authors have discussed how the redundancy in the gene num-ber of certain tRNA isoacceptors matches the frequencies of the preferred set of codons in yeast and worm (24,25). How-ever, what does not appear to have been discussed so far, is how the lack of duplicated tRNA genes might explain the absence of translationally selected codons in bacteria with small genomes, although the idea has been framed previously: Kanayaet al. (14) made a detailed analysis of codon usage and tRNA abundance in 18 unicellular microorganisms, calculat-ing aZ-index of codon usage for protein genes in the genomes
Figure 4.Action of natural selection on codon usage in the genomic landscape. (a) Fitted regression surface ofS-values to tRNA gene number and genome size. Pink dots, predictedS-values for every organism; red dots, organisms withS-values higher than predicted by the model; blue, organisms with S-values lower than predicted. Vertical lines join each observed data point to its predicted value. (b) Thermal image (contour plot) of the same regression surface. The hottest (highest)
S-values are shown in white, while the cooler (lowest) values are in red. E, Eukaryota; B, Eubacteria; and A, Archaea. The contour lines reflect the estimatedS-value for a particular region. (c) Estimated probability density function for the presence of a maximum in the regression analysis. (d) Hypothetical evolution of codon usage optimization. A small genome sized ancestor (0), suffered a series of genome expansions (1–4). During this evolutionary process, the phylogeny would move into, and then out of the selective hot-spot. The process can be reverted at any time if selection for genome size or tRNA set reduction is present, such as in non-free living organisms e.g.H.pylori(5) orP.falciparum(6).
Nucleic Acids Research, 2004, Vol. 32, No. 17 5041
at Birkbeck College on July 20, 2010
http://nar.oxfordjournals.org
studied. It was found that the relative bias inZ-values between ribosomal and non-ribosomal proteins was proportional to the total number of tRNA genes in the genome; furthermore, these data suggest that such bias is effectively zero for genomes with low tRNA gene numbers. The conclusion presented was that ‘. . . codon usage in most bacteria, if not all, is constrained by translation efficiency’; however, the aforementioned data appear to suggest the contrary. A vivid example of this is presented in the genome of H.pylori, where the absence of translationally selected codons is well documented (19);
H.pylori presents only 36 tRNA genes with only one tRNA
species presenting two copies, it is this lack of tRNA gene duplication that determines the absence of translational selec-tion in that organism. It can be argued that it is the need for translational optimization and hence codon usage that shapes the tRNA pool of organisms (34). However, we contend that selection favouring small genome size implies an overall reduction of the ‘redundancy’ of the whole genome, i.e. reduc-tion of duplicated genes of any kind (tRNA, rRNA, protein genes, repetitive elements, etc.), and it is this kind of selective force, not codon usage itself, that shapes tRNA redundancy.
Genome size presents upper and lower boundaries beyond which selection on synonymous codon usage is not possible
Since genome size and genomic tRNA number are highly correlated (R=0.85), it seems logical to think that both factors co-evolve in a concerted way. The evolution of genome size has largely been related to the evolution of repetitive DNA (35), so the mechanisms that explain the increase in copy number of selfish genes within genomes might be taken into account to explain the evolution of tRNA genes. In fact, the association between tRNAs and transposable ele-ments is well documented in eukaryotic genomes (36,37), and the evolution of tRNA genes themselves have been described as a repetitive process (38). Since a particular gen-ome size perhaps limits the maximal number of tRNA genes it contains, it is this factor which imposes limits to the action of selection on codon usage. As discussed above, it becomes clear why small genomes lack translationally selected codon usage bias; however, why large genomes also show similar behaviour is puzzling. A possible explanation might be related to the fact that the length of the cell cycle is posi-tively correlated with genome size (39), i.e. the larger the genome, the longer the cell division cycles. After all, E.coli
cells might divide thousands of times in a few hours, while human cells in culture may only divide a few times. Transla-tional optimization for expression of large proteins might be advantageous toE.coli, although of little value to human cells. Another possible explanation might exist if the effective popu-lation size (Ne) of an organism is correlated to its genome size. Whether this should be so is unclear, but it is well known that a substantially large Ne is needed (11) for selection to be effective in shaping codon usage.
The findings presented in this paper permit the following conjecture of how codon usage optimization might have evolved. First a hypothetical ancestor (Figure 4d) with a small genome and a reduced set of tRNA genes suffered a series of genome expansions that led to an increased set of tRNA genes. As successive expansions took place, the
redundancy of the tRNA set increased and selective pressure for codon optimization started to be operative. From this, the first medium genome sized bacterial genomes originated, simi-lar toE.coli. Further expansions might have produced the first eukaryotic genomes such as yeast, where codon optimization is highly developed. As genome size increased further, other ecological variables progressively hindered the action of selec-tion on codon usage, generating the large modern genomes such as those of mammals. Selection for reduction of genome size or tRNA redundancy in certain non-free living organisms would invert the process. This conjectural model might be used as a plausible framework onto which research into codon usage may be devised.
Limitations of the model
The statistical model presented in this study failed to explain
40% of the variation observed inS-values in the genomes studied. The reasons for this are many, and include some of a technical, and others of a biological nature. The technical lim-itations are statistical in their character, and relate to the choice of regression model and the unusual structure of the data. tRNA gene numbers and genome size are highly correlated, so ample areas of ‘genomic landscape’ do not present data points, there-fore, the predictions of the model in the upper left, and lower right corner of Figure 4 are extrapolations that might not necessarily reflect the true behaviour of organisms in these regions. Another unusual characteristic of the data is the excessive oversampling of small genomes, which are easier and cheaper to sequence; this certainly affects the model in the sense that densely packed areas of data contribute more heavily to the shape of the regression surface than areas with more scattered data. The choice of a particular regression analysis is also a problem. Classical para-metric analyses such as polynomial regressions tend to over-fit the data as the degree of the polynomial is increased, and they also tend to produce surfaces that vary wildly in areas where the data is poorly represented. On the other hand, Gaussian pro-cesses are robust against highly correlated predictors, discontin-uous data structures, or biased samples. The final regression surface seen in Figure 4 is an average of all the regression sur-faces that explain the data ’equally’ well, so the wild fluctuations of classical regression surfaces over the areas where the data is poorly represented is averaged out. Furthermore, the inclusion of simulation and Bayesian analysis allows us to test the relia-bility of the regression model, and obtain probarelia-bility values for the features observed in it. If the model predicts a maximum in an area where the data is poorly represented, this maximum will have a very low probability because simulated surfaces in that area will tend to produce random maxima and minima; only regions that consistently produce the same feature are reliable. However, Gaussian processes also present limitations; this is a non-parametric model, and hence we lack a meaningful para-metric equation to describe the data, and using it to predict accurate S-values for new organisms with values outside the range of the current data is not necessarily appropriate.
The model also failed to account for some biological vari-ables. For example, secondary structure effects on codon pre-ferences, or context-dependent mutational biases were not explicitly taken into account, and are grouped together in the error term of Equation 6. Another important variable that was considered in preliminary analysis was the silent
5042 Nucleic Acids Research, 2004, Vol. 32, No. 17
at Birkbeck College on July 20, 2010
http://nar.oxfordjournals.org
GC content; this variable can improve the predictive power of the model to70% but its inclusion does not change the shape of the regression surface (data not shown). GC content and codon usage have been widely discussed in the literature, and it is known that highly biased mutational patterns can restrict codon selection in certain organisms. Some bacteria with extreme values of GC content, present low S-values despite their intermediate genome sizes and tRNA numbers, e.g.
Clostridium tetani(GC=0.29,S=0.03), species of the genus
Streptomyces (GC > 0.70, S < 0.03) or B.burgdorferi
(GC = 0.29, S = 0.11) where asymmetrical replication is
the major source of codon usage variation (40), and where the presence of translational selection has been debated (41). We also ignored the fact that the proportion of tRNA isoac-ceptors can vary as a function of growth rate, tissue type, etc. and it has been suggested that genes accommodate their codon usage according to their particular ‘tRNA environment’(42); in this work, the overall genomic tRNA content was used to calculate tAI and this might not always be appropriate. Also particular taxonomic groups or organisms with similar forms of life may show similar codon trends; e.g. thermophilic bac-teria have been shown to have the same codon preferences despite their large variations in overall GC content (43).
Perhaps the best way to exemplify the limitations of the model is by analysing the case ofBacillus subtilis. This
organ-ism presents an S-value of 0.01, however, it has been
reported that translational selection is operative in its genome (44). Previous analysis on codon usage in this organism (45) showed that its genome can be divided into three gene classes according to their codon composition. Class II, which repre-sents only 4.6% of ORFs, comprises highly expressed genes that show biased codon patterns that can be explained through codon optimization to match the tRNA pool of this organism (14). Classes I (82.3%) and III (13.1%), which comprise the rest of the genome, show codon patterns determined by ame-lioration and mutation-random drift equilibrium; this is in
contrast with the genome of E.coliK-12 where most of the
genome seems to be under translational selection (22). It is evident that the selection effect on class II is hindered by classes I and III in our analysis when we consider the whole genome. Therefore, a smallS-value for a whole genome means that translational selection might be negligible at a genomic scale, but it can nonetheless have a strong effect on smaller scales, such as particular gene sets.
This model unifies our understanding of selection on codon usage in prokaryotic and eukaryotic genomes
The findings presented in this paper coherently unify our understanding of the action of natural selection on codon usage in prokaryotes and eukaryotes. They show that there are indeed conspicuous trends that explain the different roles of selection and mutational biases across all living organisms. It is now possible to trace the enigma of codon usage down to the evolution of tRNA genes and genome size and organiza-tion. We think two lines of research need to be pursued in order to disentangle the codon usage riddle completely.
(i) Explaining the poorly understood evolution of tRNA genes and their role in fitness of an organism: do they propagate within genomes in a selfish manner hence
determining codon usage, or do they indeed co-evolve with codon usage itself (34)?
(ii) Studies of a more ecological nature are needed to under-stand why eukaryotes tend to accumulate larger genomes, and what variables correlated to genome size can explain the lack of translational selection in the larger genomes. Work still needs to be done in this area, but having a test for translational selection will certainly help in tackling these questions.
SUPPLEMENTARY MATERIAL
Supplementary Material is available at NAR Online.
ACKNOWLEDGEMENTS
M.d.R. is currently being supported by a research studentship awarded by the Biosciences and Biotechnology Research Council, UK. Thanks to Dr Sean Eddy who kindly provided the mouse tRNA table.
REFERENCES
1. Kimura,M. (1968) Evolutionary rate at the molecular level.Nature,
217, 624–626.
2. King,J.L. and Jukes,T.H. (1969) Non-Darwinian evolution.Science,
164, 788–798.
3. Clarke,B. (1970) Darwinian evolution of proteins.Science,168, 1009–1011.
4. Post,L.E. and Nomura,M. (1980) DNA sequences from thestroperon of
Escherichia coli.J. Biol. Chem.,255, 4660–4665.
5. Grantham,R., Gautier,C., Guoy,M., Mercier,R. and Pave,A. (1980) Codon catalog usage and the genome hypothesis.Nucleic Acids Res.,
8, r49–r62.
6. Grantham,R., Gautier,C. and Guoy,M. (1980) Codon frequencies in 119 individual genes confirm consistent choices of degenerate bases according to genome type.Nucleic Acids Res.,8, 1893–1912. 7. Bennetzen,J.L. and Hall,B.D. (1982) Codon selection in yeast.J. Biol.
Chem.,257, 3026–3031.
8. Guoy,M. and Gautier,C. (1982) Codon usage in bacteria: correlation with gene expressivity.Nucleic Acids Res.,10, 7055–7074.
9. Ikemura,T. (1981) Correlation between the abundance ofEscherichia colitransfer RNAs and the occurrence of the respective codons in its protein genes.J. Mol. Biol.,146, 1–21.
10. Ikemura,T. (1981) Correlation between the abundance ofEscherichia colitransfer RNAs and the occurrence of the respective codons in its protein genes: a proposal for a synonymous codon choice that is optimal for theE. colitranslational system.J. Mol. Biol.,151, 389–409. 11. Bulmer,M. (1991) The selection–mutation–drift theory of synonymous
codon usage bias.Genetics,129, 897–907.
12. Sharp,P.M., Stenico,M., Penden,J.F. and Lloyd,A.T. (1993) Codon usage: mutational bias, translational selection or both?Biochem. Soc. Trans.,21, 835–841.
13. Sharp,P.M., Averof,M., Lloyd,A.T., Matassi,G. and Penden,J.F. (1995) DNA sequence evolution: the sounds of silence.Phil. Trans. Biol. Sci.,349, 241–247.
14. Kanaya,S., Yamada,Y., Kudo,Y. and Ikemura,T. (1999) Studies of codon usage and tRNA genes of 18 unicellular organisms and quantification ofBacillus subtilistRNAs: gene expression level and species-specific diversity of codon usage based on multivariate analysis.Gene,238, 143–155.
15. Kanaya,S., Yamada,Y., Kinouchi,M., Kudo,Y. and Ikemura,T. (2001) Codon usage and tRNA genes in eukaryotes: correlation of codon usage diversity with translational efficiency and with CG-dinucleotide usage as assessed by multivariate analysis.J. Mol. Evol.,53, 290–298. 16. Knight,R.D., Freeland,S.J. and Landweber,L.F. (2001) A simple model
based on mutation and selection explains trends in codon and amino-acid usage and GC composition within and across genomes.
Genome Biol.,2, research0010.1-0010.13.
Nucleic Acids Research, 2004, Vol. 32, No. 17 5043
at Birkbeck College on July 20, 2010
http://nar.oxfordjournals.org
17. Chen,S.L., Lee,W., Hottes,A.K., Shapiro,L. and MacAdams,H.H. (2004) Codon usage between genomes is constrained by genome-wide mutational processes.Proc. Natl Acad. Sci. USA,101, 3480–3485. 18. Brookfield,J.F.Y. (2003) Genome evolution. In Balding,D.J., Bishop,M.
and Cannings,C. (eds),Handbook of Statistical Genetics. Wiley, Chichester, pp. 255–281.
19. Lafay,B., Atherton,J.C. and Sharp,P.M. (2000) Absence of
translationally selected synonymous codon usage bias inHelicobacter pylori.Microbiology,146, 851–860.
20. Urrutia,A.O. and Hurst,L.D. (2001) Codon usage bias covaries with expression breadth and the rate of synonymous evolution in humans, but this is not evidence for selection.Genetics,159, 1191–1199. 21. Stenico,M., Lloyd,A.T. and Sharp,P.M. (1994) Codon usage in
Caenorhabditis elegans: delineation of translational selection and mutational biases.Nucleic Acids Res.,22, 2437–2446.
22. dos Reis,M., Wernisch,L. and Savva,R. (2003) Unexpected correlations between gene expression and codon usage bias from microarray data for the wholeEscherichia coliK-12 genome.
Nucleic Acids Res.,31, 6976–6985.
23. Sharp,P.M. and Li,W.-H. (1986) The codon adaptation index: a measure of directional synonymous codon usage, and its potential applications.Nucleic Acids Res.,15, 1281–1295.
24. Percudani,R., Pavesi,A. and Ottonello,S. (1997) Transfer RNA gene redundancy and translational selection inSaccharomyces cerevisiae.
J. Mol. Biol.,268, 322–330.
25. Duret,L. (2000) tRNA gene number and codon usage in the
C.elegansgenome are co-adapted for optimal translation of highly expressed genes.Trends in Genetics,16, 287–289.
26. Crick,F.H. (1966) Codon–anticodon pairing: the wobble hypothesis.
J. Mol. Biol.,19, 548–555.
27. Wright,F. (1990) The ‘effective number of codons’ used in a gene.
Gene,87, 23–29.
28. Neal,R.M. (1998) Regression and classification using Gaussian process priors. In Bernardo,J.M.et al. (eds),Bayesian Statistics 6. Oxford University Press, Oxford, pp. 475–501.
29. Hastie,T.J. and Tibshirani,R.J. (1990)Generalized Additive Models. Chapman and Hall, London.
30. Lowe,T.M. and Eddy,S.R. (1997) tRNAscan-SE: a program for improved detection of transfer RNA genes in genomic sequence.
Nucleic Acids Res.,25, 955–964.
31. Holstage,F.C.P., Jennings,E.G., Wyrick,J.J., Lee,T.I., Hengartner,C.J., Green,M.R., Golub,T.R., Lander,E.S. and Young,R.A. (1999) Dissecting the regulatory circuitry of a eukaryotic genome.Cell,
95, 717–728.
32. Coghlan,A. and Wolfe,K.H. (2000) Relationship of codon bias to mRNA concentration and protein length inSaccharomyces cerevisiae.
Yeast,16, 1131–1145.
33. Bernstain,J.A., Khodursky,A.B., Lin,P.-H., Lin-Chao,S. and Cohen,S.N. (2002) Global analysis of mRNA decay and abundance inEscherichia coliat single-gene resolution using two-color fluorescent DNA microarrays.Proc. Natl Acad. Sci. USA,99, 9697–9702. 34. Bulmer,M. (1987) Coevolution of codon usage and transfer RNA
abundance.Nature,325, 728–730.
35. Petrov,D.A. (2001) Evolution of genome size: new approaches to a new problem.Trends Genet.,17, 23–28.
36. Lawrence,C.B., MacDonnel,D.P. and Ramsey,W.J. (1985) Analysis of repetitive sequence elements containing tRNA-like sequences.
Nucleic Acids Res.,13, 4239–4252.
37. MGSC (2002) Initial sequencing and comparative analysis of the mouse genome.Nature,420, 520–562.
38. Jukes,T.H. and Holmquist,R. (1972) Evolution of transfer RNA molecules as a repetitive process.Biochem. Biophys. Res. Commun.,
49, 212–126.
39. Cavalier-Smith,T. (1985) Introduction: the evolutionary significance of genome size. In Cavalier-Smith,T. (ed.),The Evolution of Genome Size. Wiley, NY, pp. 1–36.
40. McInerney,J.O. (1998) Replication and transcriptional selection on codon usage inBorrelia burgdorferi.Proc. Natl Acad. Sci. USA,95, 10698–10703.
41. Perrieere,G. and Thioulouse,J. (2002) Use and misuse of correspondence analysis in codon usage studies.Nucleic Acids Res.,30, 4548–4555. 42. Kurland,C.G. (1993) Major codon preferences: theme and variations.
Biochem. Soc. Trans.,21, 841–846.
43. Lynn,D.J., Singer,G.A.C. and Hickey,D.A. (2002) Synonymous codon usage is subject to selection in thermophilic bacteria.Nucleic Acids Res.,30, 4272–4277.
44. Moszer,I., Rocha,E.P.C. and Danchin,A. (1999) Codon usage and lateral gene transfer inBacillus subtilis.Curr. Opin. Microbiol.,2, 524–528. 45. Kunst,F., Ogasawara,N., Moszer,I., Albertini,A.M., Alloni,G.,
Azevedo,V., Bertero,M.G., Bessieeres,P., Bolotin,A. and Borchert,S. (1997) The complete genome sequence of the gram-positive bacteriumBacillus subtilis.Nature,390, 249–256.
46. Watanabe,K. and Osawa,S. (1995) tRNA sequences and variation in the genetic code. In So¨ll,D. and RajBhandary,U. (eds),tRNA: Structure, Biosynthesis and Function. AMS Press, Washington, DC, pp. 225–250. 47. Yokoyama,S. and Nishimura,S. (1995) Modified nucleosides and codon
recognition. In So¨ll,D. and RajBhandary,U. (eds),tRNA: Structure, Biosynthesis and Function. AMS Press, Washington, DC, pp. 207–223.
5044 Nucleic Acids Research, 2004, Vol. 32, No. 17
at Birkbeck College on July 20, 2010
http://nar.oxfordjournals.org