LOGS ANALYSIS TO SEARCH FOR ANOMALIES IN THE
FUNCTIONING OF LARGE TECHNOLOGY PLATFORMS
MAXIM DUNAEV1, KONSTANTIN ZAYTSEV1,
1National Research Nuclear University MEPhI, 115409, Russia, Moscow, Kashirskoe Avenue 31
ABSTRACT
Today, with the widespread use of machine learning methods in various fields of human activity, the detection of rare events still remains one the most challenging tasks. This is due to the fact that there is very little information to learn computers to detect deviations from normal operation, although it has to deal with the processing of very large amounts of data that characterize the ongoing processes. This occurs, for example, in high energy physics, when searching for and studying new particles. The similar situation occurs when detecting pre-anomalous situations in the complex high-tech equipment operation. Logs are the only source of information to detect the processes running on such equipment, therefore many IT companies use them to analyze the functioning of their software and hardware technologies. This allows viewing the logs starting from very beginning to the point of failure completion, consistently figuring out the possible causes of the incident. In most companies, this process is not automated, because there is no single established approach to analyze logs of different configurations of stored metric values and different filling intensities. In addition, historical logs are not used to predict the sequence of events that lead to anomalies in the operation of any software technologies. The present article deals with the problem of detecting states and predicting the nearest behavior of large technological platforms by directional analysis of their logs. Usually, logs of large technology platforms represent data sets of very high dimensionality that does not allow modern algorithms in the allowable time limits to draw the necessary conclusions about the behavior of platforms and form sequence of control actions, if necessary. To solve this problem, the article compares the effectiveness of existing algorithms, traditionally used unsupervised learning, because the available data for learning are too small, as well as algorithms working with big data. Pilot implementations of all algorithms involved in solving the problem, performed in Python programming language, have been studied in a single environment. Based on their comparison, the most efficient algorithm was chosen, when recognizing different types of events based on real data. The solution of the chosen algorithm was implemented using Apache Spark framework. Additional investigation has shown that the selected algorithm can work in real time mode.
Keywords: Logs, Technological Platform, Anomaly Detection, Machine Learning, Deep Learning, Apache
Software Foundation, K-Means, Clusterization, Apache Spark, One-Class SVM, Isolation Forest, Elliptic Envelope.
1. INTRODUCTION
Today, the largest companies, using modern IT in various fields, are moving to Open Platforms to reduce the development time of new services, and increase the variety of services offered to customers, as well as to improve the quality of online transaction processing. Large technology platforms are growing rapidly. Such platforms usually use software technologies to work with big data, for example, Open Source products of Apache Software Foundation, such as Kafka, Ignite, Solr, etc. It is not uncommon that processes involving these technologies or java-processes operate incorrectly, non-optimally, or simply break down [1]. This hinders the normal execution of business processes, reducing profits. Therefore, it is necessary to reduce
the number of emergency situations, that is, if possible, to predict their imminent occurrence and try to prevent their impact by proper measures. To solve this problem, the only source of information with a certain time tick, detecting the state of technology and devices, are logs. Therefore, it is this information that can be processed by various methods of machine learning to detect anomalous situations leading to accidents. In addition, realizing that it is almost impossible for a person to work with big data, it is also necessary to form and offer operators control actions that do not allow the occurrence of anomalies.
closer human attention [2], protect medical equipment [3], predict anomalous behavior of drones [4], and analyze network traffic [5]. So-called cyber attacks are increasingly appearing in the news. Some of them try to flood the computer with network traffic in order to displace legitimate traffic. In other cases, attackers try to exploit flaws in the network software to gain unauthorized access to the computer. While the bombardment of a computer by traffic is clearly visible and obvious, the discovery of an exploit can be similar to detecting a needle in a haystack of network requests. Nevertheless, the behavior of some exploits corresponds to certain known patterns. For example, accessing one after the other to all the computer ports is something that no normal program needs. However, this is a typical first action of an attacker program, which looks for services running on the computer with possible software flaws. If counting the number of ports that the remote computer has accessed in a short period of time, one can get a defining sign of the exploit. In addition to the described case, a similar phenomenon occurs in wireless networks [6].
2 MATERIALS AND METHODS
2.1 Problem statement
Faced with the problem of poor handling of technology platforms, and in particular, the presence of errors in information technologies, used
on the platforms of large companies to capture information that can clarify the causes of errors, it was decided to log all possible computer operations. For this reason, metric values were recorded in logs every two seconds, as is customary for Apache Solr, Apache Kafka, and java-processes technologies. Typically, during a day, each such log transforms into a table that has about 15,000 columns (metrics) and 6,000 lines (recorded metrics). Figure 1 presents a small fragment of the log created based on Kafka technology with several topics on a number of metrics.
Figure 1. An example of the Apache Kafka technology logs.
A log file includes multidirectional metrics, characterizing both the operation of a particular technology and the overall state of the system (CPU, Heap Memory, etc.), as well as Uptime metric, which indicates whether a certain technology is active or not. This metric counts technology uptime, and therefore is constantly growing, except when the technology is not responding. In this case, the metric is set to zero. By the zero value of the Uptime metric, one can see that the server started to work incorrectly for a certain number of timing periods (log records) before zeroing. Thus, from logs, one can get information about the so-called pre-emergency or anomalous values of metrics. The metrics readings
are available in real-time mode. The task we are interested in is to identify anomalous entries (lines) of metric readings based on the log readings taken in real-time mode. If a certain entry is questionable, then one should select individual metrics, which demonstrate anomaly. Next, one must either report this to the administrator or give recommendations to eliminate the anomaly.
examples of anomalies are an extremely rare event, i.e., they are either not at all, or very little. Thus, every time one needs to fix the similarity of the controlled object’s state with the set of states of its usual behavior.
In the simplest case, formalizing the problem under consideration, one can set it as a problem of one-class classification. Let there be a selection of any objects, whose attribute vectors are S = {x1, x2, x3 …..}, xi∈ Xn. Let there be a function f: x → {-1, 1}, which shows whether the behavior is anomalous (-1) or normal (1). Accordingly, the anomaly of the object will be determined by the value of the function f.
In general, the anomaly will be determined as the distance to the nearest cluster, that is, one should solve the clustering problem.
Given:
X = Rn – the space of objects; Y = {1,…,M} – set of clusters, M is fixed;
Xl =
𝑥
– object retrieval;ρ : X × X → [0;∞) –distance function between objects.
It is necessary to build a clustering algorithm a: X → Y:
- each cluster consists of close objects; - objects of different clusters are very different.
2.2 Review of problem-solving algorithms
Consider the basic algorithms that are commonly used in solving this type of problem. Learning methods without an instructor is handy in these situations because they are able to “learn” how normal data should look like, and consequently, to detect how similar are new data to the preceding data, attributed to normal. Such new data will not necessarily be attacks or fraud, they are just unusual and therefore deserve further analysis.
Statistical algorithms
These algorithms are usually used to process individual attributes in order to obtain their extreme values, for example, Z-value [7]:
𝑧
𝑥
𝑋
𝑆
,
𝑋
is the average value;𝑆
is standard deviation calculated for a set of data.Any practitioner has a certain proven way of detecting extreme values for certain types of data. Many visualization techniques, such as box-and-whisker, have built-in tools to detect and demonstrate such extreme values.
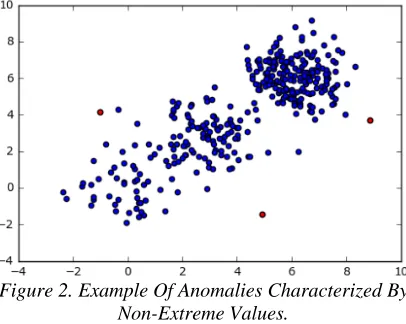
[image:3.612.316.519.212.374.2]It is important to understand that extremal value and anomaly are different concepts. For example, in a small sample [1, 39, 2, 1, 101, 2, 1, 100, 1, 3, 101, 1, 3, 100, 101, 100, 100] the value 39 can be considered an anomaly, although it is neither maximum nor minimum. It is also worth noting that the anomaly is characterized, as a rule, not only by extreme meanings of individual attributes (see Figure 2, where anomalous objects are marked in red).
Figure 2. Example Of Anomalies Characterized By Non-Extreme Values.
Machine learning algorithms
In Machine Learning (ML), there is a whole section, which is aimed at detecting anomalies [8]. In this section, the most popular algorithms are: one class support vector machine (One-Class
SVM);
isolation forest;
ellipsoidal approximation of the data (Elliptic Envelope).
Figure 3 shows the operation examples of different algorithms in this ML section for different data types. Four types of data are shown horizontally, while types of algorithms are shown vertically. The figure shows that different methods, processing the same data, form different configurations of classes.
Figure 3. Examples Of Machine Learning Algorithms To Detect Anomalies [9]
Interestingly, over many years, the challenges of detecting failures of complex mechanisms were solved by means of One-Class SVM, for some reason, without consideration of alternatives [10]. It is important that One-Class SVM is rather an algorithm for detecting novelty, rather than anomalous emissions as it focuses on the learning sample. This property of the algorithm for solving the current problem is not very suitable since any new behavior of the technology should not be interpreted as anomalous, because it is often associated with the implementation of new operations. For example, in Kafka one started sending messages of a new format, while the weight of messages increased or decreased significantly. This is not an anomaly.
The idea of the Isolation Forest algorithm is based on the Monte Carlo principle [11]. A random partition of the attribute space is performed, so that, on average, isolated points are cut off from normally clustered data. The final result is averaged over several stochastic algorithm runs. The Isolation Forest algorithm is to construct a random binary decision tree. The root of the tree is the entire attribute space; a random attribute and a random partition threshold are selected in the next in turn node, sampled from a uniform distribution on the
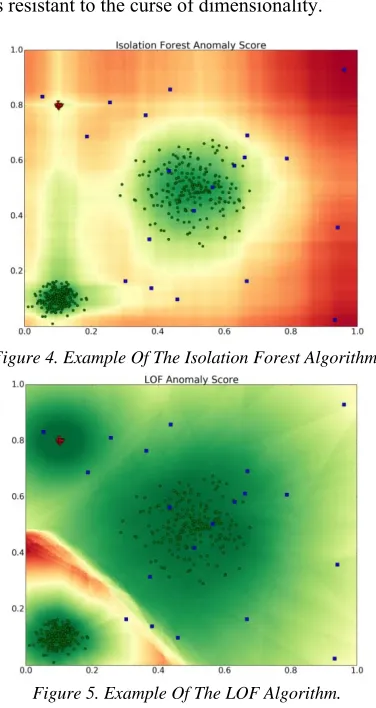
interval from the minimum to the maximum value of the selected attribute. The criterion for stopping the construction of the tree is the identical coincidence of all objects in the node, that is, the decision tree is built completely. A depth of the leaf in the constructed tree is taken as the answer, which also corresponds to the anomaly score algorithm (Figure 4). It is argued that anomalous points tend to appear in leaves with low depth, that is, in leaves close to the root, where the tree will need to build several more levels to divide the hyperplanes of the normal data cluster. At that, the number of such levels is proportional to the size of the cluster, and hence, it is proportional to the anomaly score for the points lying within it. This means that objects from small clusters, which are potentially anomalies, will have an anomaly score lower than those from normal data clusters.
This algorithm has a number of significant advantages, since it:
• recognizes anomalies of various types, both isolated points with low local density and clusters of small size anomalies;
• does not require significant memory, unlike, for example, metric methods, which require the construction of a pairwise distances matrix; • does not need parameters that require heuristic selection;
• is invariant to attribute scaling; does not require a metric or other a priori information about the data structure;
• is resistant to the curse of dimensionality.
[image:5.612.101.289.189.543.2]Figure 4. Example Of The Isolation Forest Algorithm.
Figure 5. Example Of The LOF Algorithm.
Already from the name of the Elliptic Envelope data algorithm, which is last in this section, it is clear that the points cloud is modeled by the algorithm as the interior of some ellipsoid. The method works well only for single-mode data, and very well – for normally distributed single-mode data. The degree of novelty here is actually determined by Mahalanobis distance. It is difficult to guess at the moment whether this will positively or negatively affect the solution of the concerned problem.
K-means Clustering
The problem of anomaly detection can be interpreted as a clustering problem. Let there be n
clusters of normal behavior and one cluster of anomalous behavior. How to define such a cluster will be considered later. At the first stage, a model on historical behavioral data is built, which will be evaluated based on the experts’ assumptions. At the second stage, the distances within the clusters for new data appearing online in the log will be measured, determining their anomalies, and periodically updating the model. To implement this approach, let consider two algorithms: K-means Standard for building a model on historical data, and K-means Online for operating in the model recognition mode.
K-means Standard (or K-means) is one of the machine learning algorithms that solve the clustering problem. This algorithm is non-hierarchical [12] and iterative [13]. It has gained great popularity due to its simplicity, clarity of implementation, and high quality of the results being obtained.
The main idea of the algorithm is that at the next i-th step of the iterative procedure, the center of mass of each cluster obtained at the previous i+1 step is recalculated, then the vectors are divided into clusters again depending on which of the new centers appeared to be closer to them by the selected metrics.
The algorithm is completed when there is no change in the intra-cluster distance at the next iteration. The number of such iterations is finite, since the number of possible partitions of a finite set is finite, and the total square deviation (V) decreases at each step. Therefore, there will be no circularity calculations.
For certainty, we give the pseudocode of this algorithm:
1. The initial approximation of the centers
µ , y ∊ Y
2. RepeatingReferring each xi to the nearest center: yi : = arg min p(xi,µy), i=1, …, k;
calculating the new positions of the centers:
µ
≔
∑
y
y f x
∑
y
y
, y ∊ Y, j
1, … , n;
3. Until yi stop changing.There is also a real-time version of K-means that will allow updating the model as the algorithm runs without stopping its execution.
new cluster centers, and then update each cluster using formulas 1 and 2:
𝐶
𝑐 𝑛 α
𝑥 𝑚
𝑛 α
𝑚
, 1
𝑛
𝑛
𝑚 . 2
The algorithm captures well the changes in the values of indicators, which is typical for anomalous situations, so it is expected to show a good result.
Local Outlier Factor (LOF)
A more delicate problem of metric methods is the fact that all underlying assumptions are valid only in comparison with each other: for example, the local density of a point lying in the center of a small cluster of anomalies (Figure 5, highlighted in red), may be higher than that for any point from a large cluster of normal data. The opposite situation is also possible: an isolated anomaly point may be located, for example, in the center of mass of the normal cluster, and then the average distance from it to the neighbors will be less than that for normal points. The LOF algorithm attempts to account for this feature of metric algorithms [14].
Definition 1. Let Dk(y) be the distance from y to k of the nearest neighbor. The value below is called the reachability distance of the point x relative to the point y:
Rk(x, y) = max(ρ(x, y), Dk(y)). (3)
Definition 2. Let ARk(x) be the average reachability distance of point x relative to k of its nearest neighbors, let Nk(x) be the set of k nearest neighbors of x. Then:
LOFk(x) = mean (ARk(x)/ ARk(y)). (4)
The intuition of formula (4) is to compare the average reachability distance of a point and its nearest neighbors. For normal data, it is true not only that the estimate (3) of local density is small, but also that it differs slightly from the same estimate for the nearest neighbors. An example of the algorithm operation is shown in Figure 5.
The efficiency of using this algorithm to solve the problem under consideration is difficult to predict because it is focused on a certain type of data.
Mean Shift
The Mean Shift algorithm groups the objects with similar attributes. Consider an example of the algorithm in the analysis of images. Pixels with similar characteristics are combined into one segment that results in an image with homogeneous areas (Figure 6).
Figure 6. (A) Original Image, (B) Segmented Image [15].
To make it easier to describe the thickening of points, the density function is introduced:
𝑓 𝑥⃗
1
𝑁ℎ
𝐾
𝑥⃗
𝑥⃗
ℎ
where
𝑥⃗
is the attribute vector of the i-th pixel, d is the number of attributes, N is the number of pixels, h is the smoothness parameter, and K(𝑥⃗
) is the kernel. The maxima of the function𝑓 𝑥⃗
are located at the pixel thickening points of the image in the attribute space. Pixels belonging to the samelocal maximum are combined into a single segment. It turns out that in order to find to which concentration centers belongs the pixel, it is necessary to step along the gradient
𝑓 𝑥⃗
to find the nearest local maximum. [image:6.612.162.435.417.574.2]from the attributes, the sky, and the lake will be considered as one segment, since the pixels of these objects in the attribute space would fall into one local maximum.
If the object, which is to be selected, consists of areas that differ greatly in color, then Mean Shift algorithm will not be able to combine these regions into one, and the object will consist of several segments. But, this algorithm will cope well with the uniform color subject on a colorful background. Besides, Mean Shift algorithm is used in the implementation of the tracking algorithm over moving objects [16].
When solving the present problem, this algorithm should be a good option to detect anomalies, since different colors in the image correspond to different behavior of technologies.
Spectral Clustering
The techniques of the Spectral Clustering algorithm use the spectrum (eigenvalues) of the data similarity matrix to reduce the dimensionality before clustering in spaces of smaller dimensions. The similarity matrix is fed to the input of the algorithm and consists of quantitative estimates of the relative similarity of each pair of points of the dataset.
If a numbered set of dataset points is given, the similarity matrix can be defined as a symmetric matrix A, in which elements Aij>= 0 represent a measure of similarity between data points with indices i and j. The general principle of spectral clustering is based on the use of the standard clustering method (there are many such methods, for example, the K-means method) on the significant eigenvectors of the Kirchhoff matrix for matrix A. There are several ways to determine the Kirchhoff matrix, which has different mathematical interpretations; therefore, clustering will have different interpretations as well. Significant eigenvectors are those vectors, which correspond to the smallest eigenvalues of the Kirchhoff matrix, except for the eigenvalues of zero. To ensure computational efficiency, these eigenvectors are often computed as eigenvectors corresponding to some of the largest eigenvalues of the Kirchhoff matrix function.
One technique of spectral clustering is the normalized sections algorithm or the Shi-Malik algorithm [17], widely used for image segmentation. The algorithm splits the points into two sets (B1 and B2) based on the eigenvector v corresponding to the second largest eigenvalue of the symmetrically normalized Kirchhoff matrix, given by the formula:
𝐿
≔ 𝐼
𝐷
/𝐴𝐷
/ ,where D is the diagonal matrix:
𝐷
𝐴
All image segmentation algorithms are expected to show good results, including this algorithm.
3. RESULTS
3.1 Preparing data for experiments
For experiments to study the effectiveness of anomaly detection algorithms, a small sample of real data (real log formed during an hour) was prepared, which included artificial anomalous data obtained by running a command that collapses servers and technologies. Thus, all the events of the testing sample were divided into three classes: emergency (or anomalous), i.e. server crash, and points in time located nearby, pre-anomalous points located farther in time before the server crash, as well as normal points demonstrating the normal functioning of the server.
The real data, from which the sample was taken, are very large. Thus, the data sample taken for one day contains about eight hundred thousand metrics and requires half a Gigabyte of memory. But to build an adequate diagnostic model, one needs to use data at least for a week or two. At that, the real data is very sparse. This is due to the fact that in some point of time t object A exists, its behavior is measured and reflected in the log, while at the point in time t+constant the object has disappeared (for example, is deleted by a destructor or collected by the garbage collector), and thus further measurements of its metrics in the log are no long available.
Therefore, before analyzing the data, they need to be prepared, namely
- to reduce the dimensionality of the metrics strings, removing uninformative indicators, such as, for example, Linux version, the operating system type, etc., as well as metrics that contain string values. As a result of removal, one gets a pool of informative metrics, whose values should be used for the subsequent analysis of the platform technologies behavior;
- given the sparsity of the log table, data gaps need to be replaced with some values. In this paper, they were replaced by the average values for the columns (metrics). The value of the “Infinity” metric indicates that the object could not respond, although it exists. Therefore, such values were replaced by a constant value.
algorithm, did not yield the expected result since they work extremely slowly with such large volumes. But for a test sample, this can be done and was done to illustrate the test results. Using the PCA method, the dimension of the attribute space was reduced to two coordinates, but obviously, at that, a lot of information was lost.
For obtaining an enterprise solution, Apache Spark was used, which has the ability to process In-Memory data that greatly accelerated this process. Taking into account the fact that Spark is gradually developing, currently, there are no specially created algorithms for complex analysis of anomalies in this framework. Therefore, interest in the choice of algorithm implementations to detect an anomaly in large technological platforms using logs within a reliably working framework in the streaming data processing mode (for example, Spark Streaming) is very high, and so far remains unsatisfied [18].
3.2. Choosing an algorithm
The choice of an efficient algorithm to solve the problem of detecting anomalies was carried out using the sklearn machine learning library.
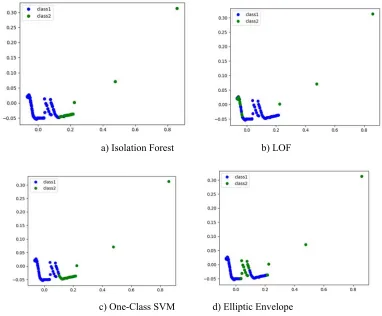
The study of the capabilities of considered algorithms to solve the problem was carried out as follows. At the first stage, algorithms were tested, which, as follows from their descriptions, are specially designed to find anomalies. These are Isolation Forest, One-Class SVM, LOF, and Elliptic Envelope. The results of these tests are shown in Figure 7. It is worth noting that Elliptic Envelope and LOF proved to be worse than other tested algorithms since they have highlighted neither emergency situation, i.e. server crash (the highest point in the upper right corner of the charts), nor pre-accident situation (stand-alone points adjacent to the anomalous points), or anomalous events. Moreover, these algorithms have attributed some absolutely normal events to manifestations of an anomaly.
One-Class SVM and Isolation Forest algorithms have been able to identify not all pre-anomalous points.
a) Isolation Forest b) LOF
[image:8.612.110.492.386.702.2]c) One-Class SVM d) Elliptic Envelope
The results of testing Isolation Forest, One-Class SVM, LOF, and Elliptic Envelope algorithms in solving the problem of detecting anomalous events were unsatisfactory. Therefore, further in the experiment, the algorithm associated with the space segmentation, i.e. Mean Shift, was tested. It has
[image:9.612.99.288.180.318.2]shown quite good results by selecting six clusters: two points before the server crash as well as all the pre-anomalous points were attributed to individual clusters (see Figure 8). Nevertheless, its use when working with real data is highly questionable, as it does not work well with big data.
Figure 8. The Test Result Of The Mean Shift Algorithm.
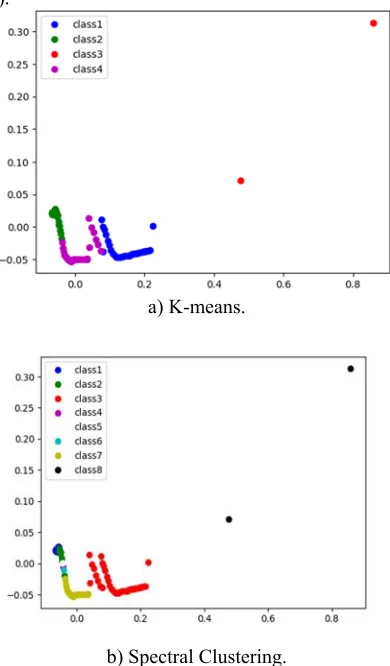
Finally, two clustering algorithms, namely, K-means and Spectral Clustering, were investigated (Figure 9).
a) K-means.
b) Spectral Clustering.
Figure 9. Test Results Of Clustering Algorithms.
Spectral Clustering algorithm allocated two points before the server crash into a certain cluster, while putting a lot of points reflecting normal technology operation into this cluster.
K-means showed a very good result, forming four clusters. It singled out an individual emergency cluster (Figure 9a, the proper points are highlighted in red), placing there a point just before the server crash and the point corresponding to the crash. These points have shown the maximum deviations in metric values. The rest pre-anomalous points were placed in another cluster (marked in blue). In addition, normal points, in which the business logic of the processes was different, were placed exactly in two different normal clusters.
Summarizing up the experimental results, it was revealed that according to the proposed data sample, the most adequate work on the allocation of normal, pre-anomalous, and emergency clusters was demonstrated by the K-means algorithm.
3.3. Using the algorithm
In fact, the solution to the problem of detecting anomalies was reduced to the implementation of two stages:
– construction of a model based on historical data (at the same time there was the possibility of partial learning on zeroing uptime labels)
– prediction of anomalies in the online mode, using the model built at the first stage. The model updating was carried out only using the new data. In the case of anomaly detection, recommendations on its elimination were issued.
At the first stage, a model was built, which was stored in the Hadoop file system. In addition, meta information was recorded there as well, including the metrics collection scheme.
To implement the second stage, Kafka and Spark Streaming were used. At first, the model worked properly, but a few days later it began to treat some normal events as anomalous. To eliminate these deviations, presumably caused by the obsolescence of the model, it has been updated using K-means online model. After a few days of continuous operation on updating the model, it started showing again adequate results, giving recommendations on the metrics, which caused the anomalies.
[image:9.612.96.291.375.708.2]process using specially prepared data (Figure 1) of the size of 10,000 entries on 28 metrics (indicators). The anomaly detection model, built using the K-means algorithm, broke the sample in two clusters with maximum distances within each cluster: 9.077174728424171E9
2.2303365869092103E7
The anomalous class was not detected since the Uptime metric did not take values equal to zero. So, no partial learning was carried out.
Further, for the third and fifth records out of the selected five, in one of the topics, the values of some metrics were manually changed, namely, the value of the BytesInPerSec_count metric (byte rate per second) was increased by an order of magnitude. This simulates a sharp change (jump) in speed. Further, these records were placed in Apache Kafka and processed by the detection program, which gave the following result.
No deviations were recorded for the first two entries:
Class_label = 0
Distance to centre = 2.258763348636588E8
Max distance on class = 9.077174728424171E9
Class_label = 0
Distance to centre = 2.2587529598591527E8
Max distance on class = 9.077174728424171E9
For the next three entries, we see the appearance of Detected Anomaly:
Class_label = 1
Distance to centre = 6.347097105565773E10
Max distance on class = 2.2303365869092103E7
Detected Anomaly
Class_label = 0
Distance to centre = 2.263875787958162E8
Max distance on class = 9.077174728424171E9
Class_label = 1
Distance to centre = 6.347462440779935E10
Max distance on class = 2.2303365869092103E7
Detected Anomaly
The listing of results shows that the third and fifth entries show anomalous situations.
4. 4. DISCUSSION
Anomaly detection in the functioning of complex technological objects is largely based on traditional methods of data mining and machine learning [19]. Although in recent years, the attention of researchers is increasingly attracted by new methods, mainly using deep neural networks [20]. This topic is considered, for example, in the article [21], where the type of neural networks called autoencoder was proposed as a new approach. The autoencoder was applied to detect anomalies of the supercomputer providing correct predictions within the interval from 88 to 96%. The authors [22] used fully convolutional neural networks for anomaly detection in scenes involving a lot of people. The experimental result of such networks for two tests showed that the proposed method exceeds the existing methods in terms of detection and localization accuracy.
Generative adversarial networks (GAN) [23] are capable of simulating complex multidimensional distributions of real data, suggesting that they may be effective for anomaly detection. However, several studies have investigated the use of GAN for anomaly detection. The authors used newly developed GAN models to detect anomalies and achieved the most up-to-date performance metrics for image and network intrusion datasets while being several hundred times faster during testing than the only published GAN-based method. In concerned case, all methods based on deep learning are not possible due to the fact that one has to deal with data of huge size, and there is no possibility to configure such networks, due to the absence of the instructor. Our experiments with auto-encoders have not yet yielded positive results.
There are also ready-made frameworks, such as WEKA [24], and ADF [25], which detect environmental anomalies. In [26, 27] the frameworks created by the authors to search for network anomalies are described. To detect anomalies in cloud computing, which host applications and data, a framework based on Markov chains and multivariate time series analysis was proposed in [28]. And this is just a small number of ready-made solutions, while there are many others [29-31]. This is not by chance, because the topic under consideration is very relevant today. But, despite this, for the concerned case, unfortunately, none of the above-described frameworks is unsuitable, since they are not able to process either the data of such a structure or of such size.
It is also worth saying that it would be good to find an application of interesting clustering algorithms, such as Mean Shift in the problem of detecting anomalies when working with big data, although they are not suitable in their current form.
5. CONCLUSIONS
This work deals with the problem of detecting anomalies in the functioning of large technology platforms based on the analysis of logs using machine learning methods. To do this, realizing that one will have to work with big data, the most common groups of algorithms used to solve such problems were first investigated. Among them:
- algorithms specially created to detect anomalies, such as Isolation Forest, One-Class SVM, LOF, and Elliptic Envelope;
- the algorithm associated with the space segmentation, i.e., Mean Shift;
- clustering algorithms, namely, K-means and Spectral Clustering.
To study the effectiveness of the algorithms detecting anomalies, a small sample of real data (real log formed during an hour) was prepared, which included artificial anomalous data obtained by running a command that collapses servers and technologies. After that, all the events (points in attribute space) of the testing sample, characterizing the platform operation, were divided into three classes: emergency (or anomalous), pre-anomalous, and normal points, which were searched by the tested algorithms.
In consequence of the experiments conducted using the prepared sample of real data, Elliptic Envelope and LOF algorithms were unable to determine neither an emergency nor anomalous events. Moreover, they attributed some absolutely normal events to the anomalous manifestations. One-Class SVM and Isolation Forest algorithms were able to identify not all pre-anomalous points. Therefore, the authors consider the operation of all these algorithms unsatisfactory, and these algorithms are not suitable for solving the problem of detecting anomalies when processing large amounts of data.
Mean Shift algorithm was able to allocate both two points before the server crash into individual clusters, as well as all pre-anomalous points, while its use in its current form is extremely difficult because it is too slow to work with big data.
Spectral Clustering algorithm has allocated two points before the server crash into a certain cluster, while attributing a lot of points, reflecting normal technology operation, to the same cluster.
K-means has shown the most appropriate result by detecting the clusters of anomalous (emergency), pre-anomalous, and normal events. Therefore, it is the most suitable for solving the problem of detecting anomalies in logs.
Using the results of this work to detect anomalies when operating large technological platforms will reduce the number of emergencies and avoid situations, in which platform administrators do not know what logs metrics need to be affected to avoid anomalies.
ACKNOWLEDGMENTS
This work was supported by the Competitiveness Program of National Research Nuclear University MEPhI (Moscow Engineering Physics Institute), contract with the Ministry of Education and Science of the Russian Federation No. 02.А03.21.0005, 27.08.2013.
REFERENCES
[1] Sberbank Today. New Technology Platform (2017) https://2017.report-
sberbank.ru/ru/performance-overview/technology/technological-platform (Retrieved: 21.03.2019).
[2] Bailis, P., Gan, E., Madden, S., Narayanan, D. Rong, K. and Suri S. (2017) MacroBase: Prioritizing Attention in Fast Data. In ACM International Conference on Management of Data (SIGMOD), pp. 541–556
[3] Jha, N. K., Raghunathan, A. and Zhang M. (2013) MedMon: Securing Medical Devices Through Wireless Monitoring and Anomaly Detection. IEEE Trans Biomed Circuits Syst., vol. 7(6), pp. 871-81.
[4] Lu, H., Li, Y., Mu, S.,Wang, D., Kim, H. and Serikawa, S. (2018) Motor Anomaly Detection for Unmanned Aerial Vehicles Using Reinforcement Learning. IEEE internet of things journal, vol. 5 (4), pp. 2315-2322. [5] Radford, B. J., Apolonio, L. M. and Trias, A. J.
(2018) Simpson Network Traffic Anomaly Detection Using Recurrent Neural Networks – Cornell University: arXiv.org >cs> arXiv: 1803.10769.
[7] Statistics How To https://www.statisticshowto.datasciencecentra l.com/probability-and-statistics/chi-square/ (Retrieved: 21.03.2019).
[8] Anomaly detection. Wikipedia
https://en.wikipedia.org/wiki/Anomaly_detect ion (Retrieved: 21.03.2019).
[9] Novelty and Outlier Detection. Sikit-learn v0.20.3 https://scikit-learn.org/stable/modules/outlier_detection.ht ml (Retrieved: 21.03.2019).
[10] Perdisci, R., Gu, G. and Lee, W. (2006) Using an Ensemble of One-Class SVM Classifiers to Harden Payload-based Anomaly Detection Systems. ICDM '06 Proceedings of the Sixth International Conference on Data Mining, pp. 488-498.
[11] Liu, F. T., Ting, K. M. and Zhou, Z. H. (2008) Isolation Forest. Data Mining, 2008. ICDM’08. Eighth IEEE International Conference on Data Mining. IEEE, 2008, pp. 413-422.
[12] What is Hierarchical Clustering? DISPLAYR
https://www.displayr.com/what-is-hierarchical-clustering/ (Retrieved: 21.03.2019).
[13] What is Cluster Analysis?
http://www.stat.columbia.edu/~madigan/W20 25/notes/clustering.pdf (Retrieved: 21.03.2019).
[14] Breunig, M.M., Kriegel, H.P., Ng, R.T. and Sander, J. (2000) LOF: Identifying Density-based Local Outliers. ACM Sigmod Record, vol. 29, no. 2, pp. 93-104.
[15] Comaniciu, D. and Meer, P. (2002) Mean Shift: A Robust Approach Toward Feature Space Analysis. IEEE Transactions on Pattern Analysis and Machine Intelligence, vol. 24, pp. 603–619.
[16] Comaniciu, D., Ramesh, V. and Meer, P. (2000) Real-Time Tracking of Non-Rigid Objects Using Mean Shift. Conference on CVPR, 2000, vol. 2, pp. 1-8.
[17] Meilă, M. and Shi, J. (2001) Learning Segmentation by Random Walk. Neural Information Processing Systems, vol. 13 (NIPS 2000).
[18] Alnafessah A. and Giuliano Casale, G. (2018) Anomaly Detection for Big Data Technologies. Imperial College Computing Student Workshop, no. 8, pp. 8:1–8:1
[19] Chandola, V., Banerjee, A. and Kumar, V. (2009). Anomaly Detection: A Survey. ACM Computing Survey, vol.41(3), pp. 15:1–15:58. [20] Zhang, C., Song, D., Chen, Y., other (2018) A
Deep Neural Network for Unsupervised
Anomaly Detection and Diagnosis in Multivariate Time Series Data. Cornell University: arXiv>cs>arXiv:1811.08055. https://arxiv.org/abs/1811.08055 (Retrieved: 21.03.2019).
[21] Borghesi, A., Bartolini, A., Lombardi, M., other (2018) Anomaly Detection using Autoencoders in High Performance Computing Systems. Cornell University: arXiv>cs>arXiv: 1811.05269. https://arxiv.org/abs/1811.05269 (Retrieved: 21.03.2019).
[22] Sabokrou, M., Fayyaz, M., Fathy, M., other (2018) Deep-anomaly: Fully convolutional neural network for fast anomaly detection in crowded scenes. Computer Vision and Image Understanding, vol. 172, pp. 88-97
[23] Zenati, H., Foo, C. H., Lecouat, B., other (2018) Efficient GAN-Based Anomaly
Detection. Cornell University:
arXiv>cs>arXiv: 1811.05269. https://arxiv.org/abs/1802.06222 (Retrieved: 21.03.2019).
[24] Jabez, A.J., Gowri, S., Vigneshwari, S. and Mayan, J.A. (2018) Detection by Using CFS Subset and Neural Network with WEKA Tools. In book: Information and Communication Technology for Intelligent Systems. London:Springer, pp.675-682. [25] Chen, L.-J., Ho, Y.-H., Hsieh, H. H., other
(2018) ADF: An Anomaly Detection Framework for Large-Scale PM2.5 Sensing Systems. IEEE Internet of Things Journal, vol. 5 issue 2, pp. 559 – 570
[26] Moghaddass, R. and Wang, J. (2017) A Hierarchical Framework for Smart Grid Anomaly Detection Using Large-Scale Smart Meter Data. IEEE Transactions on Smart Grid, vol. 9, issue 6, pp. 5820 – 5830,
[27] Yip, S., Tan, W-N., Tan, C. K., other (2018) An anomaly detection framework for identifying energy theft and defective meters in smart grids. International Journal of Electrical Power & Energy Systems, vol. 101, pp. 189-203,
[28] Sha, W., Zhu, Y., Chen, M. and Huang, T. (2015) Statistical Learning for Anomaly Detection in Cloud Server Systems: A Multi-Order Markov Chain Framework. IEEE Transactions on Cloud Computing, vol. 6, issue 2, 2018, pp. 401 – 413
[29] Dynamic graph anomaly detection framework and scalable system architecture – Google Partners
[30] Basak, A., Das, K. and Mengshoel, O. J. (2018) CADDeLaG: Framework for distributed anomaly detection in large dense graph sequences. arXiv>cs>arXiv: 1802.05421 https://arxiv.org/abs/1802.05421 (Retrieved: 22.03.2019).
![Figure 3. Examples Of Machine Learning Algorithms To Detect Anomalies [9]](https://thumb-us.123doks.com/thumbv2/123dok_us/8899353.954297/4.612.90.529.64.395/figure-examples-machine-learning-algorithms-detect-anomalies.webp)
![Figure 6. (A) Original Image, (B) Segmented Image [15].](https://thumb-us.123doks.com/thumbv2/123dok_us/8899353.954297/6.612.162.435.417.574/figure-original-image-b-segmented-image.webp)