7264
DEVELOPMENT OF QCOST MANAGEMENT SYSTEM FOR
MEASURING COSQ (COST OF SERVICE QUALITY)
1SANG-CHUL LEE, 2KWANG HYUK IM
1Department of Big Data Management, Korea Christian University, Seoul, Korea
2Department of Electronic Commerce, PaiChai University, Daejeon, Korea
E-mail: 1[email protected], 2[email protected]
ABSTRACT
The purpose of this research is to develop Qcost management system (QMS) and to propose a methodology for measuring the cost of service quality. Firstly, an appropriate framework is proposed for capturing quality costs and detailed analysis is carried out to characterize quality cost in a service company. This research demonstrates the calculation of quality cost based on process classification framework and 6 sigma methodologies. Secondly, QMS is developed through the process of the systems development methodologies, such as requirement analysis, system analysis & design, implementation and test. To test the QCMS, this research analyzed the Qcost in a service company. With this system, companies can control and manage their cost of poor process performance and finds some managerial insights which can help improve the efficiency within the corporation.
Keywords: Management System, Quality Cost, Service Industry, Key Performance Indicator, Process
Classification Framework
1. INTRODUCTION
Quality is a strategic imperative for many successful organizations. Quality is a ‘total concept’ involving everybody and everything within the organization. When overall quality costs are minimized, a quality system’s contribution to profits is effectively maximized [1]. Quality improvement continues to be a major concern for many companies
Measuring the Cost of Quality (COQ) has been the most effective methods for estimating the success of a quality management program since 1960’s [2]. Researches show that COQ reached 30% of total US manufacturing costs [3]. COQ have an effect profitability, operating costs, and consumer needs [4]. Organizations endeavor to increase profitability by reducing the operating costs incurred from poor-quality products, services and processes [5-6]. The purpose of COQ is to change problems of quality into the “language” of upper management. Problems of quality defined as the number of defects have little influence on top managers, who are generally more concerned with financial performance [7].
COQ is a significant cost driver that companies need to control effectively for sustaining competitive advantage [4]. With information of COQ, manager identifies major opportunities for
cost reduction and estimates the relative importance of quality problems [8]. COQ represents the difference between the actual cost of a product or service and what the reduced cost would be if there is no possibility of substandard service, product failure or defects in their manufacture [9]. Total COQ is defined as the difference between the actual cost of a product or service and what the cost could be if the quality was perfect by Chiadamrong [10].
In summary, COQ is a financial measurement that shows crucial information in the language of management. While workers and supervisors typically speak in the language of ‘things’, top management focuses on the processes and procedures that have a financial impact on the business. A report of COQ allows an company to indicate how all departments’ affect COQ. It helps managers exact areas of high quality costs, increases efforts to improve, and facilitates an organized approach to productivity and cost improvements [11]. However, many companies in service industries face with a difficulty of the insufficient of COQ in service area. The reason for this insufficient of COQ is a lack of sufficient methods for quantifying cost in each process of service industries.
7265 methodology for measuring the cost of service quality. This research demonstrates the calculation of quality cost based on Process Classification Frameowrk (PCF) and 6 sigma methodologies. To test the QCMS, this research analyzed the Qcost in a service company.
2. LITERATURE REVIEW
2.1 Cost of Quality Model
Quality costs have been the subject of many articles since they were propounded by Juran in the 1950s [6]. Quality costs are divided into four categories: prevention costs, appraisal costs, and internal failure costs, external failure costs. Generic COQ models consist of these cost categories in Table 1 [12].
Table 1: Generic Model & Cost Categories
Generic model Cost/activity categories
(P-A-F) model Prevention + appraisal + failure
Crosby’s model Conformance + non-conformance
Process cost models Conformance + non-conformance
ABC models value-added + non-value-added
Most COQ models are based on the prevention– appraisal–failure (PAF) approach. The PAF model is the most widely used model for determining COQ [13-14]. The total COQ curve shows the sum of the other two curves (failure cost and prevention + appraisal cost), and the location of the minimum point on the total COQ curve, regarded to as the optimum point which depends on the shapes of the two lower curves [15].
The cost categories of Crosby’s model are similar to the PAF model. Crosby sees quality as “conformance to requirements”, and therefore, defines the cost of quality as the sum of conformance and non-conformance costs [16].
The process cost model developed by Ross [17] and first used for quality costing by Marsh [18] represents quality cost systems that focus on process rather than products or services. Process cost is the total cost of conformance and non-conformance for a particular process. The cost of conformance is the actual process cost of producing products or services first time to the required standards by a given specified process,
whereas cost of nonconformance is the failure cost associated with the process not being executed to the required standard [19].
An activity-based costing (ABC) model was developed by Cooper and Kaplan [20] to solve this problem. Under ABC, accurate costs for various cost objects are achieved by tracing resource costs to their respective activities and the cost of activities to cost objects. The ABC approach is actually not a COQ model. It is an alternative approach that can be used to identify, quantify and allocate quality costs among products, and therefore, helps to manage quality costs more effectively.
2.2 Six Sigma
Six Sigma is a business management strategy, originally developed by Motorola, USA in 1986 [21]. Six Sigma seeks to improve the quality of process outputs by identifying and removing the causes of defects (errors) and minimizing variability in manufacturing and business processes. Six sigma is an activity to reduce the COPQ (Cost of Poor Quality). The term Six Sigma originated from terminology associated with manufacturing, specifically terms associated with statistical modeling of manufacturing processes.
After a six sigma, companies are interested in quality cost. Quality cost is a way to evaluate effectiveness and economics of quality management activities to make good quality product economically. These six sigma activities and quality cost management took place mainly in the manufacturing industry and was low in service industry.
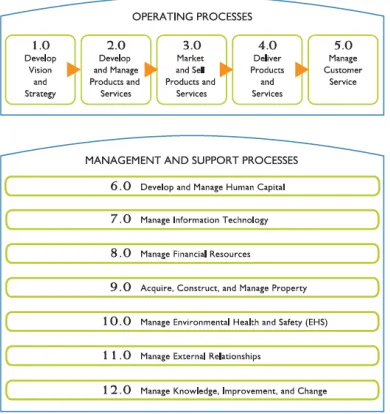
2.3 Process Classification Framework
7266
Figure 1: PCF of Utilities
3. METHOD AND PROCEDURE
3.1 Method
This paper develops the COSQ(Cost of Service Quality model), based on process as follow:
COSQ ∑ 𝑃 (1)
where 𝑃 denotes Qcost of Process i, which is composed by PCF of utilities.
1) Calculate Qcost of process
If Qcost of all KPIs in each process is measurable, then Qcost for all KPIs in each of the 12 process can be measured as follows:
𝑃 ∑ 𝑝 (2)
where 𝑝 refers to the Qcost of 𝐾𝑃𝐼 in process i. However, since it is difficult to calculate Qcost of all indicators, we, therefore, calculate the Qcost of all processes by multiplying the Qcost of KPI in each process with the number of KPIs involved.
𝑃 𝑤 𝑀𝑎𝑥 𝑃 (3)
where 𝑤 is the number of subjects that are being tested for standard weight of Qcost for process, 𝑀𝑎𝑥 𝑃 is to the highest Qcost existing in the subjects being selected.
2) Calculate Qcost of KPI
Qcost for each KPI consists of the following parts. The level of sigma to be improved in each process multiplies Qcost per sigma for each KPI.
𝑝 𝑐 ∑ 𝑠 (4)
where 𝑐 is Qcost per a sigma for 𝐾𝑃𝐼 , 𝑠 is sigma level to be improved in each branch.
3) Calculate improvement of sigma level for each branch
The sigma level to be improved for each branch is calculated with the difference between the current sigma level and the target sigma level.
𝑠 .
. (5)
where 𝑑 . is indicator value for 6 sigma level in 𝐾𝑃𝐼 , 𝑑 is indicator value for each branch, 𝜎 . is a sigma level of 𝐾𝑃𝐼 .
However, there are different methods to calculate the target sigma level of KPIs for each branch. First, statistically, medium and standard deviation can be used, setting 3 sigma as the medium. Second, setting the branch with the best sigma level of each KPI as six sigma. In such occasion, the target level for quality improvement is defined. Third, based on 80:20 Mckinsey Approach, the upper 20% of the branches are set as six sigma.
In this research, the current sigma level of upper 20% of all branches is set to be six sigma, and the quality level of each branch is analyzed accordingly. The sigma level of the branch with the poorest performance is set to be 2 sigma, rather than 0 sigma. Thus, the sigma level to be improved can be calculated as follows:
Value of indicator can be divided as follow equation, according the purpose of indicator is to maximize or minimize. In case the current sigma level is over 6 sigma (i.e. the sigma level to be improved is less than 0), the value of the sigma level to be improved will be set as 0.
⎣ ⎢ ⎢ ⎢
⎡𝑖𝑓 𝑚𝑎𝑥, 𝑠 .
𝑖𝑓 𝑚𝑖𝑛, 𝑠 .
𝐼𝐹 𝑠 0, 𝑠 0 ⎦⎥
⎥ ⎥ ⎤
7267 Current sigma level is calculated as follow:
𝑖𝑓 𝑚𝑎𝑥, 𝑠 6 .
𝑖𝑓 𝑚𝑖𝑛, 𝑠 6 . (7)
4) Calculate 1 sigma level
In order to analyze improvement of sigma level for each branch, it is initial to calculate 1 sigma level for 6 sigma level. Two approaches are divided when defining maximization or minimization indicators.
𝑖𝑓 𝑚𝑎𝑥, 𝜎 . ,
𝑖𝑓 𝑚𝑖𝑛, 𝜎 . , (8)
3.2 Procedure
The procedure developing COSQ is as follows.
1) Calculate 1 sigma level to define 6 sigma level
2) Calculate current sigma level for each branch
3) Calculate improvement of sigma level 4) Calculate sigma level for KPI 5) Calculate sigma level for Process 6) Calculate COSQ for company
4. EXPERIMENTAL RESULT
Based on the above methodology, this research developed a COSQ model and adapts it to a utility company.
1) Calculate 1 sigma level to define 6 sigma level
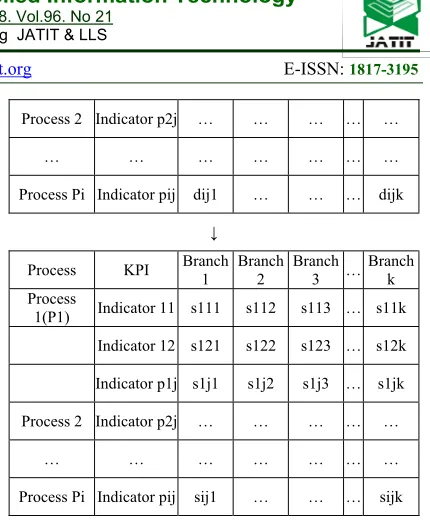
First, the data are defined as follows to analyze Qcost. 𝑃 is cost for 12 process, 𝑝 is Qcost of measured KPI for process i , 𝑠 is improvement of six sigma level for each branch and 𝑑 is indicator value for each branch in Table 2.
Table 2: Transformation Indicator Value To Sigma
Process KPI Branch 1 Branch 2 Branch 3 …Branch k
Process1(P1) Indicator 11 d111 d112 d113 … d11k
Indicator 12 d121 d122 d123 … d12k
Indicator p1j d1j1 d1j2 d1j3 … d1jk
Process 2 Indicator p2j … … … … …
… … … … …
Process Pi Indicator pij dij1 … … … dijk
↓
Process KPI Branch 1 Branch 2 Branch 3 …Branch k Process
1(P1) Indicator 11 s111 s112 s113 … s11k Indicator 12 s121 s122 s123 … s12k
Indicator p1j s1j1 s1j2 s1j3 … s1jk
Process 2 Indicator p2j … … … … …
… … … … …
Process Pi Indicator pij sij1 … … … sijk
The value of indicator i and rank of 14 branches is shown as Table 3.
Table.3: Data of Indicator i In 14 Branches
B1 B2 B3 … B11 B12 B13 B14
Indicato
r i 685 911 657 … 2,843 831 1,611 293
Rank 10 8 11 … 1 9 3 14
As the purpose of indicator i is to minimize, we calculate 1 sigma level by equation (8).
𝜎 12𝑡ℎ 𝑑 . max 𝑑 ,
[image:4.612.312.527.44.305.2]4
|602 2,483| 4 560
2) Calculate current sigma level for each branch
Current sigma level for each branch is shown as Table 4.
Table.4: Current Sigma Level For Each Branch
B1 B2 B3 … B11 B12 B13 B14
Indicato
r i 685 911 657 … 2,843 831 1,611 293 Current
sigma 5.9 5.4 5.9 … 2 5.6 4.2 6.6
For example, current sigma level for B1 is calculated by equation (7).
𝑠 6 𝑑 12𝑡ℎ 𝑑 .
𝜎 6
685 602
7268 3) Calculate improvement of sigma level
Improvement of sigma level for each branch is shown as Table 5.
Table.5: Improvement Of Sigma Level For Each Branch
B1 B2 B3 … B12 B13 B14 Sum
Indicato
r i 685 911 657 … 831 1,611 293 Improve
ment
sigma 0.1 0.6 0.1 … 0.4 1.8 13.7
For example, improvement of sigma level for B1 is calculated by by equation (6).
𝑠 𝑑 12𝑡ℎ 𝑑 .
𝜎
685 602
𝜎560 0.1
4) Calculate sigma level for KPI
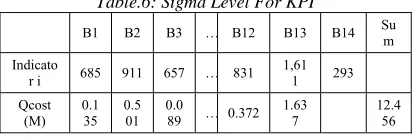
[image:5.612.315.527.158.349.2] [image:5.612.90.297.371.441.2]Sigma level of KPI for each branch is shown as Table 6.
Table.6: Sigma Level For KPI
B1 B2 B3 … B12 B13 B14 Sum
Indicato
r i 685 911 657 … 831 1,611 293 Qcost
(M) 0.135 0.501 0.089 … 0.372 1.637 12.456
For example, if cost per a indicator value is 1,623won, then cost of 1 sigma is 0.9 million won. Improvement of sigma level for B1 is calculated as follow:
𝑄𝑠 𝑐 𝑠 0.9𝑀 0.1 0.135𝑀
Total cost of quality for indicator i is calculated by by equation (4).
𝑝 𝑐 𝑠 0.9𝑀 13.7 12𝑀
5) Calculate sigma level for Process
Sigma level for Process is calculated by equation (3).
𝑃 𝑤 𝑀𝑎𝑥 𝑃 10 12M 124M
6) Calculate COSQ for company
Based on the above formula, total improvement sigma and Qcost for each branch is shown in Table 7 and COSQ in the Company is shown in Table 8.
Table 7: Total Improvement Sigma And Qcost For Each Branch
Branch Improvement sigma Qcost value rank value rank
B1 1.9 1 33 1
B2 6.1 8 130 4
B3 6 7 187 6
B4 4.7 4 76 2
B5 8.7 11 321 9
… … … … …
B11 12.2 14 404 12
B12 10 12 337 10
B13 7.3 10 164 5
B14 4.2 3 111 3
Sum 92 3,465
[image:5.612.316.528.464.707.2]A standard weight is given to each 5 process to indicate the relative importance. The result reveals that Manage Financial Resource takes the largest portion of 76.96%. Therefore, it is initial to manage indicators of financial resource first for higher efficiency. In particular, results of each branch show that there are even 4 branches who are at only 2 sigma level.
Table 8: COSQ In The Company
Standa rd weight
for each process
Qco st
Qcost for the proces
s
Rate
OPER ATING
PROC ESS
Market and Sell Products and Services
6 19 114 0.1
Deliver Products and
Services
34 398 13,542 13.05
Manage Customer
Services
10 12 125 0.12
MANA GEME NT AND SUPP ORT PROC ESSES
Manage Financial Resources
29 2,754 79,862 76.96
Acquire, Construct, and
Manage Property
36 281 10,130 9.76
7269 Deliver Products and Services seizes for 13.39% while Acquire, Construct, and Manage Property seizes 9.72%. The relative large portion of Deliver Products and Services mainly contributes to its nature that it is one of the most frequent activities that are conducted in the company.
5. DEVELOPMENT OF MANAGEMENT
SYSTEM OF COSQ
This research develops QMS through the process of the systems development methodologies, such as requirement analysis, system analysis & design, implementation and test. This research develops the system configuration diagrams, interface design diagrams and manual of user and administrator. Final, QMS is implemented. To test QMS, this research analyzes Qcost in a service company. The company is utility service company and it has 14 branches and various processes for customer service. QMS is developed with the following procedures.
1) We collected customer (a service company)’s requirements. They wanted to estimate and analysis the quality cost considering cost of poor process performance.
2) We investigated the processes, key performance index(KPI), cost structure, etc of the company.
3) We evaluated current six sigma level and qcost of a specific process and a KPI of a specific branch. And, we made qcost evaluation modules and analysis modules. 4) We analyzed and designed data entities and
relationships and developed qcost management system.
5) We applied and tested this system to the service company.
The company has many branches and employees. So, we developed QMS based on web environment. We used Apache web server, Tomcat, MySQL DB, and PHP5. Table 9 shows development environment.
Table 9: Development Environment Environment Language and Tools
Web Server Apache
WAS Tomcat
DB MySQL
Language PHP, HTML, JavaScript
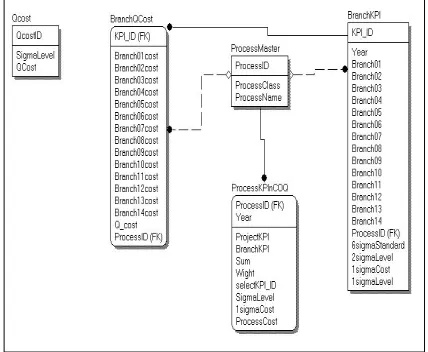
[image:6.612.316.530.217.393.2]QMS evaluate and manage sigma level and Qcost of the company. Also, the system manages qcost by various processes and Qcost by KPI(Key Performance Index). For this, we have to manage various original data and data driven from original data. Figure 2 shows data entities and relationships between data entities for the system.
Figure 2: Entity-Relationship Diagram
[image:6.612.315.527.482.678.2]Managers want to check the whole situation the company is in. So, the system provides the managers with module showing total Qcost of the company. Figure 3 shows total sigma level and Qcost of the company.
Figure 3: Sigma Level and Qcost
7270 “develop vision and strategy”, “develop and manage products and services”, “market and sell products and services”, “deliver products and services”, and “manage customer service”.
[image:7.612.313.534.42.273.2]Management and support process group includes 7 processes – “develop and manage human capital”, “manage information technology”, “manage financial resources”, “acquire, construct and manage property”, “manage environmental health and safety (EHS)”, “manage external relationships”, and “manage knowledge, improvement, and change”.
Figure 4: Qcost By Process
The system shows improved sigma level, improved sigma level of process, Qcost/1sigma, Qcost of process and share by process.
When we want to know sigma level and qcost of branches, we can select current sigma level and improved sigma level menu. Figure 5 shows current sigma level by processes and branches and Figure 6 shows improved sigma level by processes and branches. We can compare the current sigma level and improved sigma level by processes and branches.
Figure 5: Current Sigma Level
6. CONCLUSIONS
The purpose of this research is to develop QMS and to propose a methodology for measuring COSQ in service industries. Based on a field study on utilities service, this research tested the COSQ of this company by specifying the Qcost on 14 different branches within the company. Firstly, the current Qcost originates from the sum of Qcost of 12 process. KPI for each process is induced. Qcost of all 12 process is tested in 14 branches. Through the research, the company oriented Qcost model is developed.
Secondly, QMS is developed to estimate and analysis the quality cost considering cost of poor process performance in service industries. QMS is developed through the process of the systems development methodologies, such as requirement analysis, system analysis & design, implementation and test.
However, there are still limitations for our research. Due to the characteristic of the sample company, COSQ model developed in this research may be difficult to adapt in all service industries. Thus, specific task characteristics of other service industry corporations should be taken into consideration in the future when using this model. Furthermore, this research examined the total Qcost by indicating KPIs of different processes, however, there may be other indicators that may have the influence on total Qcost.
ACKNOWLEDGMENTS:
[image:7.612.90.302.241.432.2]7271 REFRENCES:
[1] J.M. Freeman, “Estimating Quality Costs”, The Journal of the Operational Research Society,
Vol.46, No.6, 1995, pp. 675-68.
[2] M. Zahar, A.E. Barkany and A.E. Biyaali, “Managing Cost of Quality in Laboratory of Water Analysis”, Modern Applied Science, Vol.
9, No. 2, 2015, pp. 199-205.
[3] T.L. Albright and H.P. Roth, “The Measurement of Quality Costs: An Alternative Paradigm”, Accounting Horizons, Vol. 6, No.
2, 1992, pp. 15-27.
[4] S.K. Srivastava, “Towards Estimating Cost of Quality in Supply Chains”, Total Quality Management & Business Excellence, Vol. 19,
NO. 3, 2015, pp. 193-208.
[5] A.V. Feigenbaum, “Total Quality Control”,
Harvard Business Review, Vol. 34, No. 6,
1956, pp. 93-101.
[6] J.M. Juran, “Quality Control Handbook”, McGraw-Hill, New York, 1951.
[7] G.S. Wasserman, and J.M. Lindland, “A Case Study Illustrating the Existence Of Dynamics in Traditional Cost-Of-Quality Models”,
Quality Engineering, Vol. 9, No. 1, 1996, pp.
119-128.
[8] J.R. Evans and W.M. Linsday, “The Management & Control of Quality”, 6th edition, International Thomson Publishing, Mason, OH, 2005.
[9] J. Campanella, “Principles of Quality Costs”, 3rd ed. ASQ Press. Milwaukee, WI, 1999. [10] N. Chiadamrong, “The Development of an
Economic Quality Cost Model”, Total Quality Management & Business Excellence, Vol. 14,
No. 9, 2003, pp. 999 - 1014.
[11] L. Weinstein, R.J. Vokurka and G.A. Graman, “Costs of Quality and Maintenance: Improvement Approaches”, Total Quality Management & Business Excellence, Vol. 20,
No. 5, 2009, pp. 497-507.
[12] A. Schiffauerova and V. Thomson, “A Review of Research on Cost of Quality Models and
Best Practices”, International Journal of Quality & Reliability Management, Vol. 23,
No. 6, 2006, pp. 647-669.
[13] J.J. Plunkett and B.G. Dale, “Quality Costing: A Study in the Pressure Vessel Fabrication Section of the Process Plant Industry”, Quality Assurance, Vol. 9, 1983, pp. 93-96.
[14] F. Machowski and B.G. Dale, “Quality Costing: An Examination of Knowledge, Attitudes, and Perceptions”, Quality Management Journal, Vol. 5, No. 3, 1998, pp.
84-95.
[15] H.M.E. Abdelsalam and M.M. Gad, “Cost of Quality in Dubai: An Analytical Case Study of Residential Construction Projects”,
International Journal of Project Management,
Vol. 27, 2009, pp. 501-511.
[16] P.B. Crosby, “Quality is Free: The Art of Marking Quality Certain”, McGraw-Hill, New York, 1979.
[17] D.T. Ross, “Structured Analysis (SA): A Language for Communicating Ideas”, IEEE Transactions on Software Engineering, Vol. 3,
No. 1, 1977, pp. 16-34.
[18] J. Marsh, “Process Modeling for Quality Improvement”, Proceedings of the Second International Conference on Total Quality Management, IFS Publications, Bedford, 1989,
pp. 111-121.
[19] L.J. Porter and P. Rayner, “Quality Costing for Total Quality Management”, International Journal of Production Economics, Vol. 27, No.
1, 1992, pp. 69-81.
[20] R. Cooper and R.S. Kaplan, “Measure costs right: Make the right decisions”, Harvard Business Review, Vol. 66, No. 5, 1998, pp.
96-103.
[21] G. Tennant, “SIX SIGMA: SPC and TQM in Manufacturing and Services”, Gower Publishing, 2001.
[22] APQC, The electronic utilities process
classification framework,