ISSN: 1992-8645 www.jatit.org E-ISSN: 1817-3195
144
IMPROVEMENT OF THE METHODOLOGY FOR GRAIN
QUALITY ASSESSMENT
1
BAKYTKAN DAULETBAKOV, 2LYAZZAT SULTANGALIYEVA, 3ARAILYM ABITOVA,
4
PRIMZHAROVA KALYASH
1
Almaty Technological University, Department of Accounting and Finance, PhD in Economics, professor
2
Almaty Technological University, Department of Accounting and Finance, Candidate of Economic
Sciences
3
Almaty Technological University, Department of Accounting and Finance, Senior Lecturer
4
New Economic University named after Ryskulov Turar, Department of State Regulation of Economics, Associate Professor
E-mail: [email protected], 2 [email protected], 3[email protected], 4
ABSTRACT
In the article - assessment of the potential properties of the grain; analysis of technological schemes, options, and select the minimum number of parameters to take into account the effect of the complex form of physical and chemical structural, mechanical and biological properties of the processed grain on the basis of factor analysis
Keywords: Technological Cycle Assessment, Factor Analysis
1. INTRODUCTION
In techniques and technologies of mill production also remain the following tasks: assessment of the potential properties of the grain; analysis of technological schemes, options, and select the minimum number of parameters to take into account the effect of the complex form of physical and chemical structural, mechanical and biological properties of the processed grain.
In recent years in Kazakhstan [1, 2] and abroad [3-6] pays great attention to scientific developments on the quality of the flour, depending on its use in the food sector of the economy.
Differentiated approach to the quality of the flour are applied abroad, depending on its use [7-10]. For example, in the UK for assessing technological qualities of wheat grains are the following: falling number is measured by the Hagberg-Perten method, protein content test, much attention is paid to indicators such as the variety of wheat [7].
2. THE MAIN PURPOSE
Currently in Kazakhstan, the main control of baking properties of the grain is making at the final stage of its processing, when already
expended considerable funds and effort on the finished product and there is little opportunity to affect to its quality. In this regard, the important task is transition from quality control of finished products to a preliminary control at the stage of production – throughout the manufacturing cycle – “grain indicator – flour – dough – bread”, which allows significantly reduce costs for research and predict the quality of the final product, but also adjust the properties of the intermediate products in the right direction.
In this way of technological cycle for introducing comprehensive aggregated indicators are still nowhere represented. In this regard, the urgent task is improving the methodology of evaluating grain quality.
ISSN: 1992-8645 www.jatit.org E-ISSN: 1817-3195
145 The purpose of factor analysis as a branch of mathematical statistics is to develop models and methods to analyze and interpret the arrays of experimental or observed data, regardless of their physical nature [11-13].
The array of researched information is a rectangular matrix ||Xij||, the rows of which are characterized by n objects of observation (i=1,2,...,n) and the columns are the set of attributes describing the observations (j=1,2,3,...,m).
In the practical study, the matrix size is usually quite large. The number of rows can vary from a few dozen to several thousand, and the number of columns - from one or two to several dozen. Therefore, direct analysis of the matrices is impossible. For the evaluation of such matrices in mathematical statistics, there have been many methods designed to "compress" the initial information contained in the matrix, derived from information the most "important".
There are currently several methods for solving the estimates of the correlation between parameters. The simplest and most suitable for use are correlation, regression and factor analyses. Correlation and regression analyses are useful for disclosing cause-effect relationships. Factor analysis assesses the relationship of the group of monitored parameters with pre-unknown not observed (factors and the equations defining these factors).
In other words, Factor analysis can be considered as extension of correlation analysis. It is advantageous to use whenever large number of variables should be tested for interdependence. In this process, the task of dimension (m×m) is converted to a problem of dimension (n×m) where n≤m. The goal is to limit the influence of variables to a few factors.
There are many excellent books on factor analysis. A more detailed description in works of Lawley, D., Maxwell A. [11], Harman G [12], Zhukovskaya V. M. and Muchnik I. B. [13].
3. TYPICAL TASKS OF FACTOR ANALYSIS
In applied research there are a variety of setting tasks using factor analysis. The differences are in the approach (in the General setting of the researcher, applying the factor model) and in the formulation of goals, in 34 organizations of the source material, in the use of the results. All these differences determine the choice of model and the number of issues related to the normalization of the task
4. TYPOLOGY TASKS
Quite often, the researcher is faced with the need to subdivide the set of observable objects or phenomena, which are described by some set of indicators, into homogeneous as possible groups (on these grounds). The value of such grouping is that for the obtained groups it is often possible to build simple models of functional relationships. Let’s assume, that it is necessary to optimize the production activities of a large number of enterprises [14]. In this case, it is necessary to establish typology of enterprises, i.e. to divide all enterprises into groups as homogeneous as possible in terms of production, and then build programs for companies, that comprise each group.
The decision tree of typology task with the using of factor analysis can be represented in the form of successive transformations of the following matrices: source data, pairwise correlations, factor loadings, factor scores, and distances between locations on individual factors.
Based on the last matrix the taxonomy is constructed; after the introduction of additional restrictions, the study and interpretation of the typology are implemented. Thus, the typology is based on the results of factor analysis, defined on the values of factor scores. In cases, where it is recognized, that for building taxonomy, it is necessary to consider two or three of the first factor, the identifying of objects types can be carried out by an expert way through visual analysis (analysis of histograms scores by individual factors), in other cases, it is necessary to use automatic classification algorithms [15, 23].
5. TASK OF SIGNS SYSTEM ANALYSIS
To analyze the signs systems we are faced not with the classification of objects, but with classification of indicators.
Suppose we have n observations (i=1,2,...,n) combinations of m attributes (j=1,2,3,...,m) Xij. It is necessary to split the feature space on the most interconnected group. This is a typical problem of building classification, which consists in the purposeful streamlining of the initial information, in the separation of many signs on a subordinated and dependent.
Suppose there are m quality characteristics of grain and flour. As part of this task is possible:
ISSN: 1992-8645 www.jatit.org E-ISSN: 1817-3195
146 the state of the grain mass. This is possible through the design of new synthesis specifications, subject to interpretation. In work [5] the 11 quality indicators were reduced to two factors: protein-proteinase and vitreousness factor.
6. TASK OF ZONING
In the practice of planning economic development often faced the challenge of dividing the territory on the most homogeneous on a number of indicators. In this case, the objects may serve different territorial units (districts, regions, republics, etc.). One or another association of territorial units gives the scheme zoning of the study area [13, 16-22, 24].
7. THE MAIN RESEARCH PHASE
The task of definition. One of the main prerequisites for the development and improvement of methodology of grain quality estimation is: to estimate the potential properties of grain; analysis of technological schemes, parameters and selection of a minimum number of parameters, in the complex form takes into account the influence of physic-chemical, structural and mechanical, and biological properties of the processed grain.
Data matrix. To identify the main patterns of connections we investigated the quality of grain, flour, dough and bread – the samples of wheat sort Saratovskaya 29 through the Northern regions of Kazakhstan, located near the grain reception enterprises.
7.1 Thus for the study of grain quality were considered the following:
1) Humidity, %; 2) Black dockage, %; 3) Grain dockage, %; 4) Natura g / l 5) Total vitreousness, %; 6) Full vitreousness, %; 7) Ash content, %; 8) Protein, %; 9) Gluten, %; 10) Chinch, %.
7.2 For the flour quality was considered the following:
11) Gluten, %; 12) Ash content, %.
7.3 For the dough quality reviewed the performance of alveograph and farinograph devices:
13) Elasticity, P; 14) Extensibility, L; 15) Ratio of P/L; 16) Elastic dough resilience; 17) Water absorption capacity,%; 18) Dough formation time; 19) Stability dough; 20) Dough dilution; 21) Indicator of valorimeter.
7.4For the bread quality, the following was investigated:
22) Volume of grain yield; 23) Bread slackness V/D.
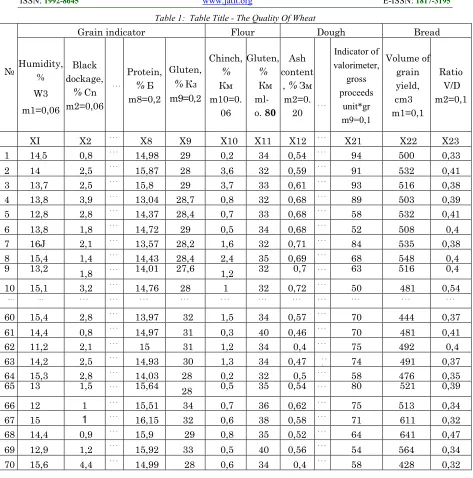
Values of indicators are measured for each of 70 experiments, representing the general population as whole. Thus, the data matrix has dimension of 70×23. The rows correspond to 70, columns to 23 indicators. Each element of the matrix is the value of one of the 23 indicators for one of the 70 experiments.
8. PRELIMINARY DATA TRANSFORMATION
For bringing all indicators to unified scale is used transformation of the initial numbers by ranks, i.e. each column of the matrix of the original data is represented by a set of sequence numbers (1 to 70) in accordance with the sequence of the places of experiments on the values of this indicator (Table 1).
Factor analysis procedure is performed with the help of «STATISTICA 10» application package by using principal component analysis [14].
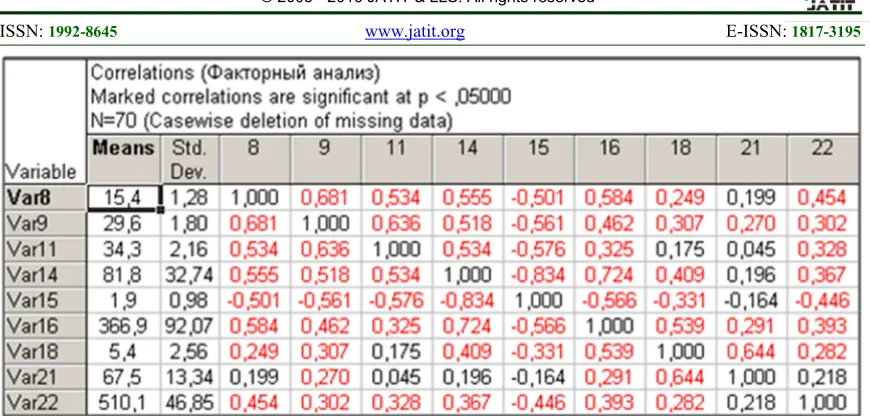
Correlation matrix. The matrix of pairwise correlations between indicators calculated on the basis of the matrix sequence numbers (Figure 1).
The matrix of correlation coefficients (Figure 1) serves as a quantitative expression of the degree of connection between each pair of the 23 indicators. Analysis of the correlation matrix allows to identify the most closely related pair of indicators; there are 8 and 9,9 and 6, 11 and 9, 14 and 16, 15 and 14, 16 and 14, 18 and 21, 22 and 8. The structure of interrelations between the groups of indicators identified by factor analysis.
The calculation of the correlation matrix – the first stage of factor analysis.
ISSN: 1992-8645 www.jatit.org E-ISSN: 1817-3195
[image:4.612.316.516.186.367.2]147
Figure 2. Define Method Of Factor Extraction
Select the Principal components (Main components) and click the button OK.
The system will quickly compute and on the screen will appear the window Factor Analysis Results (factor analysis results) (Figure 3)
In the top of the window the Results of factor analysis given an informational message:
Number of variables (number of variables being analyzed) – 9;
Method (method of analysis) – principal components;
[image:4.612.313.513.454.626.2]log (10) determination of correlation matrix (decimal logarithm of the determinant of the correlation matrix) – -2,2979;
Figure 3. Factor Analysis Results
Number of Factor extraction (number of factor extraction) – 3;
Eigenvalues (eigenvalues) – 4,50739; 1,43036; 0,791230.
In the lower part of the window contains subsections that allow a comprehensive view the analysis results numerically and graphically.
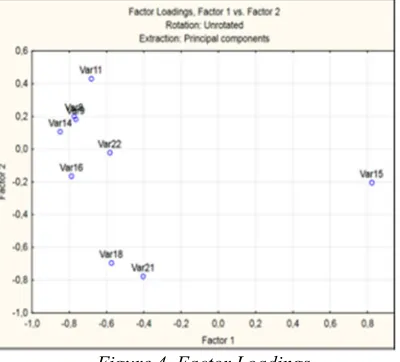
[image:4.612.92.292.454.614.2]Plot of loadings, 2D and Plot of loadings, 3D (Graphics loads) – these options will construct graphs of the factor loadings in the projection on the plane of any two selected factors (Figure 4) and in the projection in the space of three selected factors (which requires the presence of at least three selected factors).
Figure 4. Factor Loadings
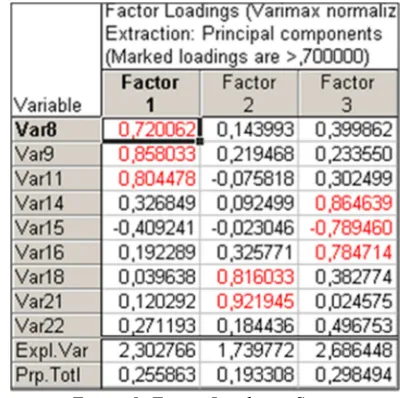
Summary. Factor loadings (Factor loadings). This option causes the current table of factor loadings (Fig. 5), i.e. calculated for the method of rotation of factors specified to the right of the corresponding button.
Figure 5.Factor Loadings With Marked Loadings
ISSN: 1992-8645 www.jatit.org E-ISSN: 1817-3195
148 load on the module, then greater the affinity of the factor to the original variable; thus, they represent the most important information for the interpretation of obtained factors. In the generated table to facilitate the interpretation will be highlighted factor loadings in absolute value greater of 0.7.
Apparently, the first factor is more correlated with the variables than the second is.
They are difficult to interpret; the question arises as to what sense to give to the second factor. In this case, it is advisable to resort to the rotation axis, hoping to get a solution that can be interpreted in the subject area.
Click on the menu Factor rotation (Rotation of factors) (Figure 6).
The purpose of the rotation is to obtain the simple structure, in which the majority of observations is close to the coordinate axes. By random configurations of observations, it is impossible to obtain a simple structure.
From this dropdown menu we can choose different rotations of the axis. The window offers several options to evaluate and find the right rotation by the following methods: Varimax; Biquartimax; Quartimax; Equamax.
Figure 6. Factor Rotation
Figure 7. The Graph Of Loads
The additional term in the name of the methods – normalized (normalized) – indicates that the factor loadings in the procedure are normalized, i.e. divided by the square root of the corresponding variance. The term raw (source) shows that rotating loads are not normalized.
Click Varimax normalized (Varimax normalized). The system will produce a rotation of the factors by the method of normalized varimax, and window Factor Analysis Results (factor analysis results) appears again on the monitor.
Again click in this window the button Plot of Loadings 2D (two-dimensional graph of the load). Again, we see a graph of loads (Figure 7).
Of course, this graph is slightly different from the previous one. We will see loads numerically, by initiating the button Factor loadings (Factor loadings). Click on the button Summary. Factor loadings, you will open a window (Figure 8): Now the solution already found and can be interpreted. Factors are often interpreted on loads. The first factor most closely associated with X8, X9, X11.
Second factor – X18 and X21. Third factor – X14, X15, X16.
[image:5.612.308.508.426.625.2]Therefore, we categorized the variables into three groups. The question arises: how many factors should be limited in practice?
ISSN: 1992-8645 www.jatit.org E-ISSN: 1817-3195
149
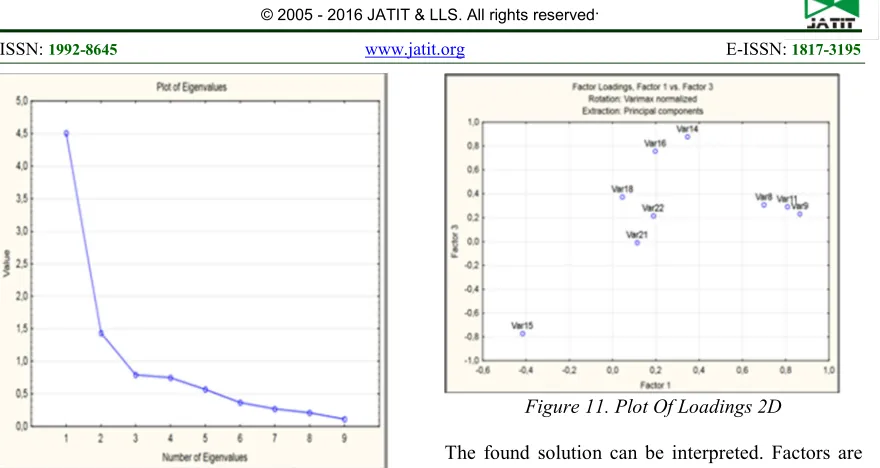
Figure 9. Plot Of Eigenvalues
For that, in a software package of STATISTICA, there is a criterion of Scree plot (the scree criterion). In window Factor Analysis Results click the Scree plot and we will get the next graph of eigenvalues (Figure 9):
[image:6.612.91.531.57.291.2]At the points with coordinates 1, 2, 3, 4 the shedding most significantly slows down, therefore, theoretically, it can be limited by four factors (Figure 10):
Figure 10. Limited By Four Factors
Figure 11. Plot Of Loadings 2D
The found solution can be interpreted. Factors are often interpreted on loads. The first factor most closely associated with X9, X11
Second factor – X18 and X21. Third factor – X14, X15, X16. Fourth factor – X22.
Therefore, variables are classified into four groups. Again click in this window the button Plot of Loadings 2D (a two-dimensional graph of the loads). Again, we see a graph of loads (Figure 11). The transformation of the correlation matrix (Figure 1) in the matrix of factor loadings (Figure 5, Figure 8 and Figure 10) was done in several ways: by using the centroidal method, minimal residual method, maximum likelihood method and method of principal components. The comparison of the results confirms the conclusion about the objective nature of the revealed factor structure: calculating the matrix of factor loadings in all four ways were very close in obtained data, which confirms the proposed interpretation by using the method of principal components.
In line Expl.Var (Figure 5) shows the variance attributable to a particular factor. In line Prp.Totl shows the proportion of variance attributable to the first, second and third factors. The contribution of each factor to the total variation of 50,1%, 15.9% and 8.8%, respectively.
Presented in Figure 5, the matrix of factor loadings obtained by principal component analysis. The basis for determining the factors was a sequence of eigenvalues of the original correlation matrix. The contribution of each factor to the total variance were compared with some threshold; based on this, factorization is terminated after the extraction of four factors (Figure 5).
[image:6.612.89.290.431.586.2]ISSN: 1992-8645 www.jatit.org E-ISSN: 1817-3195
150 connected among themselves more closely; resulting in changes of one of them most likely causes a change in another. The relationship between the indicators of the other parts are less pronounced or completely absent. Considering general and special variance, it allows from sampled 23 quality indicators to choose several generalized factors (quality indicators groups), change of which entails a significant change in other indicators of quality. In our case, such generalized factors are four, marked as Factor 1 - f1, Factor 2 - f2, Factor 3 - f3 and Factor 4 - f4. The obtained factor solution in terms of the two factors can be considered as some intermediate solution, that satisfies the main factor theorem.
where Zj - normalized value j - of those indicator; fp – p common factor with variance equal to one; Uj - characteristic factor that takes into account the residual variance;
ljp, dj - factor load j - of those indicator on p common factor.
Measurement errors appear as specific factors (Uj) and will not specifically taken into account.
Using the rotation of coordinates, we obtain an infinite set of solutions that adequately describes the process.
The configuration of points in the space of common factors and the distance from the origin does not change.
In Figures 4, 7 and 11 shows the results of coordinate system rotating for wheat.
The abscissa axis shows the load on the first factor, the ordinate in the second. In the space of factors indicators of quality represented by the vectors, squares of the modules of which is equal to the factor variance.
According to the basic principle of factor analysis, the vectors should form the bundles. The spread of vectors relative to the center of the bundle characterizes the uncertainty, when changing the bundle vectors-signs of the factor. Figure 11 clearly shows the presence of four bundles. The first one includes the parameters: the number of gluten in grain and flour. Second - time formation of dough and the rate of valorimeter. Third - extensibility, the ratio P/L; elastic dough resilience and dough formation time. The fourth – volume yield of bread. The first factor, therefore, can be interpreted as a factor of grain indicator, the second - flour
indicator, the third is the dough indicator and the fourth – bread indicator.
Indicators of nature, dough dilution, chinch, the ash content is a separate feature, which does not depend on indicators, forming bundles f1, f2, f3 and f4. It estimates the grain from standpoint of flour milling (high-quality flour extraction).
Thus, to assess the quality of grain it is necessary to consider specific indicators. In this regard, the challenge before us is to develop the foundations for a comprehensive system of grain quality evaluation, taking into account the purpose of grain and grain products, using modern methods of analysis that increase the accuracy of ensuring the adequacy of consumer properties of raw materials, the requirements of the food processing industry. In the course of our work, at the production stage with the use of factor analysis developed an indicator assessment of grain quality throughout the manufacturing cycle:
− "grain indicator – flour – dough – bread", which allows to significantly reduce costs for research and predict the quality of the end product, but also adjust the properties of the intermediate products in the desired direction;
− identified significant indicators of quality of grain;
− made modeled classification of indicators for assessing grain quality.
We derived a system of factors: "grain indicator – flour – dough – bread", shows that each of these parameters finds its maximum expression through a variety of factors.
CONCLUSIONS
1. The method of factor analysis allows to pass from large number of indicators of grain quality to limited number of complex factors, that determine the relationship between these parameters and their technological value.
2. The advantage of this method is the possibility of identifying relationships between the studied indicators of grain quality, do not reveal by the correlation method analysis and regression equations.
3. The technological advantage of grain - wheat, is identical to describing the factor space, forms a system of four factors: "grain indicator – flour – dough – bread".
ISSN: 1992-8645 www.jatit.org E-ISSN: 1817-3195
151 and is not directly associated with the baking
advantage of grain and flour
REFRENCES:
[1] Kazakhstan: non-waste technology for processing of crops / newsland. com / news / detail / id / 693657 /.
[2] Modern aspects of scientific and technological support processing of agricultural raw materials and waste: Sat. the reports of the international scientific-practical conference on 9-10 October 2014 — Astana, 2014.
[3] Torzhinskaya L.R., Romenskii N.V., Atanas L.G., N.G. Umleva Math. universities of the USSR, Food technology, №2, 12, 1965
[4] Serdyukov P.I. Flour signs of quality wheat and their importance for the production of flour. TSNIITEI mine layer of the USSR, Moscow, 1970
[5] Kazakova I.E. Modeling technological quality of grain by factor analysis. Proceedings of the universities of the USSR, Food technology, № 3, 88, 1975
[6] GOST R 52189-2003. Wheat flour. General specifications. — Enter. 2003-29-12. — Moscow: Publishing House of Standards, 2004. — III, 8.
[7] Butkovskiy V.A., touching DA UK milling industry. // Bakery. №12. — 2003. — with. 14-16.
[8] A. Landi. Garatteristiche ottimali del grano duro e tenero per I produtti destinati aii’alimentazione umana. // Informatore agrario. 1987 — t.43. — №36. — S. 29-31.
[9] K.Tiefenbacher, M. Dobrovics. Mehle tur die Waffeiherstellung. // Ver-offentl. Arbeitsgemensch.Getreideferschung ev 2000. — Bd.285. — S. 65-73.
[10] Roy Chung Kah Hee. Weak to strong flour pastry / Roy Chung Kah Hee // Flour — Food for Life: Materials 2nd International Muhlenchemie Symposium, 17/18 June 2004, Hamburg.
[11] D. Lawley, Maxwell A. Factor analysis as a statistical method (trans. From English.). «Peace», 1967.
[12] Xarman G. Modern factor analysis (Per. From English.). Moscow, «Statistics», 1972.
[13] V.M. Zhukovska and I.B. Muchnik Factor analysis of the socio-economic research. Moscow, «Statistics», 1976.
[14] Zhukovska V.M. Kudina I.M. Typological study of US agriculture and Canada, using multivariate analysis. Coll. Issues of economic and political geography of the foreign countries. M., 1971.
[15] E.M. Braverman, Dorofeyuk A.A., Lumelskii V.Y., Muchnik I.B. Diagonalization of matrices of communication and identify hidden in faktorov.- Sat .: Proceedings of the Institute of management problems. «Nauka», 1971, vol. I. [16] Berry B. Inductive Approach to the
Regionalization of Economic Development — «Research Paper of the Univ. of Chicago Dep-t of Geography », 1960, №62.
[17] Economic Regionalization and numerical methods. Eds: Berry R., Wrobel A. In: «Geographia Polonica». Warzawa, 1968, vol. 15.
[18] Edwards C. Regional Variations in Economic Growth with Emphasis on Rural Areas. — «Agricultural Economic Report», Wash., 1971, № 205.
[19] Gould P.R. Problems of Space Preference Measures and Relationships. — «Geographical Analyses», 1969, vol. 1, № 1.
[20] Dauletbakov B., Iztaev A.I., Aryngazin K.S., Omaorov T.E., L.M. Syrlybaeva Simulation of grain quality using factor analysis. Food technology and service. Almaty, 2007. №2. S. 3-7.
[21] Iztaev A. Technological quality of wheat in Kazakhstan. — Alma-Ata: Kaynar, 1992, 368 p. [22] Kazakov E.D. Zernovedenie the basics of crop.
«Kolos», Moscow, 1973.
[23] Alexey An, Bakytkan Dauletbakov, Eugene Levner.Computational Linguistics and Intelligent Text Processing Lecture Notes in Computer Science Volume 8404, 2014, pp. 404-416.
ISSN: 1992-8645 www.jatit.org E-ISSN: 1817-3195
[image:9.612.71.544.81.559.2]152
Table 1: Table Title - The Quality Of Wheat
№
Grain indicator Flour Dough Bread
Humidity, %
W3
m1=0,06
Black dockage,
%
Cn m2=0,06. . .
Protein,
%
Бm8=0,2
Gluten,
%
Кзm9=0,2
Chinch,
%
Км m10=0.06
Gluten,
%
Км ml-о. 80
Ash content
,
%
Зм m2=0.20
. . .
Indicator of valorimeter,
gross proceeds
unit*gr m9=0,1
Volume of grain yield, сm3
m1=0,1
Ratio V/D m2=0,1
XI Х2 . . . Х8 Х9 Х10 X11 Х12 . . . Х21 Х22 Х23
1 14,5 0,8
. . .
14,98 29 0,2 34 0,54 . . . 94 500 0,33
2 14 2,5 . . . 15,87 28 3,6 32 0,59 . . . 91 532 0,41
3 13,7 2,5 . . . 15,8 29 3,7 33 0,61 . . . 93 516 0,38 4 13,8 3,9 . . . 13,04 28,7 0,8 32 0,68 . . . 89 503 0,39
5 12,8 2,8 . . . 14,37 28,4 0,7 33 0,68 . . . 58 532 0,41
6 13,8 1,8 . . . 14,72 29 0,5 34 0,68 . . . 52 508 0,4
7 16J 2,1 . . . 13,57 28,2 1,6 32 0,71 . . . 84 535 0,38 8 15,4 1,4 . . . 14,43 28,4 2,4 35 0,69 . . . 68 548 0,4
9 13,2
1,8 . . . 14,01 27,6 1,2 32 0,7 . . . 63 516 0,4
10 15,1 3,2 . . . 14,76 28 1 32 0,72 . . . 50 481 0,54
. . . .
60 15,4 2,8 . . . 13,97 32 1,5 34 0,57 . . . 70 444 0,37
61 14,4 0,8 . . . 14,97 31 0,3 40 0,46 . . . 70 481 0,41
62 11,2 2,1 . . . 15 31 1,2 34 0,4 . . . 75 492 0,4
63 14,2 2,5 . . . 14,93 30 1,3 34 0,47 . .. 74 491 0,37
64 15,3 2,8 . . . 14,03 28 0,2 32 0,5 . . . 58 476 0,35 65 13 1,5 . . . 15,64
28 0,5 35 0,54 . . . 80 521 0,39
66 12 1 . . . 15,51 34 0,7 36 0,62 . . . 75 513 0,34
67 15 1 . . . 16,15 32 0,6 38 0,58 . . . 71 611 0,32
68 14,4 0,9 . . . 15,9 29 0,8 35 0,52 . . . 64 641 0,47
69 12,9 1,2 . . . 15,92 33 0,5 40 0,56 . . . 54 564 0,34
ISSN: 1992-8645 www.jatit.org E-ISSN: 1817-3195
[image:10.612.91.526.66.274.2]153