IJPSR (2014), Vol. 5, Issue 8 (Research Article)
Received on 18 February, 2014; received in revised form, 10 April, 2014; accepted, 13 June, 2014; published 01 August, 2014
DEVELOPMENT AND VALIDATION OF AN UV- SPECTROPHOTOMETRIC METHOD FOR THE ESTIMATION OF FLUOXETINE IN PURE AND TABLET DOSAGE FORMS
Avisek Mukhopadhyay, Kishanta Kumar Pradhan*, Rojalini Samanta
Department of Pharmaceutical Science and Technology, Birla Institute of Technology, Mesra, Ranchi -835215, Jharkhand, India
ABSTRACT: A rapid, precise, accurate, sensitive, simple, fast and reliable spectrophotometric method has been developed for determination of Fluoxetine in bulk and pharmaceutical dosage forms. The solubility of Fluoxetine was also examined in various solvents like distilled water, methanol, ethanol, acetonitrile, HCL, chloroform etc. For the determination of working wavelength different concentrations of Fluoxetine (10-60μg/ml) in water: methanol (9:1) was scanned using UV-VIS spectrophotometer within the wave length region of 200-400 nm against water and methanol mixture as blank. For the calibration curve the prepared concentrations were scanned at
216 nm in UV-VIS spectrophotometer. The R2 value was found to be
0.999. Then the standard deviation was found to be 0.0065. Then the stability study was performed against neutral, acidic and basic condition at 60°C as per ICH guideline.
INTRODUCTION: Fluoxetine is chemically known as (D, L-N-methyl-3-phenyl-3-[(tri-fluoro-p-tolyl) oxy]propylamine and the structure is given in Fig. 1. Actually Fluoxetine is an antidepressantof the selective serotonin reuptake inhibitor (SSRI) class. Fluoxetine was first documented in 1974 by scientists from Eli Lilly and Company. It was presented to the U.S. Food and Drug Administration in February 1977, with Eli Lilly receiving final approval to market the drug in December 1987. Fluoxetine went off-patent in
August 2001 1, 2.
QUICK RESPONSE CODE
DOI:
10.13040/IJPSR.0975-8232.5(8).3418-24
Article can be accessed online on: www.ijpsr.com
DOI link: http://dx.doi.org/10.13040/IJPSR.0975-8232.5(8).3418-24
Fluoxetine is approved in the US for the treatment
of major depression (including pediatric
depression), obsessive-compulsive disorder (in both adult and paediatric populations), bulimia nervosa, panic disorder and premenstrual dysphoric
disorder 3. In addition, fluoxetine is used to
treat trichotillomania if cognitive behaviour therapy is unsuccessful. Incombination with the atypical antipsychotic Fluoxetine it is known by a few brand names, including its US brand name Symbyax, which is approved for the treatment of depressive episodes as part of bipolar I disorder and in the treatment of treatment-resistant depression. A few methods were reported earlier for the determination of Fluoxetine in bulk and pharmaceutical dosage
forms 4, 5. The present study is designed to develop
a simple, precise and accurate UV spectroscopic and reverse phase HPLC methods with good recoveries and shorter retention time for the estimation of fluoxetine in the tablet formulations.
Keywords:
Fluoxetine, UV spectroscopy, Validation, Degradation Correspondence to Author:
Kishanta Kumar Pradhan
Department of Pharmaceutical Science and Technology, Birla Institute of Technology, Mesra, Ranchi -835215, Jharkhand, India
FIG. 1: CHEMICAL STRUCTURE OF FLUOXETINE.
MATERIALS AND METHODS:
Chemicals: The gift samples of Fluoxetine (pure drug) were procured from La Chemico, Kolkata. The required solvents like HPLC grade methanol, water were purchased from Sigma Aldrich Pvt. Ltd.
Instrument: The UV spectrophotometer used for the current study was UV spectrophotometer (SHIMADZU-1800) having 1 cm path length.
Determination of Working Wave Length: In order to determine the wave length of maximum
absorption (λmax) of the drug, different
concentrations of Fluoxetine (10-60μg/ml) in water: methanol (9:1) was scanned using UV-VIS spectrophotometer within the wave length region of 200-400 nm against water: methanol (9:1) as blank. The working wavelength was found to be 216 nm.
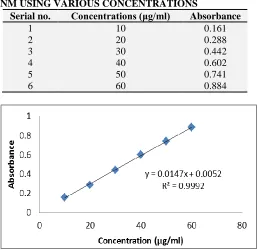
Preparation of Calibration Curve: For
preparation of calibration curve of Fluoxetine, a stock solution of 1000μg/ml was prepared. From it different concentrations ranging from 10-60μg/ml prepared and were scanned at 216 nm in UV-VIS
spectrophotometer. Then the respective absorbances
were noted, which are given in Table 1.
The calibration curve is shown in Fig. 2. From the
calibration curve it was found that it shows linearity in the range of 10-60μg/ml with regression coefficient 0.999.
TABLE 1: ABSORBANCE OF FLUOXETINE AT 216 NM USING VARIOUS CONCENTRATIONS
Serial no. Concentrations (μg/ml) Absorbance
1 10 0.161
2 20 0.288
3 30 0.442
4 40 0.602
5 50 0.741
6 60 0.884
Fig. 2: Calibration curve of Fluoxetine using water: methanol 9:1
Optical characteristics: The optical characteristics like Beer’s Law Limit, Sandell’s Sensitivity,
Standard Deviation, % Relative Standard
Deviation, Correlation Coefficient, Regression equation, Slope, Intercept, and Absorption Maxima
[image:2.612.314.572.133.383.2]were determined and were given in Table 2.
TABLE 2: OPTICAL CHARACTERISTICS OF FLUOXETINE
Serial no. Characteristics Specifications
1 Beer’s Law Limit 10-60 µg/ ml
2 Sandell’s Sensitivity (µg/cm2/0.001absorbance unit) 0.01205
3 Standard Deviation 0.0065
4 % Relative Standard Deviation 0.0614
5 Correlation Coefficient 0.999
6 Regression equation (Y) y = 0.014x + 0.005
7 Slope(a) 0.014
8 Intercept(b) 0.005
9 Absorption Maxima 216 nm
Validation parameters:
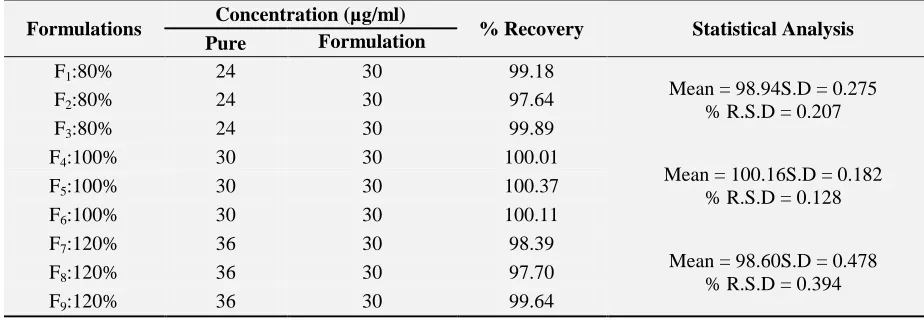
Accuracy: The accuracy of an analytical procedure expresses the closeness of agreement between the
value which is accepted either as a conventional true value or an accepted reference value and the value found. This is sometimes termed trueness.
[image:2.612.77.546.551.671.2]TABLE 3: ACCURACY DATA OF UV SPECTROPHOTOMETRIC METHOD FOR FLUOXETINE
Formulations Concentration (µg/ml) % Recovery Statistical Analysis
Pure Formulation
F1:80% 24 30 99.18
Mean = 98.94S.D = 0.275 % R.S.D = 0.207
F2:80% 24 30 97.64
F3:80% 24 30 99.89
F4:100% 30 30 100.01
Mean = 100.16S.D = 0.182 % R.S.D = 0.128
F5:100% 30 30 100.37
F6:100% 30 30 100.11
F7:120% 36 30 98.39
Mean = 98.60S.D = 0.478 % R.S.D = 0.394
F8:120% 36 30 97.70
F9:120% 36 30 99.64
Precision: The precision of an analytical procedure expresses the closeness of agreement (degree of scatter) between a series of measurements obtained from multiple sampling of the same homogeneous sample under the prescribed conditions. Precision may be considered at three levels: repeatability,
intermediate precision and reproducibility.
Precision should be investigated using
homogeneous, authentic samples. However, if it is
not possible to obtain a homogeneous sample it may be investigated using artificially prepared samples or a sample solution. The precision of an analytical procedure is usually expressed as the variance, standard deviation or coefficient of variation of a series of measurements. The
precision data are given in Table 4. The intra-day
precision data are given in Table 5. The inter-day
precision data are given in Table 6.
TABLE 4: PRECISION DATA OF THE UV-VIS SPECTROPHOTOMETRIC METHOD FOR FLUOXETINE Sl. No. Concentration
(µg/ml)
Absorbance Calculated amount
(μg/ml) Statistical Analysis
1 40 0.605 29.04
Mean=29.37 S.D=0.215 %RSD=0.406
2 40 0.624 29.27
3 40 0.601 28.74
4 40 0.626 29.64
5 40 0.619 29.48
6 40 0.616 29.31
TABLE 5: INTRA DAY PRECISION DATA FOR FLUOXETINE
Conc. (μg/ml) Absorbance1 Absorbance 2 Absorbance 3 Statistical Analysis
40 0.621 0.614 0.604
Mean=29.68 S.D=0.421 %R.S.D=0.253
40 0.602 0.627 0.608
40 0.616 0.623 0.610
40 0.603 0.610 0.598
40 0.622 0.603 0.603
40 0.604 0.607 0.621
Mean 0.613 0.624 0.606
Calc. Amt. (μg/ml) 29.58 29.83 28.49
TABLE 6: INTER DAY PRECISION DATA OF FLUOXETINE
Conc. (μg/ml) Absorbance1
(Day 1)
Absorbance 2 (Day 2)
Absorbance 3 (Day 3)
Statistical Analysis
40 0.621 0.602 0.601
Mean =29.48 S.D =0.426 %R.S.D =0.402
40 0.612 0.614 0.599
40 0.598 0.599 0.592
40 0.620 0.594 0.605
40 0.618 0.619 0.609
40 0.625 0.624 0.595
Mean 0.625 0.615 0.598
Robustness/ Ruggedness: The definition for
robustness/ruggedness applied is the
robustness/ruggedness of an analytical procedure is a measure of its capacity to remain unaffected by small, but deliberate variations in method parameters and provides an indication of its reliability during normal usage. Robustness can be described as the ability to reproduce the (analytical) method in different laboratories or under different
circumstances without the occurrence of
unexpected differences in the obtained results, and a robustness test as an experimental set-up to evaluate the robustness of a method. The term ruggedness is frequently used as a synonym. Several definitions for robustness or ruggedness exist which are, however, all closely related.
Robustness/ Ruggedness data are given in Table 7
and Table 8.
TABLE 7: RUGGEDNESS DATA OF FLUOXETINE
Analyst-1 Analyst-2
Conc.
(μg/ml) Abs.
Calc. Amt. (μg/ml) Statistical Analysis Conc.
(μg/ml) Abs.
Calc. Amt (μg/ml)
Statistical Analysis
40 0.608 29.13
Mean=29.78 S. D=0.693 %RSD=0.572
40 0.617 29.63
Mean=30.14 S.D=0.074 %RSD=0.059
40 0.620 29.80 40 0.632 30.47
40 0.622 29.91 40 0.613 29.41
40 0.637 30.74 40 0.639 30.82
40 0.614 29.47 40 0.622 29.88
40 0.619 29.69 40 0.626 30.13
TABLE 8: ROBUSTNESS DATA OF FLUOXETINE
Water: Methanol (9:1) Water: Methanol (8:2)
Conc.
(μg/ml) Abs
Calc. Amt. (μg/m) Statistical Analysis Conc. (μg/ml )
Abs. Calc.
Amt. (μg/ml)
Statistical Analysis
40 0.600 28.56
Mean=29.28 SD=0.079 %RSD=0.065
40 0.604 28.80
Mean=29.27 SD=0.197 %RSD=0.147
40 0.625 30.07 40 0.597 28.41
40 0.614 29.33 40 0.610 29.13
40 0.630 30.22 40 0.636 30.58
40 0.606 28.89 40 0.612 29.24
40 0.602 28.67 40 0.616 29.47
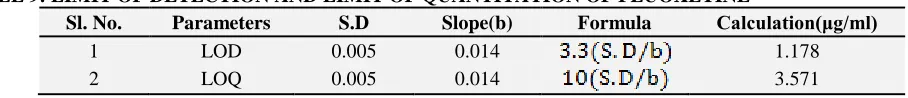
Limit of Detection and Limit of Quantitation:
The Limit of Detection (LOD) of an individual analytical procedure is the lowest amount of analyte in a sample, which can be detected but not
necessarily quantitated as an exact value
determined with statistical method by using Statistical formula. The limit of Detection (L.O.D.) was calculated as per below equation:
LOD =
3.3 X S.D
Slpoe
The Limit of quantification (LOQ) of an individual analytical procedure is the lowest amount of analyte in a sample, which can be quantitatively determined with statistical method by using statistical formula. The limit of Quantification (L.O.Q.) was calculated as per below equation:
LOQ =
10 X S.D
Slpoe
The limit of detection (LOD) and limit of
[image:4.612.70.524.670.719.2]quantification (LOQ) data are given in Table 9.
TABLE 9: LIMIT OF DETECTION AND LIMIT OF QUANTITATION OF FLUOXETINE
Sl. No. Parameters S.D Slope(b) Formula Calculation(μg/ml)
1 LOD 0.005 0.014 1.178
Assay and control of impurities: Assay procedures are intended to measure the analyte present in a given sample. In the context of this document, the assay represents a quantitative measurement of the major component(s) in the drug substance. For the drug product, similar validation characteristics also apply when assaying for the active or other selected component(s). The same validation characteristics may also apply to
assays associated with other analytical procedures (e.g., dissolution). Testing for impurities can be either a quantitative test or a limit test for the impurity in a sample. Either test is intended to accurately reflect the purity characteristics of the sample. Different validation characteristics are required for a quantitative test than for a limit test.
[image:5.612.59.547.190.234.2]The assay data are given in Table 10.
TABLE 10: ASSAY DATA OF FLUOXETINE FORMULATIONS
Formulation Labeled claim
(mg/tab.)
Observed Amount* (+S.D) mg
% Recovery %R.S.D
Prozac 2 1.90±0.063 98.15 0.614
Prodep 2 1.92±0.069 99.45 0.893
Stability studies:
Hydrolytic degradation: Hydrolytic degradation usually means the cleavage of chemical bonds by the addition of water. Generally, hydrolytic degradation or saccharification is a step in the degradation of a substance. This can be performed in three conditions that are neutral medium, acidic medium and basic medium.
Samples were withdrawn according to protocol. From the drawn samples 25μg/ml solution were
prepared and subjected for analysis. The
representative UV-VIS spectrum indicates
degradation after 5 hr at 60oC.
Hydrolytic Degradation in neutral condition:
The neutral degradation data are given in table 11
[image:5.612.59.539.376.694.2]and UV spectrum are shown in Fig. 3.
FIG. 3: UV-VIS SPECTRUM OF FLUOXETINE IN NEUTRAL DEGRADATION TABLE 11: HYDROLYTIC DEGRADATION OF FLUOXETINE IN NEUTRAL CONDITION
Sl. no. Name Absorbance Conc. %Degradation
1 Drug 0.378 15 0
2 Degradation1 0.332 14.58 3.85
3 Degradation2 0.319 13.43 14.25
4 Degradation3 0.268 12.72 16.71
5 Degradation4 0.217 10.98 26.93
Hydrolytic Degradation in Acidic condition: The
acidic degradation data are given in Table 12 and
UV spectrum is shown in Fig. 4.
Hydrolytic degradation in Basic condition: The
basic degradation data are given in Table 13 and
FIG. 4: UV-VIS SPECTRUM OF FLUOXETINE IN ACIDIC DEGRADATION TABLE 12: HYDROLYTIC DEGRADATION OF FLUOXETINE IN ACIDIC CONDITION
S. No. Name Absorbance Conc. %Degradation
1 Drug 0.562 30 0
2 Degradation1 0.496 22.87 28.81
3 Degradation2 0.438 19.54 35.07
4 Degradation3 0.418 17.31 38.28
FIG. 5: UV-VIS SPECTRUM OF FLUOXETINE IN BASIC DEGRADATION Table 13:Hydrolytic Degradation of Fluoxetine in Basic Condition
Sl no. Name Absorbance Conc. %Degradation
1 Drug 0.995 100 0
2 Degradation1 0.926 92.76 9.88
3 Degradation2 0.886 68.94 13.65
4 Degradation3 0.785 30.42 60.53
RESULTS AND DISCUSSION: The objective of
the present work was development and validation of UV spectral study and degradation of Fluoxetine using UV spectrophotometer. The UV Spectra for Fluoxetine were recorded at the wavelength of 216nm (λmax).
ACKNOWLEDGEMENT: The authors are grateful to the Department of the Pharmaceutical Sciences, Birla Institute of Technology for providing the requirements and necessities for the present work. We are also thankful to the La Chemico Pvt. Ltd. for providing us the gift samples of Fluoxetine pure drug.
REFERENCES:
1. Parker G. Beyond major depression. Psychol Med. 2010; 35: 467-474.
2. Erman ME, McCloskey MS, Fanning JR, Schumacher JA, Coccaro EF. "Serotonin augmentation reduces response to attack in aggressive individuals". Psychol Sci. 2009; 20 (6): 714–20.
3. Msterdam JD, Shults J. Efficacy and Safety of Long-Term Fluoxetine Versus Lithium Monotherapy of Bipolar II Disorder: A Randomized, Double-Blind, Placebo-Substitution Study. Am J Psychiatry. 2008; 167(7):792– 800.
4. Deepak S, Jain AK, Gunta S, Sanyal M, Pande UC and Shrivastav P. “Spectroscopic analysis of Fluoxetine in tablet dosage forms.” J. Pharm. Biomed Anal. 2009, 26: 43-52.
5. Hai LZ, Wilson YL, Neil T. Fluoxetine: An overview of spectral data. Int. J. Chem Tech Res 2010; 2 (2): 1141-46.
All © 2014 are reserved by International Journal of Pharmaceutical Sciences and Research. This Journal licensed under a Creative Commons Attribution-NonCommercial-ShareAlike 3.0 Unported License.
This article can be downloaded to ANDROID OS based mobile. Scan QR Code using Code/Bar Scanner from your mobile. (Scanners are available on Google Playstore)
How to cite this article: