IMPLEMENTATION
OF
MULTIMEDIA
BASED
GRAPH
COLORING
LEARNING
MODEL
1
MUHAMMAD RUSLI, 2HADISUTOPO
Institut Teknologi dan Bisnis Kalbis, Information Systems Department, Indonesia
E-mail: [email protected], [email protected]
ABSTRACT
This research is intended to implement a Graph Coloring Learning Model for a Discrete Mathematics course. This learning model should encourage student’s ability to integrate all information resources from CD-ROM to learn Graph Coloring. The learning model focuses on how learners can learn graph coloring according to the instructions in the CD-ROM. Each lesson is provided with a step-by-step instruction for doing specific task. Learners can follow the tutorial from beginning to the end, or do only the lessons that correspond to their interests and needs. This is a descriptive case study with informatics students at a university as the subject. The data is analyzed using the analytic descriptive method and obtain findings that the learning model can affect the delivery of education and enable wider access to be the complement of learning process. Based on the research findings, the learning model can be used by students and motivate them to learn discrete mathematics.
Keywords: Model; Multimedia; Graph; Learning Model
1. INTRODUCTION
Learning is “self-generating”, that makes by itself, human learn to enhance for better life, and motivate to grow and develop time by time [1]. Most of the learning in all departments are held as a passive learning, that lecturers and instructors explain the subject, while the students are listening and watching the presentation. The conventional learning process indicate that student activities are less than the decided learning outcome, and the students have a limited activity and creativity [2].
Discrete Mathematics course can be chosen by students after finishing some prerequisite courses as Calculus, Algorithm and Programming. A topic of Discrete Mathematics is Graph Coloring, which is held in the 10th class meeting of the whole 15 class meetings in a semester. Graph learning is conducted as theoretical learning that consists of Introduction to Graph, Graph Representation in Matrix, Tree, and Labeled Graph. Hence, Graph Coloring application was developed as an output of the previous phase of this research. According to lecturers who teach Discrete Mathematics, student learning outcome for several semesters is low. Increasing the student learning outcome, it is important to develop an application of discrete mathematics visualization that can be used for learning assistance by lecturers in class.
[image:1.612.323.512.552.703.2]This research has been conducting using Research and Development (R&D) according to Borg and Gall [3], which consists of ten following stages: (1) Research and Preliminary Information Collecting; (2) Planning; (3) Developing Preliminary Product; (4) Preliminary Field Testing; (5) Preliminary Product Revision; (6) Main Field Testing; (7) Operational Product Revision that produce learning tutorials on CD-ROM and can be used by students to learn Graph Coloring; (8) Operational Testing; (9) Final Product Revision; and (10) Dissemination and Implementation.
This research covers only seven phases, in accordance with the needs of the Discrete Mathematics course material, and has been conducted through 5 steps with the Graph Coloring model as the research product. Graph Coloring application is developed as a tutorial that can be used by students as resource learning wherever and whenever they learn. The application uses pictures or the others that represents the graph coloring, as can be seen in Figure 1, Figure 2, Figure 3, Figure 4, and Figure 5.
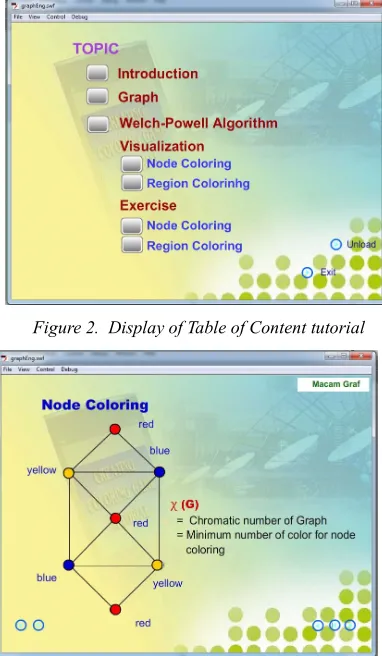
[image:2.612.322.514.191.352.2]
Figure 2. Display of Table of Content tutorial
Figure 3. Display of Node Coloring visualization
In order having a succesfull research in relations with the problem, there are several research question:
- Can student use Graph Coloring Learning Model application on any environment or infrastructure?
- Can Graph Coloring Learning Model be used by student easily as self learning resource?
- Does student learning outcome increase after they have learned using Graph Coloring Model?
[image:2.612.97.292.242.397.2]- Does lecturer feel that computer visualization is important to use in learning process?
Figure 4. Display of Node Coloring
The objective of the research is to obtain an effectiveness of graph coloring visualization in a learning model as a complement of learning resource. Visualization is a technique of computer graphics for creating images, diagrams, or animations to communicate a message. Scientific data is often complex, and the relationship among variables might be difficult to visualize. Graphics provide the tools for presenting scientific information that can be easily displayed and understood [4]. Visualization has an advantage in education institutions either in distance learning or in blended learning, and due to the paradigm of learning which is from student-centered learning [5].The learning model in the CD-ROM is used by students after they have learned in class.
[image:2.612.95.286.245.573.2] [image:2.612.324.515.557.710.2]The prior research was developing multimedia application especially puzzle game learning model. The learning model informed student how to create puzzle game by using resources in a CD-ROM. The research stated that multimedia based learning model could increase student’s ability to learn by him/herself and develop multimedia application. Multimedia based learning model could be used by students anywhere and anytime they wanted [6].
2. RESEARCH METHOD
Descriptive case study is used to describe how the learning model can be used by students and they understand all the topic of discrete mathematics after they have learned. There is a view that aspects of individual attitude and belief are the main influence factors in using multimedia technology. Zhao and Cziko urgued that: (1) Lecturers should believe that use of the technology can more effectively meet learning objectives or reach a high level goal; (2) by using the technology, other goals perceived as more important are not dislodged; and (3) the lecturers must feel that he/she has the confidence, ability and access to necessary resources to apply the technology in teaching situation [7].
2.1 Research Focus
The focus of this research is fitting the needs of students and lecturers to support learning. The details of the problems are: (1) Is the learning material complete? (2) Is the tutorial easy to be understood by students? (3) Is the tutorial easy to be used? Is there any information or learning resources that useful for learning? This research is conducted in information system department of a university during Mathematics Course is held in a semester.
2.2 Research Process
The process of research is divided into three phases, with the goal to address some potential pitfalls uncovered in the needs assessment. The research consist of 3 phases: (1) Phase 1:
Preparation. In this phase, lasting approximately
two months, developing CD-ROM of the graph coloring visualization learning model. The researcher shows to the lecturers how to use materials in the CD-ROM to create an attractive learning in classroom; (2) Phase II:
Implementation. The process in the second phase is
implementation, lasting approximately 2 months, consists of: (a) Course Delivery: The lecturers will use CD-ROM to deliver learning in class with
between 45 and 100 students. Students can learn graph coloring by themselves anywhere and anytime; and (b) Course Evaluation: After an initial round of courses, the lecturers make the assessment as part of final test; and (3) Phase III:
Closing: The process in the third phase, that is
lasting one month, consists of data analyzing and report making.
2.3 Instrument and Data Collecting
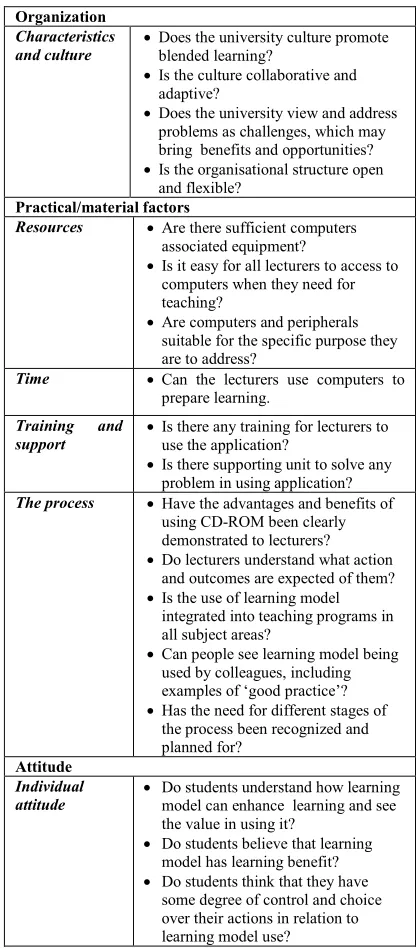
Table 1. Framework of graph coloring learning model implementation
Organization
Characteristics
and culture •
Does the university culture promote blended learning?
•Is the culture collaborative and adaptive?
•Does the university view and address problems as challenges, which may bring benefits and opportunities? •Is the organisational structure open
and flexible?
Practical/material factors
Resources •Are there sufficient computers associated equipment?
•Is it easy for all lecturers to access to computers when they need for teaching?
•Are computers and peripherals suitable for the specific purpose they are to address?
Time •Can the lecturers use computers to prepare learning.
Training and
support •
Is there any training for lecturers to use the application?
•Is there supporting unit to solve any problem in using application? The process •Have the advantages and benefits of
using CD-ROM been clearly demonstrated to lecturers? •Do lecturers understand what action
and outcomes are expected of them? •Is the use of learning model
integrated into teaching programs in all subject areas?
•Can people see learning model being used by colleagues, including examples of ‘good practice’? •Has the need for different stages of
the process been recognized and planned for?
Attitude
Individual attitude
• Do students understand how learning model can enhance learning and see the value in using it?
• Do students believe that learning model has learning benefit? • Do students think that they have
[image:3.612.311.521.243.717.2]Graph Coloring Learning Model is conducted in the research subject with some instrument. Questionnaire and interview are the tools that used in data collecting during the research, as can be seen in Table 1, with the description: (1).
Questionnaire. It uses open-ended question to
obtain the useful information in order supporting theory. The information is important for the model development, including the facilitating the model in learning process, the ease of the model to be learned by students, and evaluate the quality of the model; (2). Interview. Interview is conducted during the research with open-ended questions, hence the researcher can explore the information from respondents deeply. Deep interview is important to obtain data about the graph coloring learning process. The interviews are transcribed and store as a text document; (3). Observation. In order to obtain accuracy of the research, researcher should observe the learning process in class, while lecturer is interacting with students, and researcher focuses on watching the learning activities; and (4).
Assignment. Assignment should be done by
students consists of introduction to graph, directed graph, non directed graph, and graph representation using matrix, trees and labeled graph.
2.4 Instrument outlines
The quality of Graph Coloring Learning Model is measured in three categories namely Content of Learning, Multimedia Object, and Link and Access as can be seen in Figure 6 [8]. Content of Learning is evaluated according (1) the sequencing of the learning content, hence the sequence of learning that is organized well, can be understood by students easily; (2) scope of learning, the completed scope can make the ease of learning to be implemented and the students obtain whole topics without trying to find another learning resources; (3) easy to use, the content of the learning model is understood easily by students, so that they are interested in graph coloring learning.
Multimedia object has four types, that are text, images, audio, and video. Text of multimedia application should: (1) fit with the content, whether the text supports the discussed topic; (2) typography includes type styles and type faces must be easy to be read and correspond to design principle; (3) text color, the color of text in harmony design that is combining with other components of design; Image of multimedia application should: (1) fit with the content, that means in association with the context and support the discussed topic; (2) image quality indicates the good quality of images when they are presented in
[image:4.612.314.519.279.452.2]display devices; Audio that is used in multimedia application should (1) be correct, clear in pronunciation without any mistake corresponding with the learning content; (2) voice disorders, is there any noise that disturbs the user concentration; (3) music, using music in learning can create convenient for the students, but it can disturb their concentration, so it should be careful to develop the application. Video that is used in multimedia should (1) correspond to the topic of learning; (2) make the learning to be clear and easy to be understood, and of course it encourages students to learn by themselves; (3) synchronize between video and audio.
Figure 6. Criteria of product qualty measurement of graph coloring
Link and access in multimedia application should be evaluated according (1) easily searching, button and hotword can be used in searching; (2) correctness of the link; (3) fast, button or hotword links to the topic.
2.5 Data validation
2.6 Data Analysis Technique
According to Creswell [9], the technique in data analyzing for qualitative data consists of seven steps. The steps can be described as: (1) Researcher collects data, such as questionnare, interview, notes and the other; (2) Preparing data to be analyzed, including the questionnaire interpretating, interviews, notes, other information resources, and creating data categorization; (3) Read carefully the whole data roughly, and find the respondent opinion; (4) Detail analyzes through the coding process; (5) Coding process is conducted to obtain research description; (6) Displaying the findings interactively, so that it is communicate, such as the form of chart, table, and diagram.; (7) Data analyze is conducted in integrated activity.
Summerizing the development research is based on the comment and purpose that the students and lecturers corrected to be revised to enhance the learning model. The main factors to evaluate the model effectivity as the ease of using model, so that the students can learn graph coloring by themselves.
3. RESULTS AND DISCUSSION
Learning was the process which students interact with lecturer and resource learning. Lecturer used Graph Coloring Model to assist his or her teaching in class. After learning in class, students could overview the topic that they had learned at home using the material of learning in the CD-ROM. The results presented here provide an overview of the way each respondent to the matters of the Graph Coloring Learning Model, and their learning outcome of Discrete Mathematics that they had learned.
3.1 Questionnaire data
The respondents who fill the questionnaire in each class represented a balanced range of subject areas and experience. The students had similar characteristic, and were at the sama level of study. There were 47 students who learned in class A and 9 students in class B.
3.2 Quality of Graph Coloring Learning Model
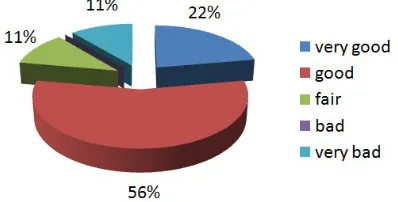
The questionnaire data showed that at least 67% of students in each class said that Graph Coloring Learning Model is good, it means 88% students in class A and 67% students in class B. 6% students in class A and 22% students in class B said that it was very good. 6% students in class A and 11% students in class B said that it was fair. None of the
[image:5.612.316.519.148.263.2]students in all class said that it was bad or very bad. The data were visualized in Figure 7 and Figure 8.
Figure 7. Chart of evaluation by respondents in class A
Figure 8. Chart of evaluation by respondents in class B
3.3 Assessment of student's competency
The questionnaire data show that at least 51% of students in each class gain good competency, it means 51% students in class A and 56% in class B. 17% students in class A gained very good competency, 22% students in class B gained very good competency, 23% students in class A gained fair competency, 11% students in class B gained fair competency, 9% students in class A gained bad competency, 11% students in class B gain bad competency. The findings of the reseach show that not more than 11% students in both class A and class B were incompetent as can be seen in Figure 9 and Figure 10.
[image:5.612.316.519.313.424.2]Figure 9. Chart of student’s assessment in class A
Figure 10. Chart of student’s assessment in class B
Each lecturer has very different expectations, requirements and facilities in their everyday practice; use of computer is just one aspect of this. The studies reveal the different approaches, expectations, resourcing, and support structures in each class before overlaying each individual lecturer’s own beliefs, attitudes and practice. It is clear that computer fits in with and supports whole class priorities as well as the specific process and systems put in place for Graph Coloring Learning Model implementation. The practice of educational technology is the extent to which such work may be part of the development of theory [10]. In order to adopt a change to current practice such as Graph Coloring Learning Model implementation, a well-motivated students have been shown to be as the benefit of multimedia use in the classroom and this was evident in the case studies. The Graph Coloring Learning Model has motivate students to increase their learning. It was also noted that a highly visible and open management structure and high expectations of lecturers.
The benefit of multimedia using multimedia is as have been stated by Roblyer & Doering, technology when properly implemented can motivate students. The advantage of using
technology are gaining student attention, supporting manual operations, ilustrating real-world that is relevant to the learning, engaging student through production work, concentrating students with audiences for their writing, engaging students through real world-situations, and providing support for working coorporatively [11].
As lecturers begin to use Graph Coloring Learning Model themselves, and to see its use around them, their understanding of resource needs is clearer, and they can articulate this with more clarity. In order to embed Graph Coloring Learning Model effectively into teaching practices, lecturers need flexibility and ease of access to the relevant equipment, including software and peripherals. In this case, CD ROM that contained of Graph Coloring Learning Model was distributed to every student and lecturer in class A and B.
4. CONCLUSION
Graph Coloring Learning Model for learning refers to the development of information and communications technology specifically for learning purposes, while the Graph Coloring Learning Model in education involves the adoption of general components of information and communication technologies in the learning process.
The adoption and use of Graph Coloring Learning Model in Discrete Mathematics learning have a positive impact on learning and research. Graph Coloring Learning Model can affect the delivery of education and enable wider access to be the complement of learning resources. Student learning outcome has increased after using Graph Coloring Learning Model. It means that the application motivates student in learning how to understand graph coloring.
4.1 Further research
Graph Coloring Learning Model in Discrete Mathematics in CD-ROM is used by student by running the CD-ROM on their computer. Mobile technology has been developed rapidly, so the application should be run on smartphone that can be used by students anywhere and anytime they do.
5. ACKNOWLEDGEMENTS
[image:6.612.93.292.295.396.2]REFERENCES:
[1] C.R. Semiawan, Landasan Pembelajaran
dalam Perkembangan Manusia, Centre of
Human Competency Development, Jakarta, 2007, pp. 1-2.
[2] Č. Monika, “Analysis of Perceptions of Conventional and E-Learning Education in
Corporate Training”, Journal of
Competitiveness. Vol. 5, Issue 4, pp. 73-97,
(2013). ISSN 171X (Print), ISSN 1804-1728 [On-line], DOI: 10.7441/joc.2013.04.05. pp. 73-97. [Online]. Available in http://www.cjournal.cz/files/152.pdf.,
Accessed on April 12, 2016.
[3] W.R. Borg and M.D. Gall. Educational Research. New York: Longman, 1989, pp.784-785.
[4] D. Hearn and P. Baker, Computer Graphics C
Version, 2nd edition, Prentice Hall
International, Inc., Upper Saddle River, NJ, pp. 25-33.
[5] Sfenrianto, “A Model of Adaptive E-Learning System Based on Student's Motivation”, Proceedings of ICCIT-09: Internatioal Conference on Creative Communication and
Innovative Technology, Tangerang, Indonesia,
2009, pp. 133-138.
[6] H. Sutopo, “Learning Model Development of Creating a Multimedia Application Particularly Puzzle Game”, Proceedings from The 17th Imnternational Conference on Computational Science and Engineering
(CSE-2014), Chengdu, China, pp.432-437
December, 19-21, 2014, pp. 432-437, IEEE Expore Digital Library. [Online]. Available in http://ieeexplore.ieee.org/xpl/articleDetails.jsp ?arnumber=7023617&newsearch=true&searc hWithin=%22First%20Name%22:hadi&searc hWithin=%22Last%20Name%22:sutopo. Accessed on April, 20, 2015.
[7[ P. Baxter and S. Jack, "Qualitative Case Study
Methodology: Study Design and
Implementation for Novice Researchers", The
Qualitative Report. Vol. 13 No. 4, 2008, pp.
544-559, [Online] Available in
http://www.nova.edu/ssss/QR/QR13-4/baxter.pdf, Accessed January 23. 2016. [8] A.H. Sutopo, Teknologi Informasi dalam
Pendidikan, Yogyakarta: Graha Ilmu, 2012,
106.
[9] J.W. Creswell, Research Design: Qualitative
& Quantitative Approaches, Sage
Publications, Inc., London, 2005, pp. 244-248.
[10] E. Scanlon, “Technology Enhanced Learning in Science: Interactions, Affordances and Design Based Research”, Journal of
Interactive Media in Education. 2010, 2,
p.Art. 8. DOI: http://doi.org/10.5334/2010-8. [11] M. D. Doblyer & A. H. Doering, Integrating
Educational Technology into Teaching,