1551
TRANSMISSION EFFICIENT PROTOCOL USING
POPULATION-BASED META-HEURISTIC TECHNIQUE
WITH MOBILE SINK FOR LIFETIME ENHANCEMENT OF
HETEROGENEOUS WIRELESS SENSOR NETWORKS
A.KARTHIKEYAN1, DR.T.SHANKAR2.
1Assistant Professor (Sr), SENSE VIT Vellore, Tamil Nadu, India 2Associate Professor, SENSE VIT , Vellore, Tamil Nadu, India 1,2School of Electronics Engineering,VIT , Vellore, Tamil Nadu, India
E-Mail: [email protected],[email protected]
ABSTRACT
Wireless sensor Networks are small sized devices which work on the small batteries which cannot be recharged again, due to this optimization of battery resources are the most important design criteria for wireless sensor networks A hybrid algorithm incorporating social insect colony and double cluster head approach, with improved Mobile Balanced Energy Efficient Network Integrated is proposed to improve the intra and inter cluster organization of the existing four level heterogeneous wireless sensor networks. The social insect colony algorithm reduces the energy loss due to long distance transmission within the cluster by introducing layered multi hop transmission. The double cluster head approach helps in load balancing. The burden of the cluster head is shared by the vice cluster head which will reduce the energy loss in cluster heads due to long distance transmissions. The proposed algorithm increases the life time, throughput and stability of the network by reducing the energy losses due to long distance transmissions.
Keywords: Mobile Sin, Heterogeneous, Social Insect Colony Clustering, Routing, Energy Efficient,
BEENISH, Ibeenish, Imbeenish
1. INTRODUCTION
Wireless sensor network is a collection of nodes powered by a limited battery supply. These nodes are used for sensing data in places, remote and inaccessible by humans. These nodes form a network and transfer the sensed data to the base station by co-ordinating with each other. These nodes are independent and can survive without any centralised coordination in most scenarios. These nodes undergo energy losses due to various factors such as energy spent on sensing, processing, transmission and reception of data [1] [2]. Since these nodes’ batteries cannot be recharged, it is important to conserve their energy and extend their lifetime. The sensor nodes also should coordinate with each other so that they can route data efficiently and also reduce the redundancy in data transferred by aggregating similar data from nearby nodes. The standard communication and routing algorithms fail to work efficiently with the wireless sensor networks as they are independent, de-centralized and do not have sophisticated hardware and framework support to incorporate the conventional algorithms. Though they are similar to
MANETs, WSNs have strict energy constraint [3][4][5]which is not in the case of MANET as its mobile devices are rechargeable. This led to the development of algorithms unique for wireless sensor networks. These algorithms are designed to reduce the energy consumption by establishing protocols for sensing, aggregation, transmission and routing of data. Several of these algorithms are discussed in the next section. The Objectivity of the proposed work is to enhance the lifetime of heterogeneous wireless sensor network by optimising the battery usage of the nodes with the implementation of the hybrid proposed work in the network.
2. LITERATURE REVIEW
1552 redundancy of data transferred by aggregating the data of nodes within the cluster, at the cluster head. The absence of redundancy had helped in the conservation of node energy as the no of packets to be transferred is less, thereby extending the lifetime of the network. Though many clustering algorithm existed before LEACH, the dynamic selection of cluster head based on probability and dynamic cluster formation made LEACH popular. The leach used random unique IDs and a probabilistic method to elect cluster heads which prevented the nodes from a single location being selected as cluster head, thereby making the network stable. The LEACH had its fair share of disadvantages. The algorithm did not consider heterogeneity among nodes. It assumed that all nodes are of equal energy. But, this is not always true as few nodes might be deployed with higher energy and/or at later stage of the network to extend the network lifetime. The ‘stable election protocol’ [7] (SEP) overcame the drawbacks of LEACH by introducing a 2 level heterogeneity. It categorized nodes into normal and advanced nodes based on the initial energy of the nodes.
It had similar cluster head selection and clustering approach as that of LEACH except for that the different types of nodes had different election probability. The advanced nodes had more probability of getting selected as cluster heads and also were more frequently selected when compared to the normal nodes. This was done to prevent the normal nodes from getting elected as cluster heads frequently and dying out while the advanced nodes lived longer. The network stability was prioritized over the life of individual nodes. The SEP performed better than the LEACH in heterogeneous scenario. The ‘threshold sensitive stable election protocol’ [8] (TSEP) is improvised over the SEP. TSEP considers 3 level of heterogeneity – normal, intermediate and advanced nodes. The advanced nodes have the highest election probability as cluster head, followed by intermediate nodes. The normal nodes have the least probability to be elected as cluster heads and were least frequently selected as the cluster heads.
It had similar cluster head selection and clustering approach as that of LEACH except for that the different types of nodes had different election probability. The advanced nodes had more probability of getting selected as cluster heads and also were more frequently selected when compared to the normal nodes. This was done to prevent the normal nodes from getting elected as cluster heads frequently and dying out while the advanced nodes lived longer. The network stability was prioritized over the life of individual nodes. The SEP performed better than the LEACH in
heterogeneous scenario. The ‘threshold sensitive stable election protocol’ [8] (TSEP) is improvised over the SEP. TSEP considers 3 level of heterogeneity – normal, intermediate and advanced nodes. The advanced nodes have the highest election probability as cluster head, followed by intermediate nodes. The normal nodes have the least probability to be elected as cluster heads and were least frequently selected as the cluster heads. Another feature of the TSEP was, it was a reactive protocol. It had a hard and a soft threshold. Nodes initially transmitted data when the sensed value was more than the hard threshold, later the nodes transmitted only when the difference between the current sensed and previous sensed values was greater than the soft threshold. This led to a higher network life time when compared to SEP as the no of packets to be sent was drastically reduced. The major drawback of all the three algorithms considered so far was that they did not take into consideration, the residual energy of the node. This meant that there was a chance that a node with low energy might get elected as a cluster head leading to its death and network instability at that location as the data from the cluster members is lost without reception.
1553
super heterogeneous protocol [11] introduces a mobile sink approach in the existing BEENISH and
iBEENISH protocols leading to mobile BEENISH and improved mobile BEENISH. The MBEENISH and iMBEENISH protocols have similar methods for cluster head election, cluster formation and data transmission methods as their counter parts BEENISH and iBEENISH with only difference being the additional mobile sink. The protocols find low energy cluster heads and fix their coordinates as sink locations. For each round the mobile sink visits these sink locations and collect the data from these cluster heads. The cluster heads whose locations are not sink locations transmit their data to the nearest sink location when the mobile sink visits that location. After the collection of data the sink returns to its original location. The MBEENISH and the iMBEENISH protocols have drastically increased network lifetime and throughput when compared with the BEENISH and iBEENISH protocols.
The social insect colony [12] is a meta-heuristic protocol inspired from the organizational behaviour of social insects like bees and ants [13][14]. The nodes are given a unique ID. The nodes make a random back off based on their unique ID and residual energy. A node after its back off time announces itself as cluster head and the nodes within a pre-determined range become their cluster member and turn off their clocks. If a node is not a member after its back off time it again announces itself as cluster head and the nodes within the pre-determined range become the cluster members. This continues until all nodes are part of a cluster. The clusters are then divided into concentric layers and each node is given a layer number based on the layer to which it belongs. The nodes in the outer layer find a parent in the inner layer. The parent in the inner layer receives data from all its children, aggregates them along with its own data and sends to its parent. This continues till the data reaches the cluster head in layer zero which transmit the data to the base station.
In paper [15], double clustering approach for load balancing is discussed. This paper proposes the election of a vice cluster head after the cluster formation. This is done so that the burden of the main cluster head is reduced. Conventionally the main cluster head is over burdened with data reception, aggregation and transmission to base station. In the double cluster head approach the load is balanced between the main and the vice cluster head as the main cluster head receives and aggregates the data, while the vice cluster head does the long distance transmission to the base station. The vice cluster head is decided among the nodes, based on a cost function which takes into consideration, the distance of the node from the
cluster head and also the residual energy of the node. The node with the highest cost value is chosen as the vice cluster head. The cluster head thus selected receives the aggregated data from the main cluster head and transmits to the base station[16]
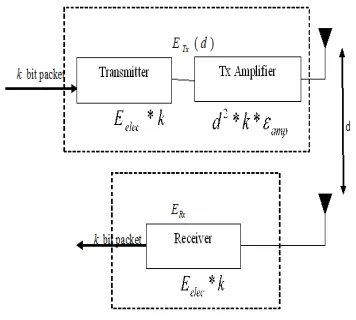
3. FIRST ORDER RADIO DISSIPATION MODEL
The first order radio model as discussed in [1] gives the standard for energy dissipation due to various losses which is given in figure 1 below:
Figure 1: The First Order Radio Model.
The energy spent in data transmission is given by equation (1):
(1) The energy spent in data reception is given by equation (2):
(2) The L is the number of bits per packet, the d is the distance of propagation of the transmitted signal and d0 is the threshold distance. The various energy
[image:3.612.323.501.239.399.2]dissipation parameters and their costs are given in table I below:
TABLE I. Energy Cost Parameters
Parameter Value
E0 (initial energy) 0.5 J
L (Message size) 4000 bits
Eelec (energy for Tx and
Rx)
50 nJ/bit
1554
Eamp 0.0013 pJ/bit/m4
EDA (aggregation cost) 5 nJ/bit/signal
d0 (threshold distance) 70 m
4. FOUR LEVEL HETEROGENEITY MODEL
In the four level heterogeneity model the nodes are divided into ultra-super, super, advanced and normal nodes based on their initial energy [17]. The energy of ultra-super, super and advanced nodes are increased by a factor of u, b, a respectively. If E0 is the initial energy of a normal node, the initial energy of advanced nodes is given by E0*(1+a), the initial energy of super nodes is given by E0*(1+b) and the initial energy of ultra-super nodes is given by E0*(1+u). The ratio of number of advanced nodes to total number of nodes is m, the ratio of number of super to advanced nodes is m0 and the ratio of number of ultra-super nodes to super nodes is m1.[18][19]
5. PROPOSED ALGORITHM
The proposed algorithm incorporates the social insect colony algorithm in the iMBEENISH to improvise the intra-cluster organization. The proposed algorithm also incorporates the double cluster head approach to reduce the over-burdening of the cluster head by balancing the load between main and the vice cluster head. The algorithm begins with the deployment of node in the field and assignment of unique ID. The nodes are divided into 4 types: ultra-super, super, advanced and normal based on their initial energy. After deployment, the protocol begins with the calculation of the average energy of the network which is given by equation (3).
R r total E N r
E( ) 1 1 (3)
Where N is the number of nodes in the network, Etotal is the total energy of the network, r is
the current round number and R is the optimal number of rounds. The optimal number of rounds is given by equation (4).
round total
E E
R (4)
Where Eround is the total energy consumed
during one round and is given by equation (5).
) 2
( elec DA mp toBS4 fs toCH2 round L NE NE k d N d
E
. (5)
L is the number of bits per message, dtoBS is the
optimal distance from a cluster head to base station, dtoCH is the optimal distance from a node to a cluster
head and k is the optimal number of cluster head which is given by (6) & (7).
k M toCH d M toBS d 2 2 765 . 0 (6) (7)
M is the dimension of the sensor field. Once the optimum values are calculated, the probability Pi of each node to be elected as cluster
head is given by equation (8).
) ( )))) ( ( ( 1 ( ) ( ) 1 ( ) ( )))) ( ( ( 1 ( ) ( ) 1 ( ) ( )))) ( ( ( 1 ( ) ( ) 1 ( ) ( )))) ( ( ( 1 ( ) ( ) 1 ( ) ( )))) ( ( ( 1 ( ) ( 1 0 1 0 1 0 1 0 1 0 r E u b m b a m a m r E p u c r E u b m b a m a m r E u p r E u b m b a m a m r E b p r E u b m b a m a m r E a p r E u b m b a m a m r E p p i opt i opt i opt i opt i opt i ‐‐ (8)
The first four probability equations are of the normal, advanced, super and ultra-super nodes respectively. The fifth equation is for the high energy nodes whose energy has fallen below threshold energy Tabsolute. Tabsolute = Z*E0 and E0 =
0.71.
After the probability calculation, the threshold Ti is calculated as given by equation (9) below:
0 1 mod . 1 i i ii p r p
p
s
T (9)
1555 CHs are elected, the other nodes become the cluster member of the closest CH. The clusters formed are divided into concentric layers.
The layer radii are given by equation (10) & (11).
com
k k
r b b
1
0
k
0
(10)
Otherwise
2
2 2 2
1 1
_
k
kk
b
b
b
(11)
Where bk is the radius of the kth layer. rcom is
the radius of communication, which is chosen initially. After dividing the cluster into concentric layers, each node is given a layer number LN based on the layer to which it belongs. The cluster head is in the inner most layer with the layer number zero. The nodes in the outer layer select a parent in the inner layer by transmitting an LCP for a range of rcom. If no parents are found in that region, the
radius of communication is increased and LCP is again sent. Once a parent in the inner layer accepts the LCP it transmits an acknowledgement. Thus a parent-child link is established. The nodes transmit their sensed data to their parent. The parent aggregates data from all its children with its own data and transmit to its parent. This continues until all the packets reach the cluster head.
[image:5.612.89.283.182.289.2]
Figure 2. Intra-Cluster Organization
Figure 2 depicts the intra cluster organization of nodes pictorially, where the data is transmitted from child to parent until it reaches CH.
The 5 cluster heads with least energy are chosen as sink locations. The mobile sink visits these locations and receives the data from the cluster heads. The cluster heads whose coordinates are not sink locations elect a vice cluster head. This helps in load balancing as the vice cluster head reduces the burden of main cluster head by doing the long distance transmission. The vice cluster head is elected from the cluster members based on the cost function given by equation (12) below:
dist dist energy
res energy res Cost
max_ 1 ) 1 ( _
max_ _
(12)
Where ‘res_energy’ is the residual energy of node under consideration, max_res_energy is the residual energy of the node with maximum energy, dist is the distance from the node to cluster head, max_dist is the distance from the farthest node in cluster to the cluster head and ε is the weightage parameter, which can be modified. The node with the highest cost will be elected as the vice cluster head. The vice cluster head receives the data from main cluster head and transmits to the mobile sink when it arrives at the nearest sink location [20][21][22].
[image:5.612.107.520.489.717.2]
1556 Figure 3 shows the path of the mobile sink. The sink visits the nearest unvisited sink location. Once it receives data from that location, it visits the next nearest unvisited location. [23] This repeats until all the sink locations are visited. The mobile sink then reaches its original location. Figure 3 also shows vice cluster heads elected in cluster whose cluster heads are not in sink location. The vice cluster head transmits to sink when it arrives at nearest sink location. Once the sink returns to its original location the next round starts with the election of CHs. This continues until the last node is dead [24].
6. SIMULATION RESULTS.
The algorithm was designed in matlab 2013a and was simulated for scenarios 100x100 m2 area with
100 nodes and 200x200 m2 area with 200 nodes.
For the simulations we consider the energy factors a=2, b=2.5 and u=3. The ratios of node heterogeneity are m=0.6, m0= 0.5 and m1 =0.3. The radius of communication rcom is 1.5m and the
weightage parameter ε is chosen as 0.5.
The graphs in figure 4 and figure 5 shows the number of alive nodes vs. round number plot for 100x100 with 100 nodes and 200x200 with 200nodes.
[image:6.612.325.523.119.281.2]
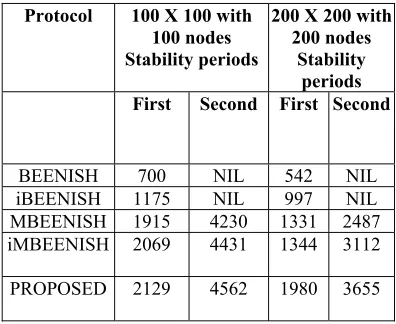
The graphs show that the proposed algorithm out performs the existing algorithms in terms of first node death, second stability period and last node death in both the scenarios. The results from the graph are summarised in the table II below.
TABLE II. Stability Periods (Number Of Rounds) Of Protocol
It can be observed from the table that the proposed algorithm has the highest first and second stability period in both scenarios. The following two bar graphs show the throughput of the algorithms for both scenarios.
[image:6.612.319.522.367.518.2][image:6.612.92.297.482.618.2]
Figure.5. Alive nodes vs. Round Number For 200x200 With 200 Nodes
Figure.4.Alive Nodes vs. Round Number for 100x100 With 100 Nodes
Protocol 100 X 100 with 100 nodes Stability periods
200 X 200 with 200 nodes
Stability periods First Second First Second
BEENISH 700 NIL 542 NIL
iBEENISH 1175 NIL 997 NIL
MBEENISH 1915 4230 1331 2487
iMBEENISH 2069 4431 1344 3112
1557
Figure 6. Throughput (packets to BS) Of Algorithms For 100x100 With 100 Node
Figure 7. Throughput (Packets To BS) Of Algorithms For 200x200 With 200 Nodes
The figure 6 and figure 7 show that the proposed algorithm has the highest throughput in both scenarios. The table III below summarizes the two figures.
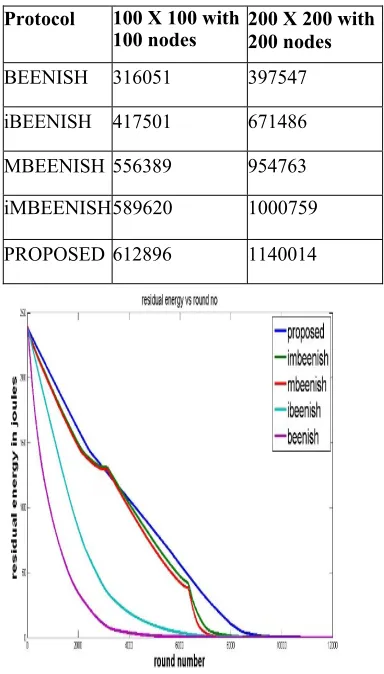
The proposed algorithm outperforms the existing algorithm in terms of throughput for both scenarios. Figures 8 and 9 show the residual energy of networks after each round for 100X100 with 100 nodes and 200X200 with 200 nodes scenario respectively.
Figure 8 . Residual Energy vs. No Of Rounds For 100X100 With 100 Nodes Scenario
[image:7.612.95.293.327.482.2][image:7.612.331.523.346.683.2]
TABLE IV. Throughput Of Algorithms For Both Scenarios
Figure 9. Residual Energy vs No Of Rounds For 200X200 with 200 Nodes Scenario
Protocol 100 X 100 with
100 nodes 200 X 200 with 200 nodes BEENISH 316051 397547
iBEENISH 417501 671486
MBEENISH 556389 954763
iMBEENISH589620 1000759
[image:7.612.331.523.349.682.2]1558 It can be observed from figure 8 and 9 that the proposed algorithm has highest residual energy for a given round always in case of 100 X 100 with 100 nodes scenario and for 94.16% of the network lifetime for the 200X 200 with 200 nodes scenario.
Throughput of the Network
[image:8.612.323.523.62.246.2][image:8.612.105.281.189.350.2]
Figure 10. Throughput vs. Number Of Rounds For Area 100×100 m2 With 100 Nodes
[image:8.612.334.518.306.479.2]Figure 11. Throughput vs. Number Of Rounds For Area 100×100 m2 With 100 Nodes.
Figure 12. Throughput vs. Number of Rounds for Area 200×200 m2 With 200 Nodes
Figure 13. Throughput vs. Number Of Rounds For Area 200×200 m2 With 200 Nodes
Table IV. Throughput After 12000 Rounds.
Protocol 100x100 with 100 nodes
200x200 with 200 nodes
BEENISH 316051 397547 iBEENISH 417501 671486 MBEENISH 556389 954763 iMBEENISH 589620 1000759
[image:8.612.126.279.390.568.2] [image:8.612.321.518.555.703.2]1559 Form figure10, figure11, figure12, figure13 and Table IV it can be observed that the proposed algorithm has 10.1 % more throughput when compared to MBEENISH [11] and 3.9% more throughput when compared to iMBEENISH [11] in 100 x 100 with 100 nodes scenario.
The proposed algorithm has 19.4 % more throughput when compared to MBEENISH [11] and 13.9% more throughput when compared to iMBEENISH [11] in 200 x 200 with 200 nodes scenario.
The analysis of throughput of the network for these different areas shows that the proposed algorithm performs best among all the other protocols. Increasing the area of region decreases the rate of residual energy dissipation in the proposed algorithm while in the previous protocols, the rate of residual energy dissipation increases with increase in area
7. CONCLUSION
The proposed algorithm overcomes the drawbacks of the existing algorithms by incorporating social insect colony algorithm and double cluster head approach for intra cluster organization and load balancing respectively. The proposed algorithm has 11.1 % more primary stability period when compared with MBEENISH and 2.8 % more primary stability period when compared with iMBEENISH. The proposed algorithm has 7.8 % more secondary stability period when compared with MBEENISH and 2.9 % more secondary stability period when compared with iMBEENISH. The analysis of the network lifetime for the two different scenarios show that the proposed algorithm has higher primary and secondary stability periods than BEENISH [4], iBEENISH [5], MBEENISH and iMBEENISH [6] protocols.
The proposed algorithm has 10.1 % more throughput when compared to MBEENISH [6] and 3.9% more throughput when compared to iMBEENISH [6] in 100 x 100 with 100 nodes scenario. The proposed algorithm has 19.4 % more throughput when compared to MBEENISH [6] and 13.9% more throughput when compared to iMBEENISH [6] in 200 x 200.with 200 nodes scenario. The analysis of throughput of the network for these different areas shows that the proposed algorithm performs best among all the other protocols
From these comparisons it can be concluded that the proposed algorithm is better than the existing algorithm in terms of network lifetime, stability and throughput. Future scope of this work
could be more hybrid metaheuristic techniques and higher heterogeneity in the sensor network.
REFERENCES
[1] VN Talooki, J Rodriguez, H Marques, Energy efficient and load balanced routing for wireless multihop network applications. Int. J. Distributed Sensor Netw. 2014(13), article ID 927659 (2014). doi:10.1155/2014/927659 [2] MA Hamid, MM Alam, MS Islam, CS Hong, S
Lee, Fair data collection in wireless sensor networks: analysis and protocol. Ann. Telecommun. 65(7–8), 433–446 (2010) [3] MA Mahmood, WK G Seah, I Welch,
Reliability in wireless sensor networks: a survey and challenges ahead. Comput. Netw. Elsevier. 79, 166–187 (2015)
[4] O Zytoune, M El-Aroussi, Aboutajdine D, An energy efficient clustering protocol for routing in wireless sensor network. Int. J. Ad Hoc Ubiquitous Comput. 7(1), 54–59 (2011) [5] C Ma, N Liu, Y Ruan, A dynamic and
energy-efficient clustering algorithm in large-scale mobile sensor networks. Int. J. Distributed Sensor Netw. 2013, 8 article ID, 909243 (2013). doi:10.1155/2013/909243
[6] Heinzelman WR, Chandrakasan A, Balakrishnan H. Energy-efficient communication protocol for wireless microsensor networks. InSystem sciences, 2000. Proceedings of the 33rd annual Hawaii international conference on 2000 Jan 4 (pp. 10-pp). IEEE.
[7] Smaragdakis G, Matta I, Bestavros A. SEP: A stable election protocol for clustered heterogeneous wireless sensor networks. Boston University Computer Science Department; 2004 May 31.
[8] Kashaf A, Javaid N, Khan ZA, Khan IA. TSEP: Threshold-sensitive stable election protocol for WSNs. InFrontiers of Information Technology (FIT), 2012 10th International Conference on 2012 Dec 17 (pp. 164-168). IEEE.
[9] Qureshi TN, Javaid N, Khan AH, Iqbal A, Akhtar E, Ishfaq M. BEENISH: Balanced energy efficient network integrated super heterogeneous protocol for wireless sensor networks. Procedia Computer Science. 2013 Jan 1;19:920-5.
1560 [11] Akbar M, Javaid N, Imran M, Amjad N, Khan
MI, Guizani M. Sink mobility aware energy-efficient network integrated super heterogeneous protocol for WSNs. EURASIP Journal on Wireless Communications and Networking. 2016 Feb 29;2016(1):66.
[12] Cheng CT, Chi KT, Lau FC. A clustering algorithm for wireless sensor networks based on social insect colonies. IEEE sensors journal. 2011 Mar;11(3):711-21.
[13] T. Pankiw, “Cued in: Honey bee pheromones as information flow and collective decision making,” Apidologie, vol. 35, no. 2, pp. 217– 226, Mar. 2004
[14] D. M. Gordon, Ants at Work: How an Insect Society is Organized. New York: Free Press, 1999.
[15] Ruihua Z, Zhiping J, Xin L, Dongxue H. Double cluster-heads clustering algorithm for wireless sensor networks using PSO. InIndustrial Electronics and Applications (ICIEA), 2011 6th IEEE Conference on 2011 Jun 21 (pp. 763-766). IEEE.
[16] T. Shankar, A. Karthikeyan, P. Sivasankar, and A. Rajesh, hybrid approach for optimal cluster head selection in wsn using leach and monkey search algorithms, Journal of Engineering Science & Technology (JESTEC). The paper has been reviewed and accepted for publication in Volume 12, Issue 2 (February 2017)
[17] Shankar T, Shanmugavel S, Rajesh A, Hybrid HSA and PSO Algorithm for Energy Efficient Cluster Head Selection in Wireless Sensor Networks, Swarm and Evolutionary Computation, Elsevier Publisher, Volume 30, October 2016, Pages 1–10 (Article in Press) 2016.
[18]Shankar T, Shanmugavel, S 2014, ‘Energy Optimization In Cluster Based Wireless Sensor Networks’, Journal of Engineering Science and Technology, School of Engineering, Taylor’s University, ISSN 18234690, vol.9, no.2, pp.246-260.
[19].T.Shankar, Dr.S.Shanmugavel Paper published titled “Hybrid Approach for Energy Optimization in cluster based wireless sensor networks using Energy balancing clustering protocol” in the Journal of Theoretical and Applied Information Technology(JTAIT) “ 31st March 2013. Vol. 49 No.3 .pages 906-921, ISSN: 1992-8645.
[20].Sasikumar P, Shankar T, Sibaram Khara, Balanced Cluster Head Selection Based on Modified k-Means in a Distributed Wireless Sensor Network, International Journal of Distributed Sensor Networks, Hindawi Publisher, Volume 2016(1),pp-1-11.
[21].T.Shankar, Dr.S. Shanmugavel, A.Karthikeyan Paper published title “Modified Harmony Search Algorithm for Energy Optimization in WSN” in the journal of International Review on Computers and Software(IRECOS) June 2013, (Vol 8 No.6 )
[22].T.Shankar, Dr.S. Shanmugavel, A.Karthikeyan published paper title “Hybrid Approach For Energy Optimization In Wireless Sensor Networks Using Pso” in the journal of International Review on Computers and Software(IRECOS), June 2013, (Vol 8 No.6 ) [23].Tony James, T. Shankar, A. Karthikeyan, A. Rajesh. Sensor Node localization in wireless Sensor Networks using Flower Pollination Metaheuristic algorithm, International Journal of Applied Engineering Research, ISSN 0973-4562 Vol.10 No.20 (2015), pp16404-16408. [24].Shankar T, Karthikeyan A, Sivasankar P and