N A N O E X P R E S S
Size-Dependent Materials Properties Toward a Universal
Equation
G. Guisbiers
Received: 11 March 2010 / Accepted: 15 April 2010 / Published online: 4 May 2010 ÓThe Author(s) 2010. This article is published with open access at Springerlink.com
Abstract Due to the lack of experimental values con-cerning some material properties at the nanoscale, it is interesting to evaluate this theoretically. Through a ‘‘top– down’’ approach, a universal equation is developed here which is particularly helpful when experiments are difficult to lead on a specific material property. It only requires the knowledge of the surface area to volume ratio of the nanomaterial, its size as well as the statistic (Fermi–Dirac or Bose–Einstein) followed by the particles involved in the considered material property. Comparison between differ-ent existing theoretical models and the proposed equation is done.
Keywords NanomaterialsSize effectShape effect TheoryTop–down
Introduction
Understanding how materials behave at tiny length scales is crucial for developing future nanotechnologies. The advances in nanomaterials modeling coupled with new characterization tools are the key to study new properties and capabilities and then to design devices with improved performance [1]. This study of size and shape effects on material properties has attracted enormous attention due to their scientific and industrial importance [2–4]. Nanoma-terials have different properties from the bulk due to their high surface area over volume ratio and possible appear-ance of quantum effects at the nanoscale [5–7]. The
determination of nanomaterials properties is still in its infancy and many materials properties are unknown or ill-characterized at the nanoscale [8,9]. Therefore, modeling different phenomena by only one general equation could be particularly helpful at the nanoscale when experimental data is lacking.
Theory
When modeling nanomaterials, there exist two main approaches. In the ‘‘top–down’’ approach, one looks at the variation of the properties of systems that change when going from the macro to the nano dimensions. At the opposite, in the ‘‘bottom-up’’ approach, one starts from atoms and one adds more and more atoms, in order to see how the properties are modified. The first makes use of classical thermodynamics, whereas the second relies on computational methods like molecular dynamics. Molecu-lar dynamics generally considers less than one million atoms [10] in order to keep calculation time within rea-sonable values. This factor limits the nanostructure size modeled until values around 100 nm [11]. By using clas-sical thermodynamics, the ‘‘top–down’’ approach ceases to be valid when thermal energykTbecomes smaller than the energetic gap between two successive levels,d. Generally for metals, according to Halperin [12], when d/k*1 K, the band energy splitting appears for diameter values between*4–20 nm depending on the material considered. When d/k*100 K, this diameter is between *1 and 4 nm in agreement with the value announced by Wautelet et al. [13]. The size limit considered in this manuscript will be 4 nm. Therefore, the ‘‘top–down’’ approach emerges as a simple complementary method which can give useful insights into nanosciences and nanotechnology.
G. Guisbiers (&)
UCL, Institute of Mechanics, Materials and Civil Engineering, 2 Place Sainte Barbe, 1348 Louvain-La-Neuve, Belgium e-mail: [email protected]
Adopting a ‘‘top–down’’ approach, the following equa-tion has been proposed in a previous paper [14] to describe size and shape effects on characteristic temperatures at the nanoscale. This equation predicts the melting temperature, Debye temperature, Curie temperature and superconduc-ting temperature of nanomaterials according to the spin of the particles involved in the considered material property. The ratio of the size/shape-dependent characteristic tem-perature,TX, over the characteristic bulk temperature,TX,?,
is given by:
TX=TX;1¼ 1ashape=D
1=2S
ð1Þ
where X represents melting, Debye, Curie or supercon-ducting.ashapeis the parameter quantifying the size effect
on the material property and depending on the nanostruc-ture’s shape. ashape is defined as ashape=[D(cs-cl)/ DHm,?](A/V) where A/V is the surface area over volume
ratio, DHm,? is the bulk melting enthalpy and cs(l) the
surface energy in the solid (liquid) phase.Dis the size of the nanostructure.Sequals to one half or one if the parti-cles involved in the considered phenomena follow a sta-tistic of Fermi–Dirac or Bose–Einstein. For melting and ferromagnetism (Curie),S equals to one-half, whereas for superconducting and vibration (Debye)Sequals to one.
One of the most important property from which we can derive almost all the thermodynamic properties of materi-als is the cohesive energy [15]. Indeed, the cohesive energy is responsible for the atomic structure, thermal stability, atomic diffusion, crystal growth and many other properties [6,16]. It is related to the melting temperature, activation energy of diffusion and vacancy formation energy by the following relation [15,17,18]:
Ec Ec;1 ¼
Ea Ea;1¼
Ev Ev;1 ¼
Tm
Tm;1 ð2Þ
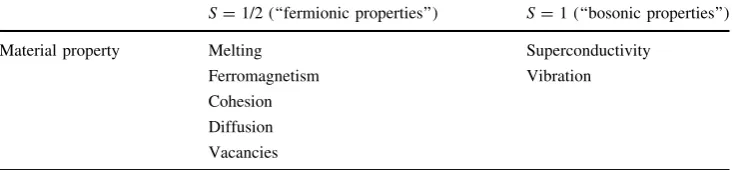
The cohesive energy is the energy required to break the atoms of a solid into isolated atomic species. The activation energy of diffusion is the energy required to activate the diffusion of one atom. The vacancy formation energy is the energy required to produce one vacancy i.e. a Schottky defect. All the particles involved in the cohesive energy, activation energy of diffusion and vacancy formation energy are electrons, characterized by a half integer spin, and obey then to a Fermi–Dirac statistic (Table1).
By combining Eqs.1 and2, this suggests an extension of the universal relation developed for characteristic tem-peratures to other properties as the cohesive energy which is one of the most important material properties.
n=n1¼ 1ashape=D
1=2S
ð3Þ
where n represents the size/shape-dependent material property andn?represents the bulk material property. The
material properties considered here are the melting tem-perature, Curie temtem-perature, Debye temtem-perature, super-conductive temperature, cohesive energy, activation energy of diffusion, vacancy formation energy.
From Eq.3, it is clear that for a given material (i.e. a givenashapeparameter) and a given size (D), the size effect
on materials properties described by a Fermi–Dirac statistic (‘‘fermionic properties’’) is stronger than the size effect on materials properties described by a Bose–Einstein one (‘‘bosonic properties’’). For a given material property, the size effect increases when theashapeparameter increases or
the size of the nanostructure D decreases or both. In Fig.1, we have illustrated the materials properties behavior (Eq. 3) whatever the size, the shape and the nature of the material. Figure 1a, b illustrates the ‘‘fermionic’’ and ‘‘bosonic’’ material properties, respectively. Figure2 illustrates both properties into one graph versus the reci-procal size of nanomaterials for differentashapevalues.
Results and Discussion
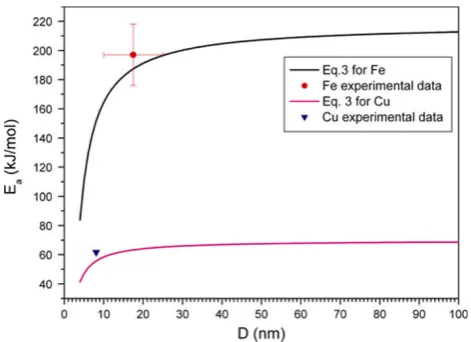
To validate Eq.3, we have compared the theoretical pre-diction with experimental data of cohesive energy for Mo and W nanoparticles (Fig. 2.) and of activation energy of diffusion for Fe and Cu nanoparticles (Fig.3.). We observe in Fig.2, a decreasing behavior of the cohesive energy by reducing size. From Fig.3, we note that diffusion is more easily activated and faster [19] at the nanoscale which is then particularly interesting for industrial applications because it lowers the process temperature. Moreover, the theoretical predictions from Eq.3 are in good agreement with experimental data. The small discrepancies with Mo data may come from the shape, here we used with Eq.3the
ashape for a sphere and experimentally the shape may
[image:2.595.179.546.629.714.2]deviate a little bit from this ideal case. Different from
Table 1 Distinction between ‘‘fermionic’’ and ‘‘bosonic’’ material properties
S=1/2 (‘‘fermionic properties’’) S=1 (‘‘bosonic properties’’)
Material property Melting Superconductivity
Ferromagnetism Vibration
Cohesion
Diffusion
complex and time-consuming computer simulation pro-cess, the universal relation (Eq.3) can predict the men-tioned materials properties from the bulk to sizes of nanostructures higher than *4 nm. For a given material, the ashape parameter can be calculated and then used to
explore the size effect on all the mentioned material properties (Fig.4).
Vacancies play an important role in the kinetic and thermodynamic properties of materials. Therefore, the vacancy formation energy is the key to understand the processes occurring in nano and bulk materials during heat treatment and mechanical deformation. To the best of our knowledge, only bulk vacancy formation energy is known
[20–22] and there is not yet experimental data concerning the vacancy formation energy at the nanoscale. As it is difficult to determine it experimentally, researchers refer to theoretical predictions. Therefore, we compared our results obtained from Eq. 3 with different models predicting the size-dependent behavior of the vacancy formation energy. Due to the linear proportionality between the cohesive energy and the vacancy formation energy [23], the surface-area-difference model from Qi et al. [24, 25] which con-sider the difference between the surface area of a whole particle and the overall surface area of all the constituent atoms in isolated state could write the vacancy formation energy as given by Eq.4.
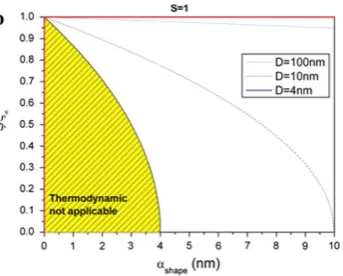
Fig. 1 n/n?ratio versus theashapeparameter for different sizes in
both cases:a when materials properties are described by a Fermi– Dirac statistic andbwhen they are described by a Bose–Einstein one. Whenashapeis equal to 0 (vertical red line) or whenn/n?is equal to 1 (horizontal red line) then there is no size effect, and the material
behaves as the bulk one. The solid, dashed and dotted blue lines
indicate the behavior of the nanomaterials for different sizesD=4, 10, 100 nm, respectively. The yellow region indicates the region where thermodynamics is no more valid
Fig. 2 n/n?ratio versus the reciprocal size for different values of ashapeparameter. When D-1is equal to 0 (vertical red line) or whenn/
n?is equal to 1 (horizontal red line) then there is no size effect, and the material behaves as the bulk one. Thesolid, dashedanddotted black(blue)linesindicate the behavior of ‘‘fermionic’’ (‘‘bosonic’’) nanomaterials properties for differentashapevalues. Theyellowregion
indicates the region where thermodynamics is no more valid
Fig. 3 Cohesive energy versus the size of the nanostructure for molybdenum (Mo) and tungsten (W). The solid lines indicate the theoretical prediction with Eq.3. for Mo and W nanoparticles. The
[image:3.595.310.482.57.195.2] [image:3.595.53.288.280.461.2] [image:3.595.309.541.280.460.2]Ev Qi¼Ev;1ð1pdhklbÞ ð4Þ
wherep is the ratio between the interface surface energy per unit area at 0K over the surface energy per unit energy at 0K.dhklis the interplanar distance ofhkl.bequals to 3j/
D, 2/w or 1/t for a nanoparticle, nanowire or nanofilm, respectively. D, w and t are the size of the nanoparticle, width of nanowire and thickness of the nanofilm, respec-tively.jis the shape factor of the nanoparticle defined as the surface area ratio between non-spherical and spherical nanoparticles in an identical volume.
The thermodynamic model from Yang et al. [15] expresses the vacancy formation energy of nanostructures from the size-dependent cohesive energy model of Jiang et al. [26] as:
Ev Yang¼Ev;1 1 1 2D=d
ð Þ 1
exp 2Sb 3R
1 2D=d
ð Þ 1
ð5Þ
wheredis the atomic diameter,Ris the ideal gas constant.
Sbis the bulk evaporation entropy.
The effective coordination number model from Shandiz [16] is based on the low coordination number of surface atoms and it expresses the vacancy formation energy as:
Ev Shandiz¼Ev;1 1ð1ZSBÞ
2D0 DþD0
ð6Þ
whereZSB is the ratio of the surface coordination number over the bulk coordination number.D0 is the size of the
nanoparticle for which all the atoms are located on the surface.D0=(2/3)(3-k)(PS/PL)d. k is a parameter rep-resenting the dimension of the nanostructure: k =0 for
nanoparticles, k=1 for nanowires and k=2 for nano-films.PSis the packing fraction of the surface crystalline plane. PL is the lattice packing fraction. d is the atomic diameter.
The bond-order-length-strength (BOLS) model from Sun [6] is based on the atomic coordination number imperfection due to the termination of the lattice period-icity. The BOLS formalism expresses the size-dependent vacancy formation energy as:
Ev Sun ¼Ev;1 1þ
X
i3
ci ZiBcim1
" #
ð7Þ
whereiis counted up to 3 from the outermost atomic layer to the center of the solid because no coordination imperfection is expected fori[3.ci=scid/Dis the portion of the atoms in theith layer from the surface compared to the total number of atoms in the entire solid.sis a parameter representing the dimension of the nanostructure (s=1 for a film,s=2 for a wire and s=3 for a particle).dis the bond length or the atomic diameter (without coordination number imperfec-tion).ZiBis the ratio of the coordination number of theith layer (Zi) over the bulk coordination number (ZB). ci¼
2 1½ þexp 12ð Zi=8ZiÞ1 is the bond contraction
coeffi-cient.mis a parameter representing the nature of the bond. The liquid-drop model from Nanda et al. [17, 27] expresses the size-dependent vacancy formation energy as:
Ev Nanda¼Ev;1 1 Es Ev;1
d D
Ev;1 15:75 d D
ð8Þ
whereEs=pd2cis the cohesive energy of an atom at the surface andcis the surface energy of the material.dis the atomic diameter.
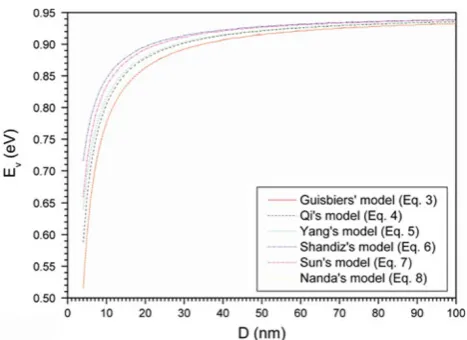
Figure5 illustrates the comparison between the men-tioned models and all the models indicate a decreasing behavior of the vacancy formation energy of free-standing nanostructures with the size. Let us note that the Guisbiers and Nanda’s models give in this particular case the same results. The consequence of this decreasing behavior with size means an increasing of the vacancies concentration in nanostructures compared to bulk. Indeed, by considering the size effect on the vacancy formation energy in the vacancies concentration of bulk materials cv,?=Cexp (-Ev,?/kT)
(C being a constant considered size independent), we get Eq. 9which is similar to the one obtained earlier by Qi et al. [25], validating then the reasoning based on Eq.3.
cv¼cv;1exp Ev kT
ashape D
ð9Þ
wherecvis the size/shape-dependent vacancies concentra-tion and cv,? is the bulk vacancies concentration.kis the
Boltzmann constant andTis the temperature. Fig. 4 Activation energy of diffusion versus the size of the
nanostructure for iron (Fe) and copper (Cu). Thesolid linesindicate the theoretical prediction with Eq.3. for Fe and Cu nanoparticles. The
[image:4.595.52.288.56.227.2]Conclusion
In summary, it is shown that there exists a universal rela-tion between many materials properties, the inverse of the particle size and the spin of the particles involved in the considered material property. Whatever the nature of the material, Figs.1 and2 are general maps summarizing the size and shape effects on the mentioned materials proper-ties from the bulk to the nanoscale. The prediction from the universal relation (Eq.3) has been validated by comparison with available experimental results and existing theoretical models. Describing different phenomena with only one equation is the ‘‘Holy Grail’’ for all physicists and maybe a more sophisticated equation may exist by considering other material properties. Nevertheless, the great advantage of the present equation is that it is free of any adjustable parameters!
Acknowledgments The author thanks the Belgian Federal Science Policy Office (BELSPO) for financial support through the ‘‘Mandats de retour’’ action. Dr. Steve Arscott is greatly acknowledged for proof reading this manuscript.
Open Access This article is distributed under the terms of the Creative Commons Attribution Noncommercial License which per-mits any noncommercial use, distribution, and reproduction in any medium, provided the original author(s) and source are credited.
References
1. M.J. Pitkethly, Mate. Today7(Supplement 1), 20 (2004) 2. H. Gleiter, Acta Mater.48, 1 (2000)
3. C.M. Lieber, Z.L. Wang, Bulletin32, 99 (2007) 4. E. Sutter, P. Sutter, Nano Lett.8, 411 (2008)
5. M.J. Yacaman, J.A. Ascencio, H.B. Liu, J. Gardea-Torresdey, J. Vac. Sci. Technol. B19, 1091 (2001)
6. C.Q. Sun, Prog. Solid State Chem.35, 1 (2007) 7. E. Roduner, Chem. Soc. Rev.35, 583 (2006)
8. E.K. Richman, J.E. Hutchison, ACS Nano3, 2441 (2009) 9. T.A. Campbell, Nano Today4, 380 (2009)
10. R. Holyst, M. Litniewski, Phys. Rev. Lett.100, 055701 (2008) 11. W.H. Qi, Physica B368, 46 (2005)
12. W.P. Halperin, Rev. Mod. Phy.58, 533 (1986) 13. M. Wautelet, D. Duvivier, Eur. J. Phys.28, 953 (2007) 14. G. Guisbiers, L. Buchaillot, Phys. Lett. A374, 305 (2009) 15. C.C. Yang, S. Li, Phys. Rev. B75, 165413 (2007) 16. M.A. Shandiz, J. Phys.: Condens. Matter20, 325237 (2008) 17. S.C. Vanithakumari, K.K. Nanda, Phys. Lett. A372, 6930 (2008) 18. C.C. Yang, Q. Jiang, Acta Mater.53, 3305 (2005)
19. G. Guisbiers, L. Buchaillot, Nanotechnology19, 435701 (2008) 20. R.W. Balluffi, J. Nucl. Mater.69, 240 (1978)
21. W. Bollmann, N.F. Uvarov, E.F. Hairetdinov, Cryst. Res. Tech-nol.24, 421 (1989)
22. H.-E. Schaefer, Physica Status Solidi A102, 47 (1987) 23. G.P. Tiwari, R.V. Patil, Scripta Metallurgica9, 833 (1975) 24. W.H. Qi, M.P. Wang, J. Mater. Sci.39, 2529 (2004)
25. W.H. Qi, M.P. Wang, M. Zhou, W.Y. Hu, J. Phys. D Appl. Phys. 38, 1429 (2005)
26. Q. Jiang, J.C. Li, B.Q. Chi, Chem. Phys. Lett.366, 551 (2002) 27. K.K. Nanda, S.N. Sahu, S.N. Behera, Phys. Rev. A66, 013208
(2002)
28. H.K. Kim, S.H. Huh, J.W. Park, J.W. Jeong, G.H. Lee, Chem. Phys. Lett.354, 165 (2002)
29. W.H. Qi, M.P. Wang, M. Zhou, X.Q. Shen, X.F. Zhang, J. Phys. Chem. Solids67, 851 (2006)
30. J. Horva´th, R. Birringer, H. Gleiter, Solid State Commun.62, 319 (1987)
31. G. Guisbiers, M. Kazan, O. Van Overschelde, M. Wautelet, S. Pereira, J. Phys. Chem. C112, 4097 (2008)
Fig. 5 Vacancy formation energy versus the size of a spherical gold (Au) nanoparticle. The bulk vacancy formation energy is 0.95 eV [21]. The models from Guisbiers, Qi, Yang, Shandiz, Sun and Nanda are compared together. The parameters used with the Guisbiers’ model areasphere=1.83 nm [31] and S=1/12.2. The parameters
used with the Qi’s model are d100=0.40788 nm [25], j=1.245
[25] and p=1. The parameters used with the Yang’s model are
Sb=105.47 Jmol-1K-1[15] andd=0.3188 nm [16]. The param-eters used with the Shandiz’s model arePL=0.74 [16], PS=0.91 [16], d=0.3188 nm [16], ZSB=0.25 [16] andk=0. The param-eters used with the Sun’s model areZB=12 [6],Z1=4 [6],Z2=6
[6], Z3=8 [6], d=0.3188 nm [16], m=1 [6] and s=3. The
[image:5.595.53.287.55.225.2]