Markov Chain Application in Object-Oriented
Software Designing
Santosh Kumar
Department of Computer Science Babasaheb Bhimrao Ambedkar University(A Central University) Viday Vihar, Rae Bareli Road Lucknow (U.P.), 226025, INDIA
Vipin Saxena
Department of Computer Science Babasaheb Bhimrao Ambedkar University
(A Central University) Viday Vihar, Rae Bareli Road Lucknow (U.P.), 226025, INDIA
ABSTRACT
In the current scenario, the performance evaluation of the software system is one of the major factors of the software development that helps to develop the quality oriented software. There are many performances optimizing techniques which are used for evaluating the performance of the software systems. Many of the researchers have used the optimization techniques i.e. Markov chain to find out the performance of the object-oriented software design. The present papers is based upon the evaluating the performance of the designed UML model for a real case study of Life Insurance of India (LIC). The performance is evaluated for sharing the attributes by the UML classes. The concept of the probabilistic adjacency metric is used and Dijkstra’s algorithm is applied to compute the optimal path.
Keywords
UML, Markov Chain, Class Diagram, Sequence Diagram, Adjacency Metric and Dijkstra;s Algorithm.
1.
INTRODUCTION
In the field of software engineering, a new modeling language was launched and approved as a standard modeling language for designing the object-oriented systems by the Object Management Group (OMG) in the year of 1997. Therefore, in the current scenario, UML is widely accepted and used by the software professionals and researchers for demonstrating any object-oriented problem in the diagrammatic form. It shows the conceptual as well as the graphical representation of the systems. The UML has a bunch of modeling tools that shows the static and dynamic behavior of software-intensive systems. The UML is also used to design the system architecture for measuring the performance of UML models. The UML model shows the interaction between the components of the system. There are a number of methods available for measuring the performance of UML models and one of them through Markov Chain is applied in the present work.
The Markov chain is a random process that can be applied to the mathematical as well as the real-world system with Markov properties. In this process, the system has undergone transition from one state to another state between the countable states; the future state is depending on the current state. Therefore, the Markov chain is described as a discrete set of states at a discrete set of time. The Markov chain is represented in the form of directed graph where the edges are labeled by the probabilities of going from one state to the other state.
In the present paper, the Markov chain technique is applied to compute the performance of the UML class model of the Life Insurance Corporation of India by extracting the Markov chain model from the UML sequence diagram and then created a probabilistic adjacency metric for issuing a policy by Life Insurance Corporation of India.
2.
RELATED WORK
On the above aspects, let us briefly describe some of the
important research work. Boris and Chris [1] have estimated
the ratios of the stationary distribution values for Markov chains modeling evolutionary algorithms. Sam and Dana [2] have given an overview of the theory of Markov chains and it shows how many natural chains are existing, including some relevance in the context of self-assembly, undergo a phase transition as a parameter representing temperature which is varied in the model. Daniel [3] has proved explicitly, i.e., non-asymptotic, error bounds for Markov Chain Monte Carlo methods, such as the Metropolis algorithm. Xiaofan et al. [4] have studied to introduce an early warning system to forecast drought using palmer drought severity index (PDSI) and Markov chain model. Alzate [5] has used a terrestrial packet grouping approach to minimize the on-board switching operations. By carefully redirecting some transitions to different states, we can evaluate exact statistics of the original complex Markov chain from the analysis of a much simpler reduced Markov chain. Jerome and Wojciech [6] have proposed a new semi-Markov chain hidden with long dependence noise model. Kota et al. [7] have proposed a new kana-to-kanji conversion method by using the Markov chain
model.Guangyue and Marcus [8] have proved that under mild
positivity assumptions, the entropy rate of a continuous-state hidden Markov chain, observed when passing a finite-state Markov chain through a discrete-time continuous-output channel, is analytic as a function of the transition probabilities of the underlying Markov chain. Kyomin et al. [9] have designed an algorithm with the fastest possible rate of convergence using a nonreversible Markov chain on the given network graph. Alzate [10] has used a terrestrial packet grouping approach to minimize the on-board switching operations. ar a [11] has introduced a new proposal to involve uncertainties in Fuzzy Markov Chains by using Interval Type-2 Fuzzy Sets (IT2 FS). Carpinone et al. [12] have proposed the method which is based on the use of
discrete time Markov chain models of aproper order and also
(ZSMC). Dirk [15] has introduced the reader into mixing time estimations via coupling arguments and uses the mixing of pheromone models for analyzing the expected optimization time of ant colony optimization. Weidong and Chuanrong [16] have introduced an expert interpretation-based Markov chain Geostatistical (MCG) framework for classifying land-use/land-cover (LULC) classes from remotely sensed imagery. Nazin and Miller [17] have proposed and studied the mirror descent randomized control algorithm on the class of controlled homogeneous finite Markov chains with unknown mean losses. Nikolay et al. [18] have developed a Markov chain approach for the modeling of forest stand dynamics. The aim of this work was`to generalize the recently developed Perfect Plasticity Approximation (PPA) model for scaling of vegetation dynamics from individual level to the landscape level through the ecosystem hierarchical structure. Takehiko [19] has analyzed the transition and convergence properties of genetic algorithms (GAs) applied to fitness functions perturbed concurrently by additive and multiplicative noise. Chuhong et al. [20] have proposed a new Markov-chain-based constant false alarm rate (CFAR) detector for polar metric data using low-level data fusion and high-level decision fusion. Sengupta et al. [21] have proposed the use of a modified version of MC4 (one of the Markov chains proposed by Dwork et al., 2001), followed by the weighted analog of local Kemenization for performing rank aggregation, where the sources of rankings can be prioritized by an expert. Lopes et al. [22] has explored the use of Markov chain models for the analysis of wind power time-series. Abdullatif and Pooley [23] have presented a method for providing computer support for extracting Markov chains, one of the important representations for numerical performance models, from a performance annotated UML sequence diagram according to the UML profile for schedulability, performance and time.
3.
UML CLASS DIAGRAM
The static behavior of Life Insurance Corporation of India for issuing policy is shown by the UML class diagram. The issuing policy system contains the different properties like
aggregation, association, and inheritance which are
represented in the following figure 1. There are several major
classes like Customer, Agent, Plan, New_Business,
Main_Branch, Bank, LIC_Branch1, LIC_Branch2 ……. LIC_BranchN. The Main_Branch has multiple associations with all the classes; the Agent class has multiple associations with the Customer class as well as the New_Business class while the Plan class also has multiple associations with the Customer class, then all the sub branches of LIC like LIC_Branch1, LIC_Branch2 ……… LIC_Bran hN has inherited the properties of LIC_Main_Branch along with the
Bank. After convincing for issuing a policy in
LIC_Main_Branch, the Customer class has to select the policy plan from the Plan class and then Agent sends the Customer with policy proposal to the New_Business class where the customer’s poli y proposal has been he ked and verified by the New_Business class. If the Customer class fulfills the eligibility criteria and validates then the New_Business class sends the policy proposal to the LIC_Main_Branch for issuing the proposed policy plan or if the Customer class has not fulfilled the eligibility criteria then New_Business class has to reject the policy proposal. The LIC_Main_Branch issued the policy after depositing the first premium amount of the proposed policy and allotted a policy number, thereafter the
premium amount of the policy is deposited as monthly, quarterly, half yearly and annually. The premium amount of the issued policies is auto deducted by the LIC_Main_Branch through the Bank whi h is linked by the every LIC’s Bran h. The Customer’s database should be uploaded to the online and stored in the LIC’s database through the interfa e software provided by the LIC. Therefore the details of policy can be viewed via online by entering the policy number or manually through the policy docket in the concerned LIC Branch. These dockets are sent to LIC_Main_Branch for scanning process to check the status of policy whether it is mature or laps or else. As the policy is matured then the sum assured of the policy has been given to the poli y holder’s account along with interest and bonus.
+Query() +Interact_with_Info() +Deposit_Perm() -Cust_ID +Cust_Name -Plan_Code -Plan_Term -Policy_No -Perm_Term -Sum_Assured -Prem_Amount -Date_of_Commt -Date_of_Birth +Sex -Medical_Status -Disability_Code -Earning -Income P/A -Address -Mobile_No -Prem_Mode -Prem_Due_Date -Date_of_Maturity -Age_at_Maturity -Nominee -Age -Relation Customer +Query() +Interact_with_Info() +Deposit_Perm() -Agent_ID +Agent_Name -Adderess -Mobile Agent +verify () +Refer () +Reject() -Cust_ID -Officer_ID +Officer_Name +Designation +Mobile_No -Address New_Business +..() -Plan_Code -Plan_Type Plan +New_Plans() +Issue_Policies() +Notifications() +Loan() -Zone_Code +Zone_Name -Division_Code +Division_Name +Divisional_Office_Add -Branch_Code +Branch_Office_Add LIC_Main_Branch +Deposit_Prem() +Acknowledgement () -Branch_Code +Bank_Name +Branch_office_Add Bank +Issue_Policies() +Deposit_prem () +Loan() -Division_Code -Branch_Code +Zone +Branch_Office_Add LIC_Branch1 +Issue_Policies() +Deposit_prem() +Loan () -Division_Code -Branch_Code +Zone +Branch_Office_Add LIC_Branch2 +Issue_Policies() +Deposit_prem () +Loan() -Division_Code -Branch_Code +Zone +Branch_Office_Add LIC_Branch N-1 +Issue_Policies() +Deposit_prem() +Loan () -Division_Code -Branch_Code +Zone +Branch_Office_Add LIC_Branch N ---
---Auto deduct premium amount
Reject if not valid
Convince for policy
S e n d f o r v a li d a t io n Validated Issued plan Keep Record Payment Acknowlegement * * * * * * * * * * * * * 1 1 1 1
4.
UML SEQUENCE DIAGRAM
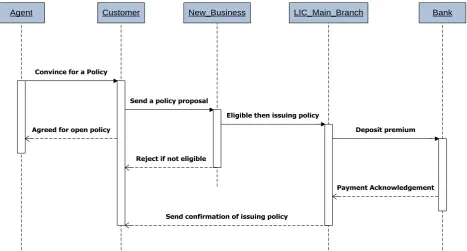
UML sequence diagram shows the dynamic behavior of the system with the interaction of the objects by interchanging messages between each other to perform the specific task. In the sequence diagram, every object has its life line to represent the flow of action which is shown by the vertical line while the communication between the objects is shown by an arrow along with communication message. Every message has a unique arrow style such as a synchronous message is represented by a solid black head arrow while a reply message is represented by the dotted arrow. There are two types of messages used in the sequence diagram as shown in figure 2 such as synchronous and reply. In synchronous message the sender will wait until the receiver sends a reply to the sender while the reply messages are sent by the receiver in the response of synchronous messages. Therefore, the sequence diagram shows the process of issuing policy in Life Insurance Corporation (LIC) of India. First of all the Agent
shows the plan and convinces the Customer to select and open a policy, when the Customer convinced for open a policy then the Agent sends the Customer to the New_Business department in the LIC_Branch with the policy proposal where the proposed policy proposal has been checked and verified by the new business officer; if the policy proposal is valid and the Customer fulfills the eligibility criteria then the proposal is further forwarded for the necessary action and approval to issue the proposed policy by the branch manager or rejects the policy proposal if not fulfill the eligibility criteria. The branch manager checks the policy proposal and approved for issuing the policy and sends back an approved policy proposal to the New_Business for further formalities; then the New_Business informs the Customer to deposit the premium amount of the proposed policy in the LIC_Branch, the LIC_Branch deposit the premium amount into the LIC_Main_Branch through the Bank. The LIC_Main_Branch has sent the issued policy bond to the Customer.
Agent Customer New_Business LIC_Main_Branch Bank
Agreed for open policy
Reject if not eligible
Payment Acknowledgement
Send confirmation of issuing policy Convince for a Policy
Send a policy proposal
Eligible then issuing policy
[image:3.595.65.533.280.531.2]Deposit premium
Fig 2. UML Sequence Diagram for Issuing Policy by LIC of INDIA
5.
EXPERIMENTAL STUDY
5.1
Annotated Sequence Diagram
The sequence diagram that is used to define the performance of the UML model of issuing policy by Life Insurance Corporation of India is annotated along with the performance stereotype/typecast. These annotations allow the designer to design and explain the extensions of UML standard; UML supports different types of stereotypes/typeset, tagged value and constraints that are used for performance of the designed system. The main stereotype i.e. Pstep is used for describing the tag value such as the probability of changing the states from one state to another state along with the communication message between the objects that are participating in the sequence diagram. The tag values are used in labeling the arcs of the Markov chain.
message having the tagged value PAprob = 0.95. The LIC_Main_Branch sends a synchronous message to the Bank is “Deposit Premium” with tag value PAprob = 0.95 and LIC_Main_Branch waits for the response of Bank i.e.
“Payment A knowledgement” along with the tagged value PAprob = 0.03; then the LIC_Main_Branch has sent a reply message to the Customer whi h is “Send onfirmation of issuing poli y” having tagged value PAprob = 0.95.
Agent Customer New_Business LIC_Main_Branch Bank
Agreed for open policy
Reject if not eligible
Payment Acknowledgement
Send confirmation of issuing policy PStep
PAprob=1
PStep PAprob = 0.98 PStep
PAprob=0.02
PStep PAprob=0.95
PStep PAprob=0.95 PStep
PAprob=0.03
PStep PAprob=0.03 PStep
PAprob=.95 Convince for a Policy
Send a policy proposal
Eligible then issuing policy
[image:4.595.62.533.136.407.2]Deposit premium
Fig 3. Annotated Sequence Diagram for Issuing Policy in LIC of INDIA
5.2
Markov Chain for Issuing Policy
The Markov chain performance model has been designed from the annotated sequence diagram. The state ‘a’ is the initial state which shows that the synchronous message called “Convin e for a Poli y”. The states ‘b’ and ‘ ’ are the wait and response states, respectively. The second message called “Send a poli y proposal” is also a synchronous message that represents the state ‘d’; the states ‘e’ and ‘f’ which are the wait and response state respectively; then the third synchronous message i.e. “Eligible then issue a poli y”
represents the state ‘g’ and the representation in ludes the wait and response states ‘h' and ‘i’ respe tively. The last message of the annotated sequence diagram is synchronous message alled “Deposit Premium” represented by the state ‘j’ i.e. the final state of the Markov chain for issuing policy in LIC of India; the states ‘k’ and ‘l’ are the wait and response states, respe tively. The state ‘j’ sends a reply message to state ‘g’ alled “Payment A knowledgement” and then state ‘g’ also sends a reply message to state‘d’ alled “Send onfirmation of issuing poli y”.
a 1 b c d e
.02
.98 .98 .98
.03
f .95
h
i g
.95 .95
.03
.9
5
.95 j
k .95
l .95
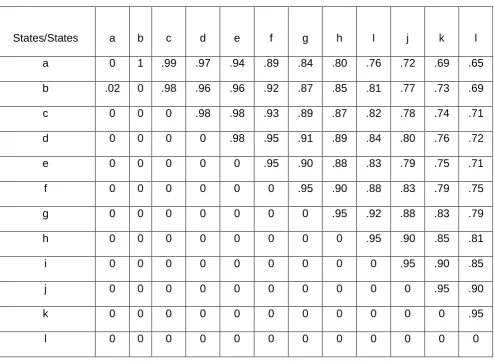
[image:4.595.80.509.575.717.2]From the figure 4, the probabilistic adjacency metric is constructed to represent the performance of the designed UML model for issuing policy by Life Insurance Corporation of India. The transformation of states is shown by an arrow
[image:5.595.53.548.157.520.2]along with the probabilistic values. The metric shows the probabilities values of state transformation from one state to another state.
Table 1. Probabilistic Adjacency Metric
States/States
a
b
c
d
e
f
g
h
I
j
k
l
a
0
1
.99
.97
.94
.89
.84
.80
.76
.72
.69
.65
b
.02
0
.98
.96
.96
.92
.87
.85
.81
.77
.73
.69
c
0
0
0
.98
.98
.93
.89
.87
.82
.78
.74
.71
d
0
0
0
0
.98
.95
.91
.89
.84
.80
.76
.72
e
0
0
0
0
0
.95
.90
.88
.83
.79
.75
.71
f
0
0
0
0
0
0
.95
.90
.88
.83
.79
.75
g
0
0
0
0
0
0
0
.95
.92
.88
.83
.79
h
0
0
0
0
0
0
0
0
.95
.90
.85
.81
i
0
0
0
0
0
0
0
0
0
.95
.90
.85
j
0
0
0
0
0
0
0
0
0
0
.95
.90
k
0
0
0
0
0
0
0
0
0
0
0
.95
l
0
0
0
0
0
0
0
0
0
0
0
0
6.
ALGORITHIM
From the above, the Dijkstra’s algorithm on the Markov hain is used for the finding an optimal path which is described below in brief:
1. Set the initial node obj.PAprob = 0 and set rest of all
nodes obj.PAprob = ∞.
2. Mark all nodes {a-l} unvisited and make obj.currentnode
= obj.initialnode.
3. Now computing the tentative probability by considering
the entire unvisited neighbor nodes from the current node.
obj.currentnode = weight of current node + tentative probability of neighbor node
4. If current obj.PAprob < previous obj.PAprob then
overwrite that probability.
5. Mark obj.currentnode = visited after consider the entire
neighbor node and remove from the unvisited set, the recorded probability is final and minimal.
6. Repeat the steps 3, 4 and 5 until all the nodes are not visited and marked the destination node visited with minimal probability value.
From the above algorithm, the optimal path of issuing policy system is
a→b→ →d→e→f→g→h→i→j→k→l
As the constraints are increasing there are many more optimal paths are found.
7.
RESULTS & CONCLUSIONS
measuring the performance of the attributes of the designed UML model. The probabilistic values of the attributes are represented in the form of adjacency metric and find out a optimal path through the Dijkstra’s algorithm. It is observed that the attributes are highly reliable for the designed UML model.
8.
ACKNOWLEDGMENTS
Thanks are due to University Grants Commission, New Delhi, for providing Rajiv Gandhi National Fellowship (RGNF) to carry out the above research work.
9.
REFERENCES
[1] Boris M. and Chris C. 2009 Estimating the ratios of the
stationary distribution values for Markov chains
modeling evolutionary algorithms, Evolutionary
Computation MIT Press Cambridge, MA, USA, Vol. 7, Issue 3, pp. 343-377.
[2] Sam G. and Dana R. 2009 Convergence rates of Markov
chains for some self-assembly and non-saturated Ising models, Theoretical Computer Science Elsevier Science Publishers Ltd. Essex, UK, Vol. 410, Issue 15, pp 1417-1427.
[3] Daniel R. 2009 Explicit error bounds for lazy reversible
Markov chain Monte Carlo, Journal of Complexity Academic Press, Inc. Orlando, FL, USA, Vil. 25, Issue 1, pp 11-24.
[4] Xiaofan L., Liliang R. Fei Y. and Bang Y. 2009
Meteorological Drought Forecasting Using Markov
Chain Model, International Conference on
Environmental Science and Information Application Technology, ESIAT, 4-5 July, Vol. 2, pp. 23-26.
[5] Alzate M.A. 2009 Exact statistics of a complex Markov
chain through state reduction: A satellite on-board switching example, IEEE Latin-American Conference on Communications, LATINCOM 10-11 Sept., pp. 1-7.
[6] Jérôme L-L. and Wojciech P. 2010 Unsupervised
segmentation of new semi-Markov chains hidden with long dependence noise, Signal Processing, Elsevier North-Holland, Inc. Amsterdam, The Netherlands, Vol. 90, Issue 11, pp. 2899-2910.
[7] Kota S., Araki C., Hashimukai S. Ogoshi Y. Mori M.
and Taniguchi S. 2010 Kana-to-kanji conversion method using Markov chain model of words in bunsetsu, 4th International Universal Communication Symposium (IUCS), 18-19 Oct. 2010, pp 154 – 160.
[8] Guangyue H. and Marcus B. 2010 Entropy rate of
continuous-state hidden Markov chains, IEEE
International Symposium on Information Theory Proceedings (ISIT), 13-18 June, pp. 1468 – 1472.
[9] Kyomin J., Shah D. and Jinwoo S. 2010 Distributed
Averaging via Lifted Markov Chain, IEEE Transactions on Information Theory, Vol. 56, Issue 1, pp. 634-647.
[10]Alzate M.A. 2010 LatinCon07-Exact Statistics of a
Complex Markov Chain through State Reduction: A Satellite On-board Switching Example, Latin America Transactions, IEEE (Revista IEEE America Latina), Vol. 8, Issue 4, pp. 403-409.
[11] ar a .C.F. 2010 Interval type-2 Fuzzy Markov
Chains: An approach, Fuzzy Information Processing Society (NAFIPS), Annual Meeting of the North
American, 12-14 July 2010, pp. 1-6.
[12]Carpinone, A., Langella R., Testa A. and Giorgio M.
2010 Very short-term probabilistic wind power
forecasting based on Markov chain models, IEEE 11th International Conference on Probabilistic Methods Applied to Power Systems (PMAPS), 14-17 June, pp. 107-112.
[13]Adnan N.A. and Islam M.S. 2010 Correction and
Interpolation of Noise Corrupted Voice Using Markov Chain Detection Technique, International Conference on Data Storage and Data Engineering (DSDE), 9-10 Feb, pp. 305-309.
[14]Mapp G., Thakker D. and Gemikonakli O. 2010
Exploring a New Markov Chain Model for Multiqueue Systems, 12th International Conference on Computer Modeling and Simulation (UKSim), 24-26 March, pp. 592-597.
[15]Dirk S. 2011 Using Markov-chain mixing time estimates
for the analysis of ant colony optimization, Proceedings of the 11th workshop proceedings on Foundations of genetic algorithms, ACM New York, NY, USA, pp 139-150.
[16]Weidong L. and Chuanrong Z. 2011 A Markov Chain
Geostatistical Framework for Land-Cover Classification With Uncertainty Assessment Based on Expert-Interpreted Pixels From Remotely Sensed Imagery, IEEE Transactions on Geosciences and Remote Sensing, Vol. 49, Issue 8, pp. 2983-2992.
[17]Nazin A.V. and Miller B. 2011 The mirror descent
control algorithm for weakly regular homogeneous finite Markov chains with unknown mean losses, 50th IEEE Conference on Decision and Control and European Control Conference (CDC-ECC), 12-15 Dec, pp. 1779-1783.
[18]Nikolay S., Ionu F., Alicia R. W. and Fabian M. 2012
Modelling of forest stand dynamics using Markov chains, Environmental Modeling & Software Elsevier Science Publishers B. V. Amsterdam, The Netherlands, Vol. 31, pp 64-75.
[19]Takehiko N. 2012 Markov chain analysis of genetic
algorithms applied to fitness functions perturbed concurrently by additive and multiplicative noise, Computation Optimization and Applications Kluwer Academic Publishers Norwell, MA, USA, Vol. 52, Issue 2, pp 601-622.
[20]Chuhong F., Ting L., Lampropoulos G.A. and
Anastassopoulos V. 2012 Markov Chain CFAR Detection for Polari metric Data Using Data Fusion, IEEE Transactions on, Geosciences and Remote Sensing, Vol. 50, Issue 2, pp 397-408.
[21]Sengupta D., Maulik U. and Bandyopadhyay S. 2012
Weighted Markov Chain Based Aggregation of Biomolecule Orderings, IEEE/ACM Transactions on Computational Biology and Bioinformatics, Vol. 9, Issue 3, pp. 924-933.
[22]Lopes V.V. Scholz T. Estanqueiro A. and Novais, A.Q.
2012 On the use of Markov chain models for the analysis of wind power time-series, 11th International Conference on Environment and Electrical Engineering (EEEIC), 18-25 May, pp. 770 – 775.
[23]Abdullatif and Pooley 2008 A Computer Assisted State
Marking Methods For Extracting Performance Models
From Design Models, International Journal of