Study and Performance Evaluation of the Effect of Data
Rate in Wireless Ad-Hoc Networks using IEEE 802.11b
MAC protocol
D.Sylvia
Research Scholar, Department of ECE
Jawaharlal Nehru Technological University
Hyderabad
B.Jothimohan,
Ph.D Professor, Department of ECE, Easwari Engineering CollegeChennai
D.Srinivasa Rao,
Ph.D Professor & HOD, Department of ECE Jawaharlal Nehru Technological UniversityHyderabad
ABSTRACT
There is an ever increasing demand for wireless communication devices that support high data rates. Many modern communication devices support variable data rates. The maximum data rate that can be sent over the wireless channels is determined by the channel capacity and its condition. For the efficient utilization of the scarce radio spectrum, it becomes very important to compute the capacity of these wireless channels. The capacity of the channel varies depending on the radio propagation environment considered. Certain factors such as fading and interference that have a detrimental effect in the physical layer are to be considered, while evaluating the performance of the network. Further, in a mobile ad hoc network, all nodes are exposed to interference due to the free mobility of nodes. In an IEEE802.11 based ad hoc network, it is found that the advantage of using high data rates is diminished by the shorter transmission range associated with it. Using simulations, the analysis of single hop and multihop network is carried out for a good understanding of the performance of the network under multiple data rates. This paper focuses on the capacity of the wireless ad hoc networks and analyses the effect of certain key factors namely, data rate, mobility of the nodes and residual energy of the nodes. The key motivation of this paper is to study the mobile network behavior, which provides useful insights in developing better routing strategies in a resource constrained network.
Keywords
Wireless Ad-Hoc Networks, Data Rate, MAC, Routing protocols, Performance Evaluation.
1.
INTRODUCTION
Wireless ad hoc networks in recent years have found increased use in various applications that include military communication, search and rescue operation, vehicular communication and 4G wireless networks.
The computation of capacity becomes important for two major reasons: one, if the capacity of the network is known it becomes an objective measure for the efficiency of the protocols and the other reason is by trying to measure capacity, the fundamental limits of the network can be known. For communication channel with a given conditional probability, the information theoretic capacity can be defined as the amount of information transmitted over the channel. There are no restrictions on the type of modulation employed. The media access capacity maybe defined as the maximum traffic load that the network can handle when operating
according to a given media access protocol. For a specific metric, Erlang capacity is the maximum traffic load such that the performance is satisfactory. Network Capacity is the traffic carrying capabilities of a completely well-defined network. The node placement, channel model, transceiver model, medium access protocol, routing protocol and interference constraints are all considered while calculating the network capacity. In this paper our focus is to evaluate the network capacity, by considering various factors that have a detrimental effect on it.
There is a huge demand for the radio spectral resource due to the emergence of wireless access technologies. Interference computation and interference mitigation become a critical objective in designing wireless communication systems. Interference acts as a major limiting factor in the performance of wireless ad hoc networks [1].
This paper focuses on evaluating certain important metrics on the performance wireless ad hoc networks using AODV [2] and AOMDV [3]. Even though both these protocols have the common characteristics of initiating the routing on an on-demand basis, this study is a means to extract the merits of these platforms, thereby leading to development of more efficient routing solutions. The metrics considered include Packet delivery Ratio, Average network Throughput, End-to-End delay, Average power consumption of the network and Residual Energy of the network. The computation of these parameters through simulations provide a better understanding of the network behavior and therefore will provide new insights for designers to devise new methodologies to improve the performance of a resource constrained network.
2.
RELATED WORKS
transmission range. Various recent wireless standards such as 802.11b,a, g support multi-rate transmission[4].
[image:2.595.60.270.285.541.2]Higher speed and longer range has been the demand of the day and therefore has necessitated the use of multi-rate data transmission. While selecting the rate of communication, the existing channel conditions are to be considered. A suitable routing protocol is to be used, which selects the best possible path from source to destination. The issue to be considered here is that, to cover long distances using lesser number of hops, the links have to operate at low speed; whereas high rates may be used to cover short distances with more number of hops. The data packets need to be delivered effectively, in spite of the absence of centralised control or a predetermined fixed topology. The dynamically changing topology throws a challenge while deciding the routing of the data packets. Based on the mechanism used for the updating the routing information, the routing protocols can be broadly classified as follows[5]:
Fig. 1: Classification of Routing Protocols
The table driven protocols are also called as proactive protocols, in which every node maintains global information in the form of tables. The tables are updated periodically. The destination sequenced distance vector routing protocol (DSDV), Wireless routing protocol (WRP), source –tree adaptive routing protocol (STAR) and cluster head gateway switch routing protocol(CGSR). A major disadvantage of these protocols is that delay in updating of the table causes stale information at the nodes.
In the network employing on-demand routing protocols, the nodes need maintain the route information and the route is found only when required.
A few of the protocols under this category are Dynamic Source Routing protocol(DSR),Ad hoc on-demand distance vector (AODV) protocol, Temporally Ordered Routing Algorithm(TORA) and Ad Hoc on-demand Multipath distance vector protocol(AOMDV).
The hybrid protocols are yet another category in which the nodes maintain local information for a certain number of hops. Zone Routing protocol(ZRP), Core Extraction Distributed Ad Hoc Routing protocol(CEDAR) and one based Link State Routing protocol come under this category. The remaining part of the paper is organized as follows. In Section III, The network model and radio propagation environment considered in this paper is described. In section IV, the various performance evaluation metrics considered are described. In Section V, the results of the simulation are discussed and the paper is concluded in Section VI.
3.
MODEL DESCRIPTION
In this section, the model used for the wireless ad hoc network is described.
3.1
Radio Channel Model
In wireless ad hoc networks, all nodes are mobile. As the signal gets transmitted from one mobile node to another, there is a loss of power along the transmission path. This loss depends on the distance travelled and the environment in which it travels. It becomes essential to model wireless channels, which describes the wireless environment as realistically as possible. The mobile nodes often do not communicate using Line-of-Sight. The propagation of signals is basically described by the large scale and small scale propagation model. [6]
Wireless channels propagate in the form of electromagnetic radiation from transmitter to receiver. The characteristics of the wireless channels can be described by either the deterministic channel model or the statistical channel model. The deterministic channel model describes the signal propagation when there is one direct path between the transmitter and receiver. But this model does not include the variability of the wireless channel. The free space propagation model and the ground reflection model are deterministic channel models, which calculate the received power as a deterministic function of distance.
But a radio channel has an extremely random characteristic, such that the simple Additive White Gaussian Noise model may not be enough to analyze the channel capacity. Radio signals propagate by means of reflection, diffraction and scattering which results in attenuation, shadowing and fading. The statistical channel model is used to describe the constructive and destructive interference of a large number of multipath components. The shadowing model includes the variability of the received signal as a function of distance. At near distance d0, the model uses a Log distance path loss
model given by:
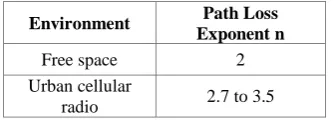
Here n is the path loss exponent and is determined empirically. The table shows the different values of n.
Table 1: Path Loss Exponents for different Environments [Wireless Communication, Rappaport]
Environment Path Loss
Exponent n
Free space 2
Urban cellular
[image:2.595.346.513.706.766.2]Shadowed urban
cellular radio 3 to 5 In building
line-of-sight 1.6 to 1.8 Obstructed in
buildings 4 to 6 Obstructed in
factories 2 to 3
3.2
Medium Access Control
It is assumed that a multiple access scheme with carrier sensing is used in the data link layer of the ad hoc network. There are two techniques that can combat interference: physical carrier sensing and virtual carrier sensing. The IEEE802.11b MAC protocol has been simulated.
3.3
Distribution of Nodes
30 nodes are randomly generated and a maximum of 10 source destination pair is randomly selected.
3.4
Homogeneity
All nodes are assumed to transmit with the same power, and have the same traffic pattern and no data is assigned priority.
4.
PERFORMANCE EVALUATION
[image:3.595.335.520.257.388.2]Wireless interface cards provide wireless connectivity solution in wireless networks. The Proxim Orinoco PC card by the Lucent technology is optimized specifically for this purpose. It is compatible with the popular IEEE 802.11b wireless MAC standard and supports a variety of data rates of 1, 2, 5.5 and 11 Mbps. It operates in the same 2.4GHz band and its channel bandwidth is 22MHz as in IEEE 802.11b. The card supports variable data rates and the following table gives the Orinoco Gold 802.11b Wireless PC card specifications. [7]
Table 2 : Orinoco PC Card Specifications
Frequency 2.4GHz
Transmit Power 15dBm
Carrier Sense Threshold 100 dBm
Capture Threshold 10
Data Rate(Mbps)
Receiver Sensitivity
(dBm)
Maximum Range(m)
1 94 796
2 91 669
5.5 87 531
11 82 399
4.1
Simulation Environment
The ns2 simulator with CMU Monarch wireless extension [8] is used in this analysis.
The parameters are set as listed in the table 1 in Section III. The transmission power is at a fixed level of 15dBm,the sensing range is 1124m and receiver thresholds are set as listed in table 1 for the different data rates .The Constant Bit rate (CBR) traffic characterizes the traffic flow and the packet
size is chosen to be 1500 bytes. For the radio propagation model, the two ray-path loss model has been considered. The analysis is done by using both Ad hoc On Demand Distance Vector (AODV) protocol and Ad hoc On Demand Multipath Distance Vector (AOMDV) protocol as the routing protocols.
4.2
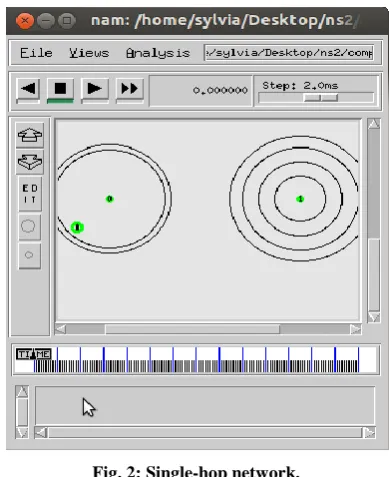
Single hop network
A random topology is considered, in which 2 nodes are randomly deployed within a 1000x1000m2 flat area. A single
flow between the source and destination is considered, to determine the transmission range achieved for the different data rates at a fixed power level of 15 dBm. As the distance between the nodes increases, the throughput drops drastically. The simulation is run for 400 sec. The table 3 illustrates the transmission ranges achieved through simulations.
Table 3 : Transmission ranges of 802.11b
Data Rate(Mbps)
Theoretical Maximum
Range(m) Achieved(m) Range
1 796 675
2 669 625
5.5 531 550
11 399 400
[image:3.595.330.525.416.655.2]The figure shows the single hop network scenario.
Fig. 2: Single-hop network.
4.3
Multi hop network
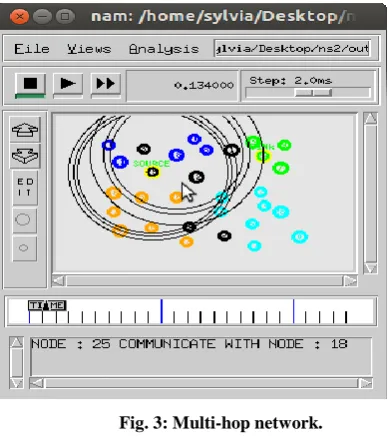
Multi hop ad hoc network uses multiple relay nodes to transmit packets from source to destination, when direct communication is not possible.
[image:3.595.49.286.460.663.2]transmission range of each other act as relay nodes. Both AODV and AOMDV are employed to evaluate the network performance. The mobility of the nodes is according to the Random Way Point Model. 30 nodes are randomly deployed in a 1000 x 1000 m2 flat grid and the nodes move at a maximum speed of 10ms. The rate of packet generation is 4 packets/ second and the pause time is varied and the performance evaluated static and mobile nodes. The simulation is run for 400 sec.
[image:4.595.56.251.186.405.2]The figure shows the multi hop network scenario.
Fig. 3: Multi-hop network.
4.4
Performance Metrics Considered
The performance metrics are used as a measure of the Quality of Service achieved during the transmission of the packets. The performance metrics evaluated in the simulation are: Packet Delivery Ratio:The packet delivery ratio maybe defined as the number of packets sent from the application layer of the source nodes and the actual number of packets received at the destination nodes.
This is an important evaluation metric as it shows the loss in the transmission.
End-to-End Delay:
The term end-to-end delay characterizes the total delay experienced by the data packets as it travels from the source to destination.
Depending on the routing protocol used, the delay may vary and a trade-off exists between low delay or lesser number of dropped packets.
Average Throughput:
The average throughput is a measure of the effectiveness of the network in delivering data packets.
Average routing overhead:
This measures the average number of control packets produced per node and includes route requests, replies and error messages.
Average power consumption:
Energy is one of the limited resources in a mobile ad hoc network and Average power consumption is a measure of the average power consumption in the network.
Average Residual energy:
Since battery lifetime in ad hoc networks is of critical importance, the residual energy measures the available energy in the network at the end of the transmission.
4.5
SIMULATION RESULTS
The various results achieved using simulation are described in this section.
4.6
Single hop network
2 nodes are deployed in a topology of a 1000 x 1000 m2. The distance between the nodes is varied to observe the transmission range achieved by the different data rates of 1, 2, 5.5 and 11Mbps.
The simulation is run for 400 sec for both AODV and AOMDV routing protocols.
The graph shows that the high data rate has a shorter transmission range of 500m, at which the throughput drastically reduces. The low data rate of 1 Mbps achieves a longer transmission range of 700m, after which the throughput drops.
[image:4.595.319.538.392.666.2]These simulations are done with the objective of correlating with the transmission range of the wireless interface card specifications listed in table 2.
Fig. 4: Packet delivery ratio for different Data Rates
Fig. 5: Average Throughput of the network for different data rates
4.7
Multi hop network
destination. The traffic type is CBR and the packet size is 1500 bytes.
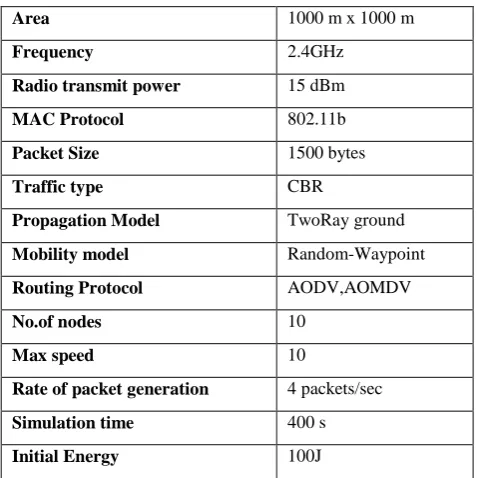
Table 4 . NS2 Simulation parameters
Area 1000 m x 1000 m
Frequency 2.4GHz
Radio transmit power 15 dBm
MAC Protocol 802.11b
Packet Size 1500 bytes
Traffic type CBR
Propagation Model TwoRay ground
Mobility model Random-Waypoint
Routing Protocol AODV,AOMDV
No.of nodes 10
Max speed 10
Rate of packet generation 4 packets/sec
Simulation time 400 s
Initial Energy 100J
The Packet Delivery ratio of both routing protocols is higher when the nodes are mobile than when static. Also the PDR achieved for AOMDV is much better than that of AODV, since an alternate path is chosen if a nodes moves out of the transmission range.
[image:5.595.318.535.163.294.2]Fig. 6 : Packet delivery ratio for mobile and Static
network using AOMDV
Fig. 7: Packet delivery ratio for mobile and Static network using AODV
On analyzing the average throughput achieved for the network, we find that the mobility of the nodes aids in achieving a better throughput. As the data rate is increased, the performance of both static and mobile nodes for AODV is almost the same. But AOMDV loses its performance when nodes are mobile, which maybe attributed to the route selection that is repeated when nodes are not available in the link.
Fig. 8. Comparison of Average Throughput for mobile and Static network using AOMDV and AODV
[image:5.595.56.269.429.549.2]Also, the power consumed in a highly mobile network is found to be much lesser than static nodes since the retransmission rate is lower when one node or another acts as a relay node when the existing relay node moves away. The table below provides the average power consumption in the network for both static and mobile network scenario .For the mobile network, the power consumed by using AOMDV is slightly higher than that of AODV. Also, the lower data rate transmission consumes more power due to the frequent retransmissions involved.
Table 5. Average Power consumption of the network
Data Rate
(Mbps)
Average Power consumption using
AOMDV
Average Power consumption using
AODV
Mobile Nodes
Static Nodes
Mobile Nodes
Static Nodes
[image:5.595.317.542.450.729.2]1 35.292 34.155 32.746 36.861 2 25.953 31.986 24.750 25.114 5.5 18.913 23.328 15.7262 12.757 11 19.991 26.637 16.654 16.962
[image:5.595.53.276.474.724.2]Fig. 10: Residual Energy for mobile and Static network using AOMDV
[image:6.595.53.281.326.438.2]The figure 11 shows the end-to-end delay for the different data rates. We find that the delay is smaller for higher data rates and larger for lower data rates. The worst delay is experienced while using AODV in a static network and the least delay is experienced while using AOMDV in a mobile network. If the criteria of importance is minimal delay, then AOMDV may be chosen as the routing protocol.
Fig. 11: Comparison of Average End-to-End Delay for mobile and Static network using AOMDV and AODV
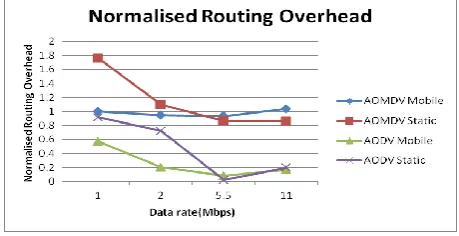
On considering the routing overheads involved, we find that AOMDV incurs more routing overheads which could possibly be because it send route request packets[10] whenever a relay node moves away whereas this mechanism does not happen in AODV. Also at high data rates AODV performance is similar for static and mobile nodes.
Fig. 12: Comparison of Normalized Routing Overhead for Mobile and Static network using AOMDV and AODV
5.
CONCLUSION AND FUTURE SCOPE
This paper compared the performance of AODV and AOMDV under different data rates using NS-2 Simulator. The comparison was done based on the packet delivery ratio, average power consumption, end-to-end delay and routing overheads for both static and mobile nodes. AOMDV outperforms AODV when the packet delivery ratio and average throughput are considered. But if the energy of the nodes is of critical importance, AODV provides much lesser power consumption compared to AOMDV. Therefore in scenarios where battery lifetime is of at most importance, AODV maybe preferred as the routing protocol. Our future work would be to design a scheme which uses an optimal transmit power to achieve better channel re-use and network capacity.
6.
REFERENCES
[1] Hekmat,R., Vam Miegham,P. “Interference in Wireless Multi-hop Ad-hoc Networks and its Effect on Network Capacity”, Wireless Networks,Vol.10,No.4,2004,pp.389-399.
[2] Charles E. Perkins and Elizabeth M. Royer. "Ad hoc On-Demand Distance Vector Routing" Proceedings of the 2nd IEEE Workshop on Mobile Computing Systems and Applications, New Orleans, LA, February 1999, pp. 90-100.
[3] Mahesh K.Marina and Samir Das, “"Ad hoc On-Demand Multipath Distance Vector Routing", Wiley Wireless Communications and Mobile Computing (WCMC) Journal Special Issue on Wireless Ad hoc Networks: Technologies and Challenges, Vol. 6, No. 7, pp. 969-988, Nov 2006.
[4] “Wireless LAN Medium Access Control (MAC) and Physical Layer (PHY) Specifications,” Technical Report Std 802.11, R2003,ANSI/IEEE, 1999.
[5] C.S.R.Murthy, B.S.Manoj, Ad hoc Wireless Networks, Architecture and Protocols, 6th Edition,2004.
[6] T. S. Rappaport, “Wireless Communications: Principles and Practice.” Prentice Hall, 2002.
[7] ORiNOCO Classic Gold PC Card http://www.proxim.com/
[8] The Network Simulator
ns2,http://www.isi.edu/nsnam/ns,2011.
[9] Mathias Grossglauser and David Tse, “Mobility increases the capacity of ad-hoc wireless networks”, IEEE/ACM Transactions On Networking, Vol. 10, No. 4, August 2002, pp.477-486.
[image:6.595.54.284.541.659.2]