An Efficient Medical Data Classification based on Ant
Colony Optimization
Jyotsna Bansal
M. Tech Research scholar CSE dept., BUIT
Bhopal, India
Divakar Singh
Head of CSE dept., BUIT Barkatullah University,
Bhopal, India
Anju Singh
Asst. Prof. IT dept., BUIT Barkatullah University,
Bhopal, India
ABSTRACT
In the case of different diseases classification is an important aspect so that one can find the infected set efficiently. In this paper three different dataset named Leukemia, Lung Cancer and Prostate from the UCI machine learning repository are considered and apply efficient association based ant colony optimization for improving the classification accuracy. In our approach one can select the dataset. The data set has been refined according to the attributes. Then final data set is achieved on which we apply the next inabilities. The maximum threshold will be determined by finding the support value. So the support values are fetched and according to the support value, it will be categorized in two different parts that is relevant or irrelevant. In our case it is 0.5. If the set crosses the maximum threshold then it will be qualify for the final set otherwise it is discarded. Then ACO mechanism has been applied on the final dataset to find the classification accuracy. Our results show the effectiveness of our approach.
General Terms
Leukemia, lung cancer, prostate
Keywords
Classification, Clustering, Feature selection, ACO
1.
INTRODUCTION
Till now there are lot of studies had been made in the direction of classification and clustering like weighted voting (WV) [1], k-nearest neighbor (k-NN)[2], support vector machine (SVM) [3], and Fisher’s linear discriminate analysis (LDA) [4] . but these are not effective for better predicting the cases like whether a patient has got a particular disease or not [5],[6][7].
There are several studies are done for data portioning, data management and way of retrieval [8][9][10]. Better classification is not achieved by a single algorithm but it can be possible if it can be done by an hybrid platform. There are several algorithms which are also using genetic and fuzzy set are also applied in these areas [11]. Combine the fuzzy and search capabilities of Genetic Algorithms (GAs) may improve the optimal fuzzy rule and improve the rule generation also [12].
Association based classifier are also used and provide some good utility. Data mining can be used for better retrieval of the data [13][14]. Means data mining can exploits the data in any environment so the data retrieval is easy. So then there is need of better optimization so that we can able to find the good rules which are showing the classification accurately. In this stage Ant Colony Optimization (ACO) technique can be used for this improvement [15][16].
The next sections are divided in the following manner. Literature Review are shown in section 2,proposed approach is shown in section 3,discuss the result analysis which in section 4,section 5 shows the conclusion and finally result analysis are given.
2.
LITERATURE REVIEW
biomarkers. They address this problem by introducing a comprehensive framework that incorporates the two stages of the process, namely feature selection and sample classification. and sure thing, lofty dimensionality in interpretation of the in the midst of genes and brief expanse of samples distinguishes gene parturition text as an create call for the trifling frame of reference Reducing the dimensionality is unembellished to efficiently analysis the samples for effective knowledge discovery.
3.
PROPOSED ALGORITHM
In this approach, first select the data set as shown in figure 1. Based on the data set it is first categorize in two parts. In the first part the support greater than 0.5 are present and in the second part store the values which are less than 0.5. The selected support in the second part is first evaluated and optimize by ACO. If some patterns observed which are relevant according to the minimum support value. Then after the final iteration we will put those set in the first set. Then optimize the dataset by ACO again but now with the first part including the set which are found positive in the second part. Then better classification results will be achieved after 8 iteration which will be shown in the result section. The dataset had been taken from UCI machine learning repository.
Algorithm: ACO based Classification
Input: IS (is1, is2……isn) Output: OS (sv1, sv3…..svn) Terminology:
NRSNon relevant set RS Relevant Set IS Input Set OS Output Set IT Initial trail n Number of Agents EVevaporation value FS Final set
Step 1: IS= {i1, i2….in}
Step 2: Apply the k-group on IS and form the representative block.
Step 3: First consider the NRS set
3a. Assign each values as nrs1, nrs2…….nrsn.
3b. for i=1 to 5 do
IT=∑nrs1+nrs2+…..+nrsn/n EV={0.2,0.4,0.6,0.8} If(i==1)
IT1=IT If(i==2)
IT2=IT-EV1(0.2) If(i==3)
IT3=IT-EV1(0.4) If(i==4)
IT4=IT-EV1(0.6) If(i==5)
IT5=IT-EV1(0.8) If(ITn>ITn-1) ITn-1=ITn
Step 4: if(nrs1,nrs2….nrsn>=0.5) RS={rs1,rs2……..nrs1……nrsn}
Step5: .for i=1 to 8 do IT=∑nrs1+nrs2+…..+nrsn/n EV={0.2,0.4,0.6,0.8}
When moving from first neighbor to second neighbor node the agent can update the pheromone trails.
If(i==1) IT1=IT If(i==2)
IT2=IT-EV1(0.2) If(i==3)
IT3=IT-EV1(0.4) If(i==4)
IT4=IT-EV1(0.6) If(i==5)
IT5=IT-EV1(0.8) If(i==6)
IT5=IT-EV1(0.8) If(i==7)
IT5=IT-EV1(0.8) If(i==8)
IT5=IT-EV1(0.8) If(ITn>ITn-1) ITn-1=ITn
Step 6: The FS will be achieved and we can calculate the classification.
The above algorithm shows the whole working scenario of our proposed work. By this algorithm firstly divide the dataset into k parts. In our case it is 2. Then apply ACO in the irrelevant set and search for the relevancy. If any of the item set found relevant. It will be added in the relevant set. Then finally ACOwill be applied on the relevant data set to find the accuracy.
The steps are following:
1) Initialize the initial weight of the agents.
2) Then each agent will start with some random assigned values.
3) Then we perform the summation of all the support value and divide it by the numbers which will be subtracted by the evaporation value.
4) If the new value is greater than the global optimum value then we replace the previous value with the updated value, otherwise it remain same.
Start
Dataset Selection
Support<0.5 Categorization
ACO with 5 Iteration
Support>0.5
R1
ACO with 8 Iteration
Final Classification
Fig 1: Flowchart
4.
RESULT ANALYSIS
In our proposed approach three data set are used as shown in table 1, table 2 and table 3. Optimized format are shown in table 4, table 5 and table 6. The classification accuracy is shown in figure 2 and the overall accuracy is shown in figure 3. comparison with the existing techniques also shown in table 7. It shows the effectiveness of our approach.
[image:3.595.315.544.260.427.2]The advantages apart from play go infirmity as a bequeathed plague at cellular equal is different from type to type. For holder, the correctness of colon gene habituated is further than others. Allow for , deriving near predisposed to gene sets company a insubordinate function, indebted shriek solitarily to text mining techniques but rather the relatively small number of samples available for the analysis
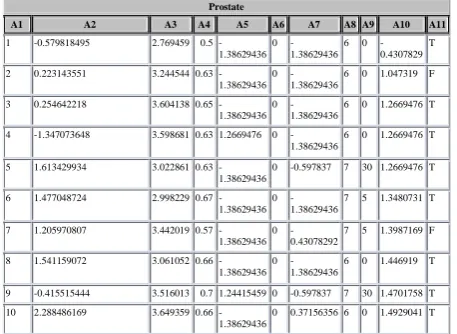
Table 1: Dataset1
Prostate
A1 A2 A3 A4 A5 A6 A7 A8 A9 A10 A11 1 -0.579818495 2.769459 0.5
-1.38629436 0
-1.38629436 6 0
-0.4307829 T
2 0.223143551 3.244544 0.63 -1.38629436
0 -1.38629436
6 0 1.047319 F
3 0.254642218 3.604138 0.65 -1.38629436
0 -1.38629436
6 0 1.2669476 T
4 -1.347073648 3.598681 0.63 1.2669476 0 -1.38629436
6 0 1.2669476 T
5 1.613429934 3.022861 0.63 -1.38629436
0 -0.597837 7 30 1.2669476 T
6 1.477048724 2.998229 0.67 -1.38629436
0 -1.38629436
7 5 1.3480731 T
7 1.205970807 3.442019 0.57 -1.38629436
0 -0.43078292
7 5 1.3987169 F
8 1.541159072 3.061052 0.66 -1.38629436
0 -1.38629436
6 0 1.446919 T
9 -0.415515444 3.516013 0.7 1.24415459 0 -0.597837 7 30 1.4701758 T 10 2.288486169 3.649359 0.66
-1.38629436
0 0.37156356 6 0 1.4929041 T
Table 2: Dataset2
LEUKEMIA
Sample ALL_AML BM_PB TB_Cell FAB Date1 Gender Blast Tratment PS Response
1 ALL BM B-cell 09/04/96 M 1 DFCI
2 ALL BM T-cell M 0.41 DFCI
3 ALL BM T-cell M 0.87 DFCI
4 ALL BM B-cell 0.91 DFCI
5 ALL BM B-cell 0.89 DFCI
6 ALL BM T-cell M 0.76 DFCI
7 ALL BM B-cell 03/25/83 F 0.78 DFCI
8 ALL BM B-cell F 0.77 DFCI
9 ALL BM T-cell M 0.89 DFCI
Table 3: Dataset3
Lung
ID Field1 Field2 Field3 Field4
1 NODE1X ARRY71X ARRY63X 0.9398193359375
2 NODE2X ARRY48X ARRY42X 0.880126953125
3 NODE3X ARRY25X ARRY24X 0.86590576171875
4 NODE4X ARRY66X ARRY65X 0.8321533203125
5 NODE5X ARRY2X ARRY1X 0.816650390625
6 NODE6X ARRY62X ARRY61X 0.8052978515625
7 NODE7X ARRY64X NODE2X 0.8026123046875
8 NODE8X ARRY59X NODE7X 0.7900390625
9 NODE9X ARRY15X ARRY14X 0.7698974609375
[image:4.595.118.216.318.503.2]10 NODE10X ARRY47X ARRY46X 0.75811767578125
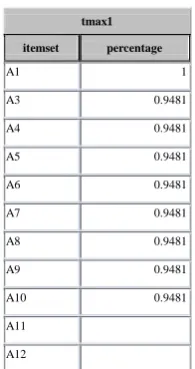
Table 4: Optimized From Dataset1
tmax1 itemset percentage
A1 1
A3 0.9481
A4 0.9481
A5 0.9481
A6 0.9481
A7 0.9481
A8 0.9481
A9 0.9481
A10 0.9481
A11
A12
Table 5: Optimized From Dataset2
Table 6: Optimized From Dataset3
tmax3 itemset percentage
A1 0.9511
A2 0.9511
A3 0.9511
A4 0.9511
A5 0.9511
A6 0.9511
A7 0.9511
A8 0.9511
A10 0.9511
A11
A12
Fig 2: Classification Accuracy
Figure 3: Overall Detection Accuracy Table 7: Classification Accuracy Table
Name\Technique SVM Naïve
Bayes
Associative Classifier
ACO based classifier
Leukemia 95 93 96 100
Lung 81 91 93 34
Prostate 90 76 89 100
tmax2 itemset percentage
A1 0.94
A2 0.88
A3 0.87
A4 0.83
A5 0.82
A6 0.81
A7 0.8
A8 0.79
A9 0.775
A10 0.775
A11
5.
CONCLUSION
A Hybrid framework is presented in this paper. The framework consists of association and ant colony optimization. Our work direction is in the way for better classification considering different dataset. It has been better explained with results also. Our results show the effectiveness of our approach. In future one can extend this work on other dataset also and check the effectiveness.
6.
ACKNOWLEDGMENTS
I take this opportunity to thanks Dr. Divakar Singh (HOD, CSE Department, BUIT Bhopal) for accepting me to work under his valuable guidance, closely supervising this work over the past few months and offering many innovative ideas and helpful suggestions. His valuable advice and support, in spite of his busy schedule have really been an inspiration and driving force for me. He has constantly enriched my raw ideas with his experience and knowledge.
I would like to give thanks to Dr. Anju Singh (Asst. Prof. IT) for her valuable guidance and motivation.I also thank Dr. D. C. Gupta, Director BUIT, BU, Bhopal for extending all the help and cooperation during my dissertation work.
I thank my almighty parents, staff members of CSE and colleagues, and friends for their physical and moral support without which this assignment would not be possible. Last but not the least, I must express my heartfelt thanks to my husband Mr. Yatendra Singh for his valuable supportfor successful completion of the work and for their understanding, endless patience, cooperation and constant encouragement when it was most required.
7.
REFERENCES
[1] T.R. Golub, D.K. Slonim, P. Tamayo, C. Huard, M. Gaasenbeek, J.P. Mesirov, H. Coller, M.L. Loh, J.R. Downing, M.A. Caligiuri, C.D. Bloomfield, and E.S. Lander, “Molecular Classification of Cancer: Class Discovery and Class Prediction by Gene Expression Monitoring,” Science, vol. 286, no. 5439, pp. 531-537, 1999.
[2] L. Li, C.R. Weinberg, T.A. Darden, and L.G. Pedersen, “Gene Selection for Sample Classification Based on Gene Expression Data: Study of Sensitivity to Choice of Parameters of the GA/ KNN Method,” Bioinformatics, vol. 17, no. 12, pp. 1131-1142, 2001.
[3] T.S. Furey, N. Cristianini, N. Duffy, D.W. Bednarski, M. Schummer, and D. Haussler, “Support Vector Machine Classification and Validation of Cancer Tissue Samples Using Microarray Expression Data,” Bioinformatics, vol. 16, no. 10, pp. 906-914, 2000.
[4] M.M. Xiong, L. Jin, W. Li, and E. Boerwinkle, “Tumor Classification Using Gene Expression Profiles,” Biotechniques, vol. 29, pp. 1264-1270, 2000.
[5] Y. Wang, I.V. Tetko, M.A. Hall, E. Frank, A. Facius, K.F.X. Mayer, and H.W. Mewes, “Gene Selection from Microarray Data for Cancer Classification—A Machine Learning Approach,” Computational Biology and Chemistry, vol. 29, no. 1, pp. 37-46, 2005.
[6] M. Xiong, X. Fang, and J. Zhao, “Biomarker Identification by Feature Wrappers,” Genome Research, vol. 11, pp. 1878-1887, 2001.
[7] Yukyee Leung; Yeungsam Hung, "A Multiple-Filter-Multiple-Wrapper Approach to Gene Selection and Microarray Data Classification," Computational Biology
and Bioinformatics, IEEE/ACM Transactions on. vol.7, no.1, pp.108,117, Jan.-March 2010.
[8] JogendraKushwah, Divakar Singh,”Classification of Cancer Gene Selection Using Random Forest and Neural Network Based Ensemble Classifier”,International Journal of Advanced Computer Research (IJACR), Volume-3 Number-2 Issue-10 June-2013.
[9] Dubey, A.K.; Dubey, A.K.; Agarwal, V.; Khandagre, Y., "Knowledge discovery with a subset-superset approach for Mining Heterogeneous Data with dynamic support," Software Engineering (CONSEG), 2012 CSI Sixth International Conference on , vol., no., pp.1,6, 5-7 Sept. 2012.
[10]Sachinsohra, NarendraRathod, “An Improved Single and Multiple association Approach for Mining Medical Databases”,International Journal of Advanced Computer Research (IJACR), Volume 2, Number 2,June 2012. [11] O. Cordón, F. Gomide, F. Herrera, F. Hoffmann, and L.
Magdalena, “Ten years of genetic fuzzy systems: current framework and new trends,” Fuzzy Sets Syst., vol. 141, pp. 5–31, 2004.
[12]F. Hoffmann, “Combining boosting and evolutionary algorithms for learning of fuzzy classification rules,” Fuzzy Sets Syst., vol. 14, pp. 47–58, 2004.
[13]Dubey, A.K.; Shandilya, S.K., "A comprehensive survey of grid computing mechanism in J2ME for effective mobile computing techniques," Industrial and Information Systems (ICIIS), 2010 International Conference on , vol., no., pp.207,212, July 29 2010-Aug. 1 2010.
[14]Dubey, A.K.; Shandilya, S.K., "Exploiting Need of Data Mining Services in Mobile Computing Environments,"
Computational Intelligence and Communication
Networks (CICN), 2010 International Conference on , vol., no., pp.409,414, 26-28 Nov. 2010.
[15]Anshuman Singh Sadh, NitinShukla,” Association Rules Optimization: A Survey”, International Journal of Advanced Computer Research (IJACR), Volume-3 Number-1 Issue-9 March-2013.
[16]Anshuman Singh Sadh, NitinShukla, “Apriori and Ant Colony Optimization of Association Rules”,International Journal of Advanced Computer Research (IJACR), Volume-3 Number-2 Issue-10 June-2013.
[17]Blaschke C., Oliveros, J.C. and Valencia, A., “Mining [31] Patrick C. H. Ma and Keith C. C. Chan,” Incremental Fuzzy Mining of Gene Expression Data for Gene Function Prediction”, IEEE Transactions on Biomedical Engineering, VOL. 58, NO. 5, MAY 2011. [18]Debahuti Mishra and BarnaliSahu, “A Signal-to-noise
Classification Model for Identification of Differentially Expressed Genes from Gene Expression Data”, IEEE 2011.
[19]PradiptaMaji and Chandra Das,” Relevant and Significant Supervised Gene Clusters for Microarray Cancer Classification”, IEEE Transactions on Nano bioscience, Vol. 11, No. 2, June 2012.
Swarm Optimization”, International Journal of Advanced Computer Research (IJACR) Volume-2 Number-4 Issue-7 December-2012.
[21]Jian-Bo Yang and Chong-Jin Ong,”An Effective Feature
Selection Method via Mutual Information
Estimation”,IEEE Transactions on Systems, Man, and Cybernetics—Part B: Cybernetics, Vol. 42, No. 6, December 2012.
[22]Xiao Zhang, AichenLi,You Zhang, Yongpeng
Xiao,”Validity of Cluster Technique for Genome Expression Data”, IEEE 2012.
[23]Shang Gao, Omar Addam, AlaQabaja,
AbdallahElSheikh, Omar Zarour, Mohamad