Improving Performance in Cloud using Multi-Job
Scheduling based Group Discovery Algorithm
Nandhini A.
PG Scholar
Sri Ramakrishna Engineering College, Tamil Nadu, India
Saravana Balaji B.
Assistant Professor
Sri Ramakrishna Engineering College, Tamil Nadu, India
ABSTRACT:
Cloud computing is a large model change of computing system. It provides high scalability and flexibility among an assortment of on-demand services. To imporve the performance of the multi-cloud environment in distributed application might require less energy efficiency and minimal inter-node latency correspondingly. The major problem is that the energy efficiency of the cloud computing data center is less if the number of server is low, else it increases. To overcome the energy efficiency and network latency problem a novel energy-efficient particle swarm optimization representation for multi-job scheduling and Latency representation for the grouping of nodes with respect to network latency is proposed. Design a realistic particle swarm optimization algorithm for the cloud servers and construct an overall energy competence based on the purpose of the servers and calculation of fitness value for each cloud servers. Also, in order to speed up the convergent speed and improve the probing aptitude of our algorithm, a local search operative is introduced. Finally, the experiment demonstrates that the proposed algorithm is effectual and well-organized.
Keywords
Cloud Computing, Network Latency, Energy Efficiency, Particle Swarm Optimization (PSO) and Multi-Job Scheduling.
1.
INTRODUCTION
Cloud computing becomes a one of important rising and an empowering technology in now a days, because which through us to consdier beyond what is possible. These technologies related services are offered by general 3-tier architecture. The complete architecture of the cloud technology performed based on the user request to service the requirments or perform scheduling based on user required task or job.In order to perform scheduling strategy it incorporates of the resource provider, the service.
Providers and the consumers are the Service provider requires particular new hardware resources or resource provider to perform service request given by the user. It becomes the one of the technology [1] for empowering well-situated, on-demand network admission to a public collection of specific cloud computing resources ,that can be quickly provisioned and delivered with less organization effort.
According to the current CEMS project from amazon’s [2], amortization schedule for 3-years and amortization schedule for 15 -years are crosspodingly used for servers. In other words, the largest speculation to construct data centers for cloud computing is not simply to obtain millions of server equipment, but also to acquire the distribution and cooling infrastructure and to compensate the bill for energy utilization of every one of these facilities.
In order to solve these both network latency and energy efficiency difficulties a latency and particle swarm optimization based energy-efficient multi-job scheduling is proposed to supports both the problems. This effort mostly focuses on how to develop the energy efficiency and decrease the network latency of servers during suitable scheduling strategies. Taking complete concern of the association among the performance and energy utilization of servers, network latency for energy efficiency proposes a new particle swarm optimization based energy-efficient multi-job scheduling model based on the cloud environment, MapReduce and give its equivalent particle swarm optimization algorithm. Latency based is used model to grouping the nodes with smallest inter-node latency together. This algorithm fulfills all the necessities mentioned in the problem statement. The network latency algorithm is moderately able to group the nodes with the less obtainable latency information and make equally selected groups with negligible communication overhead with less energy efficiency in cloud environment. But, the requirement’s in the existing methods that does not satisfied in one or more condition. But none of them fulfills all of the requirements. Proposed work fulfills all the requirements as mentioned above. The whole work of the paper is organized as below the section 2 study the network latency and energy efficiency problem related methods, section 3 latency and particle swarm optimization based energy-efficient multi-job scheduling for group discovery algorithm, section 4 experimental results were measured and finally section 5 concludes the result.
2.
RELATED WORK
Clustering or grouping of the nodes in the cloud environment has a several characteristics is referred to as community detection. Community, group, or cluster detection comprise be completed for various areas and fields, together with internet [3], WWW [4], biological network [5], extract network [6], graph theory [7] and so on. Dissimilar algorithms have been proposed to modify to the requirements of the regulation. The majority of these algorithms are based on grouping of nodes on the foundation of association calculation for an exacting node.
source cloud middle-ware, which enables the consumer to accomplish its tasks on a group or cloud infrastructure.
Anderson et al. [9] developed a Local spectral partitioning algorithm for partitioning the cloud operations. It is one of the types of graph partitioning algorithm and it use page rank vector to attain its partitioning procedure for operators. They expected to decrease the conductance in their algorithm. It can cluster the nodes on the beginning of connection assessment and generate equally restricted groups. It also does not necessitate an algorithm to run every time, whenever you like a procedure demands for a cluster.
Lang et al. [10] also presented a graph partitioing algorithm Flow-based Metis+MQI .The main aim of the algorithm is to increase the conductance of graph cuts. They have shared MQI with Metis to achieve a heuristic graph partitioner to discover the outcome. It can cluster the nodes on the beginning of connection value and construct equally restricted groups.
Garcia et al. [11] presented a Hierarchical compact algorithm and hierarchical star algorithm for measuring the group nodes collection; it is based on universal structure for agglomerative hierarchical clustering. In which they experienced and compared these algorithms. The structure is based on graphs. They attain the dissimilar hierarchical agglomerative clustering algorithms starting this structure by using dissimilar measures.
To decrease the energy utilization of data centers and recover energy efficiency, numerous scholars have completed a number of associated researches, such as literatures [12-16]. Decrease energy addicted by cooling scheme. For instance, you preserve to use Google’s “free cooling” approach, heat of each servers from free cooling mode are removed by using low heat ambient air. Google states that still there is no specfic cooling equipment avaliable for data centers in Belgium.
According to the success of google engineers, the climatic condtions of the belgium support free cooling approximately year-round, with temperatures increasing higher than the suitable assortment for free cooling concerning seven days per year. Improve the energy efficiency [17] of servers are responsive with the aim of low energy consumption of a server is mostly outstanding to its idle status caused by low CPU consumption.
3.
LATENCY AND PARTICLE
SWARM OPTIMIZATION BASED
ENERGY-EFFICIENT MULTI-JOB
SCHEDULING FOR GROUP
DISCOVERY ALGORITHM
In existing network latency grouping algorithm doesn’t add the energy efficiency conception in all stages of group discovery algorithm, so it becomes more energy consumption with less network latency to overcome the problem, a proposed work tradeoff among energy consumption and network latency for group discovery algorithm. The basics of the proposed work are grouping the similar nodes with less inter-node latency and less energy utilization for every service provider (SP). In the initial stage of cloud scheduler, it makes the decision for scheduling based on the grouping information obtained from network latency and PSO based energy efficiency multi-job scheduling algorithm. In this resolution, it is reasonably proficient to cluster the nodes with the smallest obtainable latency and enegry infromation results from
PSOBEMJS ( ). Latency and energy information is accessible only for those nodes, which comprise done several communications through other nodes. Thus the sensible result of which heuristically performs the combination decision on incomplete latency and energy information.
The algorithm runs for each and every time to find the less network latency and minumum energy efficiency also evaluated using multi job scheduling algorithm in same intiliazation phase. This latency and energy efficiency is compared to a threshold, PMU and group threshold value, for making the decision to group the similar nodes. The iteration of the algorithm is performed when it is equals to the number of nodes with number of times. The algorithm has three dissimilar phases; initialization, configuration and reconfiguration. Initialization phase is dependable to place the situation for the algorithm implementation. Configuration phase is dependable to find out the groups, it is the major core part of the phase. In detail it is the concrete group discovery phase. Final phase of the algorithm is Reconfiguration phase. It group the node which maynot be grouped with other nodes than the nodes grouped by configuration phase. Before going more into the details of these phases, first introduce the energy efficiency algorithm that are going to be used in group discovery algorithm.
Improving the energy effectiveness of cloud servers, the Power usage effectiveness (PUE) of data centers can be improved. Though, this energy utilization problem cannot be easily solved by using general load balancing between the servers consequently while to formulate all the servers CPU utilization as an alternative, there exists an best performance and energy peak for each server [18]. Energy utilization per task is inclined by the CPU consumption of servers other than, in order to make simpler the representation, simply consider the impact of CPU utilization. While the CPU utilization is small, power of each server is not mentioned effectively and therefore the energy efficiency for each task is high. In other hand while the CPU utilization is high as well as the energy utilization of each server is high, due to the contest for resources between tasks, it leads to degradation of performance and more execution time per task. In previous work the variation of energy for each task is measured by using “U-shaped” curvature with CPU utilization. So it can be understood that the servers accomplish the optimal energy efficiency when all servers consecutively at its best possible performance. Get this best optimal result of enery efficiency for each server, first give the major work related description of the energy-efficient multi-job scheduling difficulty and then build its matching particle swarm optimization (PSO) algorithm.
The scheduling procedure of the algorithm considers the Nservers for each data center. Consider the present utilization of the CPU resources for each server k is denoted as CSk and
its best optmial values of CPU utilization are COk, where k =
1,2, … … . N. If there are J jobs to perform for each cloud server A = A1, … … . Aj necessitate being process and the
input server data for each job Aq is Dq where q = 1,2, … … . J. The input data file of each and every cloud server data Dq determination is separated into mq equal splits with
each size, consequently present be m = Fq=1mq splits, which
are denoted s D = D1, D2, … … . . DF = {d1, d2, … … . . dm}. It
storage space position of each split, and the constituent pijindicates the storage space position of split di, somewhere
integer pij∈ 1, N , i = 1,2, … … . . m denoted the nodes and j = 1,2,3 … …the corresponds to the MapReduce structure, know that every input data Dq determination to be procedure
by map and reduce process, it is represented as mqand rq
with less CPU utilization for map and reduce process, it is also represented as CMq and CRq.
The major difficulty of the process is how to assign the job to each and every split of data center for N server with less energy efficiency, for that purpose need to convert the map and reduce task data into vector form of representation that is v = Fq=1mq+ Fq=1rq. The vector representation of data
center is converted into scheduling task with current node and NeighborNode S = (s1, s2, … … si, … … . sv) to represent the completed task of scheduling procedure, and the ith constituent of vector S indicate that task i is assigned on server si where 1 ≤ si ≤ N and i = 1, 2, . . . , v. Traversing
throughout the scheduling process S and achieve the set of map and reduce results for each and every job Aq which are
assigned on server k, it is denoted as Mqk and Rkq,
correspondingly, where k = 1, 2, . . . , N and q = 1, 2, . . . , J Let NMqk= |Mqk| and NRqk = |Rqk|. Here give the PSO
optimization model for the multi-job scheduling difficulty with energy efficiency based on MapReduce structure for cloud computing
min Nk=1 COK− CSK+ Fq=1(NMKq× CMq) +
F (NRKq ×
q=1
CRq 2
(1)
satifies that for scheduling schema S,
si∈ pi1, pi2pi3 for i = 1,2, … … . m
si ∈ 1, N for i = m + 1, m + 2, … … v (2)
NMqK= si|si= k, i = q−1j=0 mj+ 1, q−1j=0 mj+
2 , … , q−1j=0 mj+
mq (3)
where mo= 0, k = 1,2, , , , N, q = 1,2, … F
NRqK= si|si = k, i = m + q−1j=0 rj+ 1, q−1j=0 rj+
2 , … , q−1j=0rj+
rq (4)
where ro = 0, k = 1,2, , , , N, q = 1,2, … F
CSk+ Fq=1(NMKq× CMq) + Fq=1(NRKq ×
CRq) ≤
1 5
where k = 1,2, , , , N, CMq ∈ 0,1 , q = 1,2, . F
The objective funtion of the PSO algorithm needs to calculate the CPU utilization after scheduling and their optimal points. Equation (2) express to facilitate if there is map tasksi is
assigned to server si and then it stores the corresponding data
of this map tasksi.These types of scheduling schema avoid a
large-scale data progress by not only reducing the bandwidth, but also map and process the data in efficient manner. Equation (3) and (4) compute the number of map tasks NMKq and reduce tasks NRKq of job Aq which are assigned to
server k. Equation (5) denotes to utilization of CPU for any server must not go beyond earlier than and following the task scheduling.
A particle swarm optimization (PSO) is the general comparable to a behaivour of fish or bird moving in dimensional search or investigation search space. Bases on the individuality of this energy efficient problem, agree to the integer coding, convert the map and reduce task data into vector form of representation that is v = Fq=1mq+ Fq=1rq
including 𝑚 = 𝐹𝑞=1𝑚𝑞 map tasks and 𝑟 = 𝐹𝑞=1𝑟𝑞 reduce
tasks. The intialization of every one particle is the to consider the tasks to be scheduled with vector S = s1, … . . sv as an individual to represent a scheduling scheme S indicate that taski is assigned on serversi. All particles have fitness values
demonstrating their performances of each and every server K and velocities which straight the journey of particles. Each particle location of each server energy efficiency best values are inclined by together both local and global best energy efficiency optimial results, it is referred to as pbest , gbest. Therefore particles have a tendency to fly towards an improved best energy efficiency exploration area throughout the search procedure. A particle position on the search freedom is specified by two basics, namely its velocity and position, which are updated in each and every generation as follows.
3.1 Energy efficiency particle swarm
optimization based energy-efficient
multi-job scheduling algorithm PSOBEMJS ( )
Step 1: Initializing the particles with scheduling vector S = s1, … . . sv and mapreduce functions NRqK and NMKq let
NMKq = 0 and NRqK= 0 where k = 1,2. . N and q = 1,2, . . q
empty set Mk and Rk
Step 2: For i = 1,2, … … … . N where N is the size of the paritcles that corresponds to the scheduling vector. For each element si of individual S set k = si and m0= 0
Step 3: For a job Aq where q = 1,2, … … J
3.1. If i = q−1j=0mj+ 1, j=0q−1mj+ 2, … … . . q−1j=0 mj+
mq , NMKq plus one and put i into set Mk 3.2. Else
3.3. If
i = m + q−1j=0rj+ 1, j=0q−1rj+ 2, … … . . q−1j=0rj+
rq , NRKq plus one and put i into set Rk
Step 4: For j = 1,2, , , , K where k is the number of servers and randomly initializes frequency to the servers
Step 5: Initialize a population of particles with random positions and velocities V i in the search space.
Step 6: Initialize the local best energy efficiency as p𝐵𝑒𝑠𝑡 of each scheduling vector
pbest i = Si
Step 8: Initialize the Global Best particle (gBest) with the best one among N the particles: g𝐵𝑒𝑠𝑡 = Best particle found in Si
Step 9: End For
Step 10: Add the no dominated solutions found in S into objective function in step (7)
Step 11: Initialize the iteration number 𝑡 = 0
Step 12: Repeat until 𝑡 > 𝐺 (𝐺 is the maximum number of iterations)
12.1.for 𝑖 = 1,2, … … … . 𝑁
12.2.Randomly select the global best particle for 𝑆𝑖
from the map reduce vector v store its position in gBest.
12.3.Calculate the new velocity 𝑉[𝑖] according to following equation
𝑉𝑖𝑘+1= 𝜔𝑉𝑖𝑘+ 𝑐1𝑟1 𝑝𝑏𝑒𝑠𝑡𝑖− 𝑆𝑖𝐾
+ 𝑐2𝑟2 𝑔𝑏𝑒𝑠𝑡 − 𝑆𝑖𝐾
𝑆𝑖𝑘+1= 𝑆𝑖𝑘+ 𝑉𝑖𝑘+1
12.4.Compute the new position of 𝑆𝑖according to
following equation
𝑉𝑖𝑘+1= 𝑉𝑖𝑘+ ((𝑅1⨂ 𝑝𝑏𝑒𝑠𝑡𝑖⊖ 𝑆𝑖𝐾 ⨁(𝑅2⊗
𝑔𝑏𝑒𝑠𝑡 ⊖ 𝑆𝑖𝐾 𝑆𝑖𝑘+1= 𝑆𝑖𝑘⨁𝑉𝑖𝑘+1
Step 13:𝑖𝑓 𝑡 < 𝐺 ∗ 𝑃𝑈𝐸 then (PUE is the Power usage effectiveness) Perform mutation on 𝑆𝑖
Step 14: Find best 𝑆𝑖
Step 15: End For
Step 16: Update the personal best solution of each particle 𝑆𝑖
Step 17: if 𝑆𝑖≤ 𝑝𝑏𝑒𝑠𝑡𝑖∨ 𝑆𝑖~𝑝𝑏𝑒𝑠𝑡𝑠𝑖 then Then 𝑝𝑏𝑒𝑠𝑡𝑠𝑖= 𝑆𝑖
update current solution
Step 18: Add non relevant scheduling task to reduce 𝑅𝑘 Step 19: if 𝑆𝑖≠ 𝑥 ∀ 𝑥 ∈ 𝑆 Then 𝑆 = 𝑆 ∪ 𝑆𝑖
Step 20: Remove all particles dominated by 𝑆𝑖 in S
𝑆 = 𝑆 − {𝑦 ∈ 𝑆|𝑌 < 𝑆𝑖}
Step 21: If the archive is full then randomly select the article to be replaced from map reduce with scheduling task 𝑆𝑖with
respect to 𝑁𝑅𝐾𝑞 and 𝑁𝑀𝐾𝑞
Step 22: If the stopping criterion is met step 12, then output 𝑔𝐵𝑒𝑠𝑡 and its objective value; otherwise, go to Step (6) Step 23: Return the best result
Power usage effectiveness (PUE) is used to evaluate the energy efficeincy of each data and it is the ration of sum of all power used by data center delivered to cloud computing equipment. It is to determine of how professionally a processor data center use its power:
𝑃𝑈𝐸 =𝑇𝑜𝑡𝑎𝑙 𝑓𝑎𝑐𝑖𝑙𝑡𝑖𝑦 𝑛𝑢𝑚𝑏𝑒𝑟 𝐼𝑇 𝑒𝑞𝑢𝑖𝑝𝑚𝑒𝑛𝑡 𝑝𝑜𝑤𝑒𝑟
Then now proceed how the energy efficiency concept is performed for each and every phase of the group discovery algorithm both energy efficiency and network latency .The procedure of these three phase as follows:
3.1.1 Initialization
Procedure definition:CheckForGroupableToVisitNodeRoot (VisitNodem, NeighborNode),
CheckForEnergyEfficiency (VisitNodem, NeighborNode) from PSOBEEMJS( )
if sumOfLatency(neighborOfVisitNode,rootOfVisitNode) > groupThershold and sumOfLatency(neighborOfVisitNode,
rootOfVisitNode) > groupThreshold and if sumOfEnergyEfficiency(neighborOfVisitNode, rootOfVisitNode) < PUE then
increase moreThanGroupThresholdCounter
end
if anylatency (visitnode, neighbornode) < latency (visitNode, previous OfVisitNode) and anyenergy efficiency (visitnode, neighbornode) > latency (visitNode, previousOfVisitNode) then isVisitNodeRemovable = true
add visitnodeto tempgroup
End
3.1.2 Group Discovery Algorithm - Configuration
Phase
Data: nodes, latency, threshold, groupThreshold,enegry efficiency ,PMU
Result: Groups of Nodes with minimal inter-node latency and less energy efficiency
Initialization:
for each node in registry do
select visitNode
If numberOfneighborOfVisitNode =0 OR ( previous ofVisitNode = null &visitnode ≠ grouped ) then
create newGroup
add visitNode to newGroup
end
for each neighbourNode of visitNode do
input latency(visitNode, neighborNode),
energy(visitNode,neighborNode)
if latency(visitnode,neighbornode)threshold & energyefficiency (visitnode, neighbornode) ≤ PMU then
if neighbornode ≠ grouped then
add neighbornode into tempGroup
call_proc: checkForGroupableToVisitNodeRoot
(visitNode, neighborNode)
call_proc:CheckForEnergyEfficiency(VisitNodem, NeighborNode) from PSOBEEMJS( )
end
add neighborNode to tempGroup
iflatency(visitnode,neighbornode) ≤ latency (visitnode, neighbornode) ≤ threshold & energyefficiency (visitnode, neighbornode) ≤ PMU then
if neignbornode ≠ grouped then
create newgroup
add neighbornode to newgroup
end
end
end
checkthat the tempgroup
is group table to groupOfRootNode or not
if morethanGroupThersholdCounter ≤ regroupingIndex then
copy tempgroup to groupOfVisitNode
end
else if ThersholdCounter > regroupingIndex then
create newgroup
if is VisitNodeRemovable = true then
add visitNode to newGroup
end
copy tempGroup to newGroup
end
rank visitNode to zero end
3.1.3 Group Discovery Algorithm—
Reconfiguration Phase
:Data: nodes, groups, latency, threshold, pairLatency, prevMinLatency,PMU,Energy efficiency
Result: Groups of Nodes with minimal inter-node latency and less energy efficiency
Initialization:
for each group in registry do
PrevMinLatency ← 0, PMU ← 0
if groupSize = 1 then
for each potentialGroup in registry do
if potentialGroupSize > 1 then
pairLatency←findPairLatency(currentNode, potentialGroupLeader)
CheckForEnergyEfficiency(VisitNodem, NeighborNode) from PSOBEEMJS( )
if pairLatency ≤ threshold and (pairLatency <
prevMinLatency or prevMinLatency = 0)
if energyefficiency≤ 𝑃𝑀𝑈 then
prevMinLatency←pairLatency prevMinPMU←taskenergy //from step 22 in PSOBEEMJS( )
move candidateNode to newGroup
newGroupNumber←potentialGroup
end
end
end
end
end
update latency and energy efficiency in registry
4.
EXPERIMENTAL RESULTS
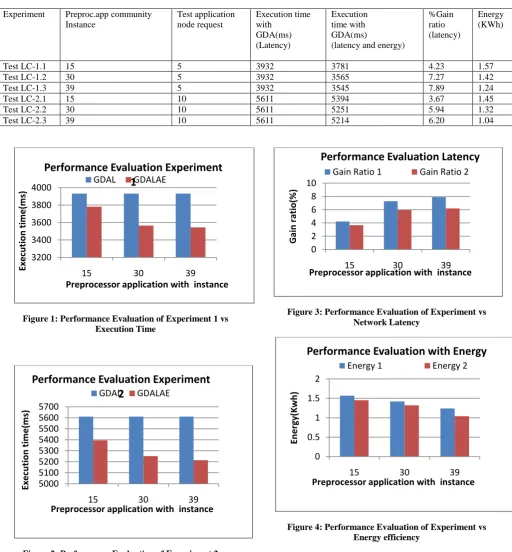
Experimental results are conducted for group discovery algorithm (GDA) with network latency and energy efficiency based on the three clusters. These clusters are physically co-located in the similar experiment excluding in the dissimilar building. Thus the network latency among their nodes and energy efficiency is not extremely high. On standard network latency among the nodes belong to the similar cluster is not a large amount dissimilar than the latency among the nodes belonging to the dissimilar clusters. This network model is moderately diverse from the Grid5000; where nodes belong to the similar site contain much smaller inter-node latency and less energy efficiency than the nodes belong to the dissimilar sites. The node allocation on the cluster was like this.
Cluster-1: Node 00–19
Cluster-2: Node 20–33
Cluster-3: Node 34–51.
Table 1: Performance Evaluation on Local Clusters
Experiment Preproc.app community Instance
Test application node request
Execution time with
GDA(ms) (Latency)
Execution time with GDA(ms)
(latency and energy)
%Gain ratio (latency)
Energy (KWh)
Test LC-1.1 15 5 3932 3781 4.23 1.57
Test LC-1.2 30 5 3932 3565 7.27 1.42
Test LC-1.3 39 5 3932 3545 7.89 1.24
Test LC-2.1 15 10 5611 5394 3.67 1.45
Test LC-2.2 30 10 5611 5251 5.94 1.32
Test LC-2.3 39 10 5611 5214 6.20 1.04
[image:6.595.41.554.84.637.2]Figure 1: Performance Evaluation of Experiment 1 vs Execution Time
Figure 2: Performance Evaluation of Experiment 2 vs Execution Time
Figure 3: Performance Evaluation of Experiment vs Network Latency
Figure 4: Performance Evaluation of Experiment vs Energy efficiency
5.
CONCLUSION AND FUTURE WORK
The energy efficiency of the each and every cloud plays a major important role to improve the overall energy utilization. This paper majorly focuses on how to reduce the energy utilization of cloud servers throughout suitable scheduling schema. Taking full contemplation of the association among the result of cloud server with less network latency and less energy utilization of servers, propose a novel network latency and energy-efficient particle swarm optimizaation based multi-job scheduling representation based on the data
3200 3400 3600 3800 4000
15 30 39
Exec
u
tion
tim
e
(m
s)
Preprocessor application with instance
Performance Evaluation Experiment
1
GDAL GDALAE
5000 5100 5200 5300 5400 5500 5600 5700
15 30 39
Exec
u
tion
tim
e
(m
s)
Preprocessor application with instance
Performance Evaluation Experiment
2
GDAL GDALAE
0 2 4 6 8 10
15 30 39
Gai
n
r
atio(%
)
Preprocessor application with instance
Performance Evaluation Latency
Gain Ratio 1 Gain Ratio 2
0 0.5 1 1.5 2
15 30 39
En
e
rg
y(K
wh
)
Preprocessor application with instance
Performance Evaluation with Energy
processing structure, MapReduce, and give the equivalent algorithm. In the meantime, propose a Particle Swarm Optimization (PSO) method for those scheduling tasks and make a general energy efficiency purpose of the servers as the fitness value of the particles. It specially target the state when do not contain entire information concerning all the inter-node latencies and energy efficient information from PSOBEEMJS algorithm. The proposed system provides a possible solution for grouping of nodes with respect towards their inter-node latency and less energy efficiency.
Proposed optimization based workflow scheduling in cloud computing is not a full-grown field. Most of the obtainable mechanism efforts reduce either the make span or cost only. Though, in future work will map to believe additional objectives such as dependability, protection in adding together to the energy utilization mean to apply our algorithm in the real cloud.
6.
REFERENCES
[1] P. Mell and T. Grance, “The NIST definition of cloud computing,” National Institute of Standards and Technology, vol. 53, no. 6, 2009.
[2] J. Hamilton, “Cooperative expendable micro-slice servers CEMS: low cost, low power servers for internet-scale services,” Citeseer.
[3] B. Karrer, E. Levina, M.E.J. Newman, Robustness of community structure in networks, Physical Review E 77 (2008) http://dx.doi.org/10.1103/PhysRevE. 77.046119.
[4] G.W. Flake, S. Lawrence, C.L. Giles, F.M. Coetzee, Self-organization and identification of web communities, IEEE Computer 35 (2007) 66–71. http://dx.doi.org/10.1109/ 2.989932.
[5] L.H. Hartwell, J.J. Hopfield, S. Leibler, A.W. Murray, From molecular to modular cell biology, Nature 402 (1999) C47–C52. http://dx.doi.org/10.1038/35011540.
[6] S. Redner, Citation statistics from more than a century, Physical Review (2004).
[7] C.T. Zahn, Graph-theoretical methods for detecting and describing gestalt cluster, IEEE Transactions on Computers C-20 (1971) 68–86. http://dx.doi.org/ 10.1109/T-C.1971.223083.
[8] S. Malik, F. Huet, D. Caromel, RACS: a framework for resource aware cloud computing, in: Proceedings of the 7th IEEE International Conference for Internet Technology and Secured Transactions, ICITST 2012, 2012.
[9] R. Andersen, F. Chung, K. Lang, Local graph partitioning using pagerank vectors, in: Proceedings of the 47th Annual IEEE Symposium on Foundations of Computer Science, FOCS’06, 2006, pp. 475–486. http://dx.doi.org/10.1109/ FOCS.2006.44.
[10]K. Lang, S. Rao, A flow-based method for improving the expansion or conductance of graph cuts, in: D. Bienstock, G. Nemhauser (Eds.), Proceedings of the 10th International IPCO Conference on Integer Programming and Combinatorial Optimization, in: Lecture Notes in Computer Science, Springer, Berlin, Heidelberg, 2004, pp. 383–400.
[11]R.J. Gil-Garcia, J.M. Badia-Contelles, A. Pons-Porrata, A general framework for agglomerative hierarchical clustering algorithms, in: Proceedings of the 18th International Conference on Pattern Recognition, ICPR
2006, 2006, pp. 569–572.
http://dx.doi.org/10.1109/ICPR.2006.69.
[12]A. Beloglazov and R. Buyya, “Energy efficient allocation of virtual machines in cloud data centers,” in Proceedings of the 10th IEEE/ACM International Symposium on Cluster, Cloud, and Grid Computing (CCGrid ’10), pp. 577–578, Melbourne, Australia, May 2010.
[13]A. Berl, E. Gelenbe, M. Di Girolamo et al., “Energy-efficient cloud computing,” Computer Journal, vol. 53, no. 7, pp. 1045–1051, 2010.
[14]R. Buyya, A. Beloglazov, and J. Abawajy, “Energy-Efficient management of data center resources for cloud computing: a vision, architectural elements, and open challenges,” Distributed, Parallel, and Cluster Computing, http://arxiv.org/abs/1006.0308/, pp. 6–17, 2010.
[15]J. Baliga, R. W. A. Ayre, K. Hinton, and R. S. Tucker, “Green cloud computing: balancing energy in processing, storage and transport,” Proceedings of the IEEE, vol. 99, no. 1, pp. 149–167, 2011.
[16]L. A. Barroso and U. H¨ olzle, “The datacenter as a computer: an introduction to the design of warehouse-scale machines,” Synthesis Lectures on Computer Architecture, vol. 4, no. 1, pp. 1–108, 2009.