Research Article
CODEN(USA) : JCPRC5
ISSN : 0975-7384
Simultaneous quantification of levosulpiride and rabeprazole in
tablet dosage form by validated normal phase high performance
thin layer chromatographic method
Pravin Devidas Pawar, Sachin Eknath Potawale, Kakasaheb Ramoo Mahadik
and Satish Yashwant Gabhe*
Department of Pharmaceutical Chemistry, Poona College of Pharmacy, Bharati Vidyapeeth
Deemed University (BVDU), Pune, Maharashtra, India
_____________________________________________________________________________________________
ABSTRACT
A simple, sensitive, accurate, precise and robust high performance thin layer chromatographic method for simultaneous quantification of Levosulpiride and Rabeprazole in tablet dosage form has been developed and validated. Chromatographic separation was carried out on Merck precoated aluminium plates with silica gel 60 F254 as the stationary phase.Optimized mobile phase used was ethyl acetate: methanol: ammonia (8.5:1.5:0.2, v/v/v). Detection wavelength was 287 nm in reflectance-absorbance mode. The retardation factors (Rf) were found to be 0.25 ± 0.02 for Levosulpiride and 0.54 ± 0.02 for Rabeprazole. Linearity range was obtained between 100 – 1000 ng band-1 and 100 - 800 ng band-1 concentration of Levosulpiride and Rabeprazole respectively. The tablet dosage form analyzed was found to contain 99.02 ± 1.32 %w/w of Levosulpiride and 101.46 ± 0.32 %w/w of Rabeprazole. The developed HPTLC method was validated as per ICH Q2 (R1) guideline. The proposed method can be applied for quality control testing of Levosulpiride and Rabeprazole in combined tablet dosage form.
Keywords: Levosulpiride, Rabeprazole, HPTLC, Validation.
_____________________________________________________________________________________________
INTRODUCTION
Levosulpiride (LSP) is an atypical antipsychotic and prokinetic agent used in indications like depression, psychosis, somatoform disorders, emesis and dyspepsia. It is selective D2 dopamine antagonists active at both presynaptic as well as postsynaptic levels [1]. Chemically it is a levo enantiomer of sulpiride; N - [[(2S) - 1 -ethylpyrrolidin-2-yl] methyl] - 2 - methoxy - 5 – sulfamoylbenzamide [2, 3]. Rabeprazole (RBP) is a proton pump inhibitor. Chemically it is 2-({[4-(3-methoxypropoxy)-3-methyl-2 pyridyl] methyl} sulfinyl) - 1H- benzimidazole [4]. It decreases gastric acid secretion by inhibiting H+/K+-ATPase enzyme system. It is indicated in duodenal ulcers and erosive or ulcerative gastro esophageal reflux disease (GERD) [5].
O
N H
O S
O O
H2N
N
(a)
N H N
S N
O
O O
[image:2.595.177.436.79.311.2](b)
Figure 1. Chemical structures of (a) Levosulpiride and (b) Rabeprazole
EXPERIMENTAL SECTION
Solvents and chemicals:
Standard Levosulpiride and Rabeprazole were kindly gifted by Wanbury Ltd. Mumbai, and Lupin Ltd. Tarapur, respectively. The formulation used in the study was Rabekind Plus manufactured by Mankind Pharma Ltd. and purchased from local market. It contains 75 mg of Levosulpiride and 20 mg of Rabeprazole per tablet. All chemicals and reagents were of analytical grade and procured from Merck specialities Pvt. Ltd., Mumbai. Double distilled water was used in the research work. Precoated silica gel 60 F254 aluminium HPTLC plates were purchased from E. Merck, Darmstadt, Germany.
HPTLC Instrumentation and Chromatographic Conditions:
Dimension of the HPTLC plates and chromatographic development chamber used in the study was 20 cm × 10 cm. Application of sample and standard drugs was carried out by using CAMAG (Muttenz, Switzerland) Linomat V sample applicator with a 100 µL (CAMAG) syringe. The spots applied were 6 mm wide and 5 mm apart. Development was carried out in previously saturated twin trough glass chamber with 20 mL mobile phase for 10 min at room temperature with solvent front of 80 mm. Plates were dried in the current of air and densitometric scanning was performed in reflectance-absorbance mode at 287 nm using Camag TLC scanner III operated by winCATS software version 1.4.4.
Preparation of standard solution for linearity
A standard stock solution of LSP and RBP was prepared separately by dissolving 10 mg of standard drug in 10 mL methanol and 1 mL of the resulting solution was further diluted to 10 mL with methanol to get final concentration of 100 µg/mL.
Preparation of standard solution for recovery study
Standard solution was prepared separately by dissolving 10 mg of standard RBP and 20 mg of standard LSP in methanol in a 50 mL volumetric flask and finally diluted up to the mark with methanol. The final concentration of LSP and RBP in the solution was 400 and 200 µg/mL, respectively.
Preparation of sample solution for recovery of LSP
Preparation of sample solution for recovery of RBP
Average weight of twenty tablets was calculated and tablets were finely powdered. Powder equivalent to 10 mg of RBP was weighed and transferred into 50 mL volumetric flask containing approximately 30 mL of methanol. Solution was sonicated for 15 min and diluted up to mark with methanol to obtain the final concentration 200 µg/mL of RBP. The solution was filtered through Whatman filter paper no.41 and resulting solution was used for the study.
Method validation
The developed method was validated for linearity, range, precision, accuracy, specificity, LOD and LOQ as per ICH Q2 (R1) guidelines [18].
Linearity and range
Linearity was evaluated by applying different concentrations six times each to the HPTLC plate in the range of 100 - 1200 ng band-1 for both LSP and RBP. Calibration curve of peak area versus concentration was plotted and data was subjected to statistical analysis such as residual analysis least square linear regression analysis and the slope, intercept and correlation coefficient for the calibration curve were estimated.
Sensitivity
Limit of detection (LOD) and limit of quantification (LOQ) were calculated to determine sensitivity as 3.3 σ/S and 10 σ/S, respectively, where σ is the standard deviation of the response (y-intercept) and S is the slope of the linearity plot.
Specificity
In specificity studies, LSP and RBP standard solutions and the marketed sample solutions were applied on a HPTLC plate. The plate was developed in the mobile phase and scanned as mentioned above. The peak purity of LSP and RBP was assessed by comparing the UV spectra of drugs at peak start, peak apex and peak end positions of the band i.e., r (start, middle) and r (middle, end).
Precision
Precision of the method was analyzed by intra and inter-day variation studies. To study intra-day variation sets of three different drug sample concentration of LSP and RBP in triplicates (400, 600 and 800 ng band-1) were spotted and analyzed on the same day. To study inter-day precision study, triplicates of above mentioned three different drug concentrations were analyzed on three successive days.
Accuracy
The accuracy of the method was evaluated by standard addition method. Samples of LSP and RBP were spiked with 80, 100 and 120 % of standard LSP and RBP.
Robustness
Robustness was studied by carrying out small, deliberate changes in the analytical conditions. The analytical conditions varied were mobile phase combination (± 0.1 mL), amount of mobile phase (± 5 %), time from band application to chromatographic development and time from chromatography to scanning (+ 10 min). One factor was varied at a time to study the variation. The robustness of the proposed HPTLC method was studied six times at concentration of 600 ng band-1 for both LSP and RBP as it lies within the range of linearity. The standard deviation of peak areas and % relative standard deviation (% RSD) were calculated for each variable factor.
Solution stability
Solution stability of LSP and RBP standard solutions (200 ng band-1) was studied at an interval of 6 hrs up to 48 h. when stored at room temperature and estimated by comparing peak areas at each time interval against freshly prepared standard solution.
RESULTS AND DISCUSSION
Selection of detection wavelength:
Figure 2. Overlain UV spectrum of Levosulpiride and Rabeprazole
Optimization of HPTLC method
To obtain the desired Rf value range (0.2 - 0.8) and minimum resolution of 1.5, different mobile phases containing various ratios of toluene, dichloromethane, n-hexane, ethanol, methanol, water, ethyl acetate, and acetone were tried. Finally, the solvent system consisting of ethyl acetate: methanol: ammonia (8.5: 1.5: 0.2, v/v/v) was selected as it gave the best results. The optimum wavelength for detection and quantitation used was 287 nm. The retardation factors (Rf) for LSP and RBP were found to be 0.25 ± 0.02 and 0.54 ± 0.02, respectively (Figure 3).
HPTLC method validation Linearity and range
[image:5.595.194.423.287.568.2]Result showed that standard drugs concentration and peak areas were found to be linear in the range of 100 - 1000 ng band-1 for LSP and 100 - 800 ng band-1 for RBP (Table 1).
Table 1: Linear regression data for the calibration curves (n = 6)
Parameters Levosulpiride Rabeprazole
Linearity rangea 100 - 1000 100 – 800
r2 0.9994 0.9993
Slope 3.181 8.627
Intercept 147.9 390.9
LODa 32.29 29.71 LOQa 97.86 90.03 Sy.xb 31.13 77.67
n - no of replicates, a Concentration in ng band-1, r2 - Square of correlation coefficient, LOD - Limit of detection, LOQ - Limit of quantitation, b - Standard deviation of residuals from line.
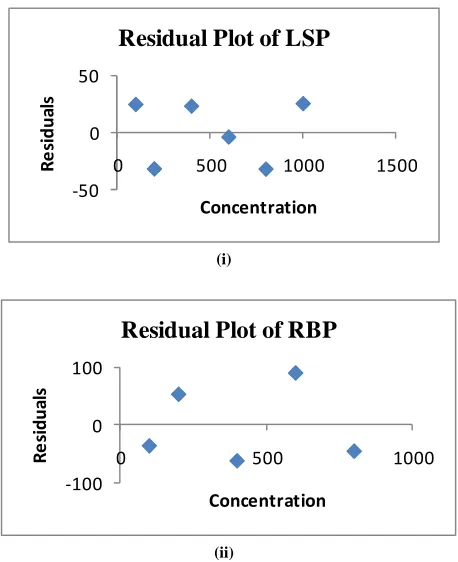
The linearity of the calibration was tested by residual analysis (a non-numerical test). The residual plot as shown in (Figure 4) showed no tendency and slope was significantly different from zero.
-50 0 50
0 500 1000 1500
R e s id u a ls Concentration
Residual Plot of LSP
(i) -100 0 100
0 500 1000
R e s id u a ls Concentration
Residual Plot of RBP
(ii)
Figure 4: Concentration versus residual plot of (i) LSP and (ii) RBP
Sensitivity
The LOD and LOQ for LSP were found to be 32.29 and 97.86 ng band-1, respectively. The LOD and LOQ for RBP were found to be 29.71 and 90.03 ng band-1, respectively.
Specificity
The peak purity for LSP and RBP was assessed by comparing UV spectrum acquired at the start (S), apex (M), and end (E) of the peak obtained from the scanning of band, that is, r (S, M) = 0.998, 0.998 and r (M, E) = 0.999, 0.998, respectively. Peak purity data showed that peaks obtained for LSP and RBP were pure.
Precision
Table 2: Intra and inter day precision (n = 3).
Drug Concentration taken a Concentration obtained a Precision obtained b
Intra day Inter day Intra day Inter day
Levosulpiride
400 396.89 395.12 0.89 1.33 600 598.69 596.38 1.05 1.43 800 782.25 779.41 0.82 1.13
Rabeprazole
400 400.78 399.93 0.54 1.28 600 584.20 588.51 0.52 1.05 800 758.15 748.58 0.79 1.41 a Concentration in ng band-1, b Precision as % RSD, RSD - Relative standard deviation.
Accuracy
Recovery for LSP and RBP was found to be 99.23 - 100.48 % w/w and 100.67 - 101.32 % w/w, respectively indicating reliability of the proposed densitometric method for simultaneous estimation of LSP and RBP in the marketed formulation used in the study (Table 3).
Table 3: Results of recovery studies (n=6)
Parameter LSP RBP
Amount Takena 400 400 400 200 200 200
Amount Addeda (%) 320 (80) 400 (100) 480 (120) 160 (80) 200 (100) 240 (120)
Amount Founda 716.40 803.85 873.24 363.44 402.69 445.79
% Recovery 99.50 100.48 99.23 100.96 100.67 101.32
SD %RSD
19.12 16.88 32.73 43.73 29.68 28.28 0.79 0.62 1.12 1.24 0.77 0.67
n - No of replicates, a Concentration in ng band-1, SD - Standard deviation, RSD - Relative standard deviation.
Robustness studies
Robustness of the proposed densitometric method showed that peak areas of interest remained unaffected by small but deliberate changes of the operational parameters (% RSD < 2) indicating robustness of the method (Table 4).
Table 4: Robustness testing (n = 6, 600 ng band-1)
Parameter Varied Peak Area±SD % RSD
Levosulpiride Rabeprazole Levosulpiride Rabeprazole
Mobile phase (ethyal acetate) composition (± 0.1 mL) 2068.70 ± 33.68 5617.75 ± 45.67 1.62 0.81
Amount of mobile phase (± 5 %) 2082.88 ± 21.89 5577.8 ± 91.09 1.05 1.63
Time from band application to chromatography (+ 10 min) 2063.98 ± 21.69 5627.66 ± 85.11 1.05 1.51
Time from chromatography to scanning (+ 15 min) 2085.91 ± 35.37 5714.28 ± 55.69 1.69 0.97
n - No of replicates, SD - Standard deviation, RSD - Relative standard deviation
Solution stability
Stability of standard solutions of LSP and RBP were assessed at room temperature for 48 h. The % RSD < 2 indicates that the solutions were stable for 48 h at room temperature.
Analysis of marketed formulation
Developed densitometric method was applied to the selected marketed formulation. Rabekind Plus was found to contain 99.02 ± 1.32 and 101.46 ± 0.32 % w/w of LSP and RBP, respectively.
CONCLUSION
The developed method is new, simple and accurate with parameters authenticated with different statistical studies. The method is less time consuming and can be used for simultaneous quantification of LSP and RBP in tablet dosage forms.
Acknowledgements
The authors are thankful to Wanbury Ltd., Mumbai and Lupin Ltd., Tarapur for providing gift samples of pure drugs. Authors are also thankful to AICTE, New Delhi for financial support.
[4]SC Sweetman. Martindale: The complete drug reference, 36th edition, Pharmaceutical press, London, 2009; 1765.
[5]RV Dev; GS Uday Kiran; BV Subbaiah; BS Babu; JM Babu; PK Dubey. K Vyas; Magn. Reson. Chem., 2009, 47, 443–448.
[6]SS Sabnis; ND Dhavale; VY Jadhav; SV Gandhi. Spectrochim. Acta A, 2008, 69(3), 849-852.
[7]MS Jain; YS Agrawal; RB Chavhan; MM Bari; SD Barhate. Asian J. Pharm. Ana., 2012, 4(2), 106-109. [8]R Yadav; A Chokasi; V Parmar. Int. J. Pharm. and Frontier Res., 2013, 3(1), 54-62.
[9]S Manjunath; V Chouhan; S Sandeep. Int. J. Pharm. Pharm. Sci. 2011, 2(3), 135-137. [10]SE Jin; E Ban; YB Kim; CK Kim. J. Pharm. Biomed. Anal., 2004, 35 ,929-936.
[11]NVS Ramakrishna; KN Vishwottam; S Wishu; M Koteshwara; S Suresh Kumar. J. Chromatogr. B, 2005, 816, 209-214.
[12]M Miura; H Tada; S Satoh; T Habuchi; T Suzuki. J. Pharm. Biomed. Anal., 2006, 41(2), 565-570. [13]A El-Gindy; F El-Yazby; MM Maher. J. Pharm. Biomed. Anal., 2003, 31(2), 229-242.
[14]UK Chhalotiya; KK Bhatt; DA Shah; SL Baldania; JR Patel. Int. J. of Adv. in Pharmac. Ana., 2012, 2(2), 41-46. [15]N Agarwal; B Jagadeesh. Int. J. Pharm. Bio. Sci., 2012, 3(4), 718-726.
[16]A Sirisha; AR Kumar. Int. Res. J. Pharm. App. Sci.;2012, 2(4), 49-55.
[17]S Surve; A Patwari; J Patel; I Rathod; M Chhabria. Int. J. Pharm. Pharm. Sci., 2013, 5(3), 65-69.