International Journal of Emerging Technology and Advanced Engineering Website: www.ijetae.com (ISSN 2250-2459, Volume 2, Issue 7, July 2012)
339
Parametric Optimization of Drilling Machining Process using
Taguchi Design and ANOVA Approach
1
Yogendra Tyagi, 2Vedansh Chaturvedi, 3Jyoti Vimal
1.
Student of Mechanical Engineering Department, MITS , Gwalior
2,3
Assistant Professor, Mechanical Engineering Department, MITS , Gwalior
Abstract -In this paper the drilling of mild steel with the help of CNC drilling machine operation with Tool use high
speed steel by applying Taguchi methodology has been
reported. The Taguchi method is applied to formulate the
experimental layout to ascertain the Element of impact each optimum process parameters for CNC drilling machining
with drilling operation of mild steel. A L9 array, taguchi
method and analysis of variance (ANOVA) are used to formulate the procedure tried on the change of parameter
layout. The available material study in focuses optimization of
CNC Drilling machine process parameters to provide good surface finish as well as high material removal rate
(MRR).The surface finishing and material removal rate have
been identified us quality attribute and are assumed to be
directly related to productivity. The selection of optimal machining parameters i.e., spindle speed, depth of cut and
feed rate) for drilling machine operations was investigated in
order to minimize the surface roughness and to maximize the material removal rate.
Keywords: CNC drilling machine, surface roughness, material removal rate (MRR), Taguchi method, ANOVA
I. INTRODUCTION
In this research work, material removal rate (MRR) and surface roughness of the work piece prepared by CNC drilling milling operation are to be studied procedure tried on the change us a test and find out the solution. The Drilling machine highly used in a industry for metal removal operation. It is, therefore, essential to optimize quality and productivity simultaneously.
Productivity can be interpreted in terms of material removal rate in the machining operation and quality represents satisfactory yield in terms of product characteristics as desired by the customers.
International Journal of Emerging Technology and Advanced Engineering Website: www.ijetae.com (ISSN 2250-2459, Volume 2, Issue 7, July 2012)
340
II. EXPERIMENTAL PROCESSES
Drilling operation performed on Mild steel workpiese.mild steel are soft, ductile and easily machined The composition of mild conation carbon(0.05%to0.3%) and small quantities of manganese(Mn), silicon(Si), phosphorus (P) sulphur(S) table1 shows the material related properties. Experiments were performed using a CNC vertical drilling machine. Figure 1 depicts schematically the experimental set-up.
A rectangular mild steel plate of size 100 mm ×76mm ×10mm in shaping machine for performing CNC drilling machine. Holy oil was used as the coolant fluid in this experiment .Young‟s Modulus (210GPa), Poisson‟s Ratio (0.29) Density (7.8g/cm³), Melting Point (140ºC)
Modulus of elasticity (200GPa) Bulk
Modulus(140GPa) Specific heat {0.122tu/(hr-ft-ºF)}
Table 2.1 Material parameters of mild steel
2.2 High speed steel
One of our tools for the CNC drilling operation will be the high speed steel. High speed steel (HSS)are used for making drilling tools, we used tool diameter 10mm in the drilling machine and point angle is118º This property allows HSS to drilling faster than high carbon steel, hence the name high speed steel.
At room temperature, in their generally recommended heat treatment, HSS grades generally display high hardness The composition of high speed steel are carbon (0.6%to0.75%)
tungsten (14%to20%),Chromium (3%to5%)
vanadium (1%to1.5%), Cobalt (5%to10%) and
remaining is iron.
.
Table 2.2 Material parameters (HSS)
Calculating mass of each plate by the high precision digital balance meter before machining operation and before machine process CNC machine part programs for particular tool path of particular commands using various levels of spindle speed, feed rate and, depth of cut. We performed drilling machining operation .
After that calculating mass of each work piece plate again by the digital balance meter. The MRR values were measured three times of each
specimen and then, the material removal rate Values were average. The Ra values also
measured three times on each specimen and the surface roughness (Ra) is measured with a mitutoyo surftest SJ-201 series 178 portable
Elastic modulus kN/cm² 21,000
Compressive strength kN/cm 30
Elastic modulus kN/cm² 21,000
International Journal of Emerging Technology and Advanced Engineering Website: www.ijetae.com (ISSN 2250-2459, Volume 2, Issue 7, July 2012)
341 surface roughness tester instrument. Machining experiments for determining the optimal machining parameter were carried out by setting of spindle speed in the range of 1000-2000 rpm,
feed in the range of 0.5-1.5mm/min, depth of cut in the range of 3-7 mm and Essential parameter of the experiment are given in table 3 .
Table 3: Drilling machining condition
Fig.1: Experimental Set up of vertical CNC Fig.2: Line diagram of experimental set up Drilling machine
Work Condition Description
Workpiece Spindle Speed Feed
Depth of cut Coolant Lubricant Tool Diameter
Mild Steel, Rectangular shape(100x76x10mm) 1000to 2000 rpm
International Journal of Emerging Technology and Advanced Engineering Website: www.ijetae.com (ISSN 2250-2459, Volume 2, Issue 7, July 2012)
342
Fig 3: Final Image of work piece
III. DESIGN OF EXPERIMENT AND DATA ANALYSIS
3.1. Design of Experiment
The experimental layout for the machining parameters using the L9 orthogonal array (OA)
design the machine was used for the drilling operation in this study. The surface and MRR are two essential part of a product in any drilling machining operation The theoretical surface roughness is generally dependent on many parameter such as the tool geometry, tool material and work piece material. The array having a three control parameter and three levels as shown in table 4. This method, more essentials all of the observed values are calculated based on „the maximum the better‟ and „the minimum the better‟.
International Journal of Emerging Technology and Advanced Engineering Website: www.ijetae.com (ISSN 2250-2459, Volume 2, Issue 7, July 2012)
[image:5.612.39.568.191.296.2]343
Table 4: Design scheme of experiment of Parameters and levels
3.2.Analysis of Variance (ANOVA) Analysis of variance(ANOVA) and the F test
(standard analysis) are used to analyse the the experimental data as
A. Analysis of Variance (ANOVA):
Analysis of variance (ANOVA) and the F-test(standard analysis) are used to analyses the experimental data (4 ,5 ,6] :
CF = T2/n
ST = ∑i=1to27 Yi2 – CF
Sx = (Yx12/Nx1 + Yx22/Nx2 + Yz32/Nx3) – CF fx = (number of levels of parameter x) – 1 fe = fT - ∑fx
fT = (total number of results) – 1 Fx = Vx/Ve
Ve = Se/fe
Px = Sx‟/ST * 100%
Sx‟= Sx – (Ve * fx) Pe = (1 - ∑ Px) * 100%
Vx = Sx/fx Se = ST - ∑Sx
Where;
CF→ correction factor
n→ total number of experiment T→ total of all results
ST → total sum of squares to total variation
Yi→ value of results of each experiment ( i= 1 to 27)
Sx →sum of squares due to parameter x (x= P, Q, R And S) Fx→ F- ratios of parameter x
Nx1 , Nx2 , Nx3 → repeating number of each level (1, 2, 3) Ve→ variance of error term
of parameter x Vx → variance of parameter x Se→ sum of squares of error term
3.3. Data Analysis
In this paper, analysis based on the taguchi method is done by Taguchi DOE software (Qualities-4) to determine the main effects of the process parameters, to perform the analysis of variance(ANOVA) and to establish the optimum conditions.
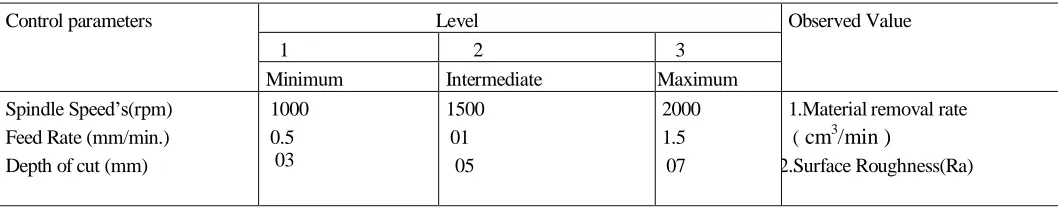
The main effects analysis is used to study the trend of the effects of each of the factors, as shown in figures 2 and 3. The machining performance (ANOVA-significant factor) for each experiment of the L9 can be calculated by taking the observed values of the MRR as an Control parameters Level Observed Value
1 2 3 Minimum Intermediate Maximum Spindle Speed‟s(rpm)
Feed Rate (mm/min.) Depth of cut (mm)
1000 0.5 03
1500 01 05
2000 1.5 07
1.Material removal rate (cm3/min )
International Journal of Emerging Technology and Advanced Engineering Website: www.ijetae.com (ISSN 2250-2459, Volume 2, Issue 7, July 2012)
344 example from table 5. And 6 lists the ANOVA and F test results for MRR. F0.05; n1, n2 is quoted
from “Statistical Tables” [7]. If the calculated Fz
values exceed F0.05; n1, n2 (Table 6), then the
contribution of the input parameters, such as Spindle speed, is defined as significant. Thus, the significant parameters can be categorised into two levels which is significant and sub significant. All of them are based on the fact that the Fz values are much larger than F0.05;n1,n2 and
denoted as ** and * respectively. For instance, to
evaluate the MRR, the significant parameter is feed rate. The SR parameters only slightly contribute to the evaluation of the MRR. and Similar calculations are also applied in evaluating of the SR. Tables 7 and Table 8 summarised the correlated results, indicating the significant parameters in evaluating the SR and MRR . In addition the optimum machining condition (ANOVA-optimum condition) each of the observed values is illustrated in table9&10.
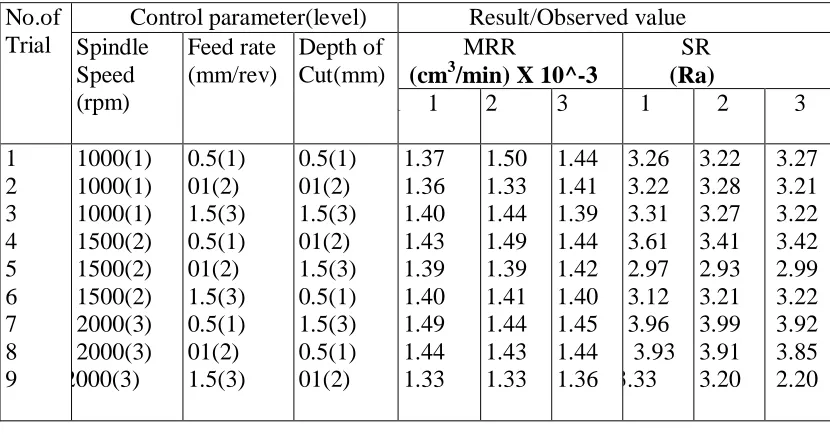
Table 5: L9 table and observed values
Table 6: Analysis of variance and F test for MRR
** Significant parameter, * Sub significant parameter No.of
Trial
Control parameter(level) Result/Observed value Spindle Speed (rpm) Feed rate (mm/rev) Depth of Cut(mm) MRR
(cm3/min) X 10^-3
SR (Ra)
1 1 2 3 1 2 3
1 2 3 4 5 6 7 8 9 1000(1) 1000(1) 1000(1) 1500(2) 1500(2) 1500(2) 2000(3) 2000(3) 2000(3) 0.5(1) 01(2) 1.5(3) 0.5(1) 01(2) 1.5(3) 0.5(1) 01(2) 1.5(3) 0.5(1) 01(2) 1.5(3) 01(2) 1.5(3) 0.5(1) 1.5(3) 0.5(1) 01(2) 1.37 1.36 1.40 1.43 1.39 1.40 1.49 1.44 1.33 1.50 1.33 1.44 1.49 1.39 1.41 1.44 1.43 1.33 1.44 1.41 1.39 1.44 1.42 1.40 1.45 1.44 1.36 3.26 3.22 3.31 3.61 2.97 3.12 3.96 3.93 3.33 3.22 3.28 3.27 3.41 2.93 3.21 3.99 3.91 3.20 3.27 3.21 3.22 3.42 2.99 3.22 3.92 3.85 2.20 Parameter (z) DOF ( (fz)
Sum of Square(Sz)
Variance (Vz)
F-ratio (Fz) F
[image:6.612.97.512.329.546.2]International Journal of Emerging Technology and Advanced Engineering Website: www.ijetae.com (ISSN 2250-2459, Volume 2, Issue 7, July 2012)
345
Table 7: Analysis of variance and F test for SR
**Significant parameter, *Sub significant parameter
Table8: Summarization of significant parameter on the Machinablity of drilling machine
IV.RESULTS AND DISCUSSION
processes parameter to the observed values (MRR) The following discussion focuses on the effects of And based on taguchi methodology
Parameter
(z)
DOF ( (fz)
Sum of Square(Sz)
Variance (Vz)
F-ratio
(Fz) F0.05;n1,n2
Pure Sum (Sz‟)
Percent (Pz)
S F D E
2 2 2 20
1.414 0.732 0.510 0.042
0.707 0.366 0.255 0.002
366.67** 174.285* 121.428*
3.55 3.55 3.55
1.4098 0.7278 0.506 0.028
51.908 26.628 18.400 1.048
Parameter MRR SR
S F D
* ** *
** * *
1.402 1.404 1.406 1.408 1.41 1.412 1.414 1.416 1.418 1.42
0 1000 2000 3000
SPEED
M
R
R
Series1
3.1 3.2 3.3 3.4 3.5 3.6 3.7 3.8
0 1000 2000 3000
SPEED
R
e
s
p
o
n
s
e
o
f
S
R
International Journal of Emerging Technology and Advanced Engineering Website: www.ijetae.com (ISSN 2250-2459, Volume 2, Issue 7, July 2012)
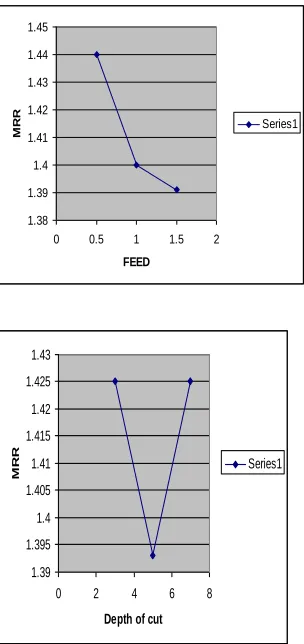
[image:8.612.80.232.158.480.2]346 Figure 4: Show the main effect of (MRR)
Figure 5:Show the main effect of (SR)
1.38 1.39 1.4 1.41 1.42 1.43 1.44 1.45
0 0.5 1 1.5 2
FEED
M
R
R
Series1
1.39 1.395 1.4 1.405 1.41 1.415 1.42 1.425 1.43
0 2 4 6 8
Depth of cut
M
R
R
Series1
3.2 3.25 3.3 3.35 3.4 3.45 3.5 3.55 3.6
0 0.5 1 1.5 2
FEED
R
e
s
po
ns
e
of
S
.R
.
Series1
3.32 3.34 3.36 3.38 3.4 3.42 3.44 3.46
0 2 4 6 8
Depth of cut
R
e
s
p
o
n
s
e
o
f
S
.R
.
International Journal of Emerging Technology and Advanced Engineering Website: www.ijetae.com (ISSN 2250-2459, Volume 2, Issue 7, July 2012)
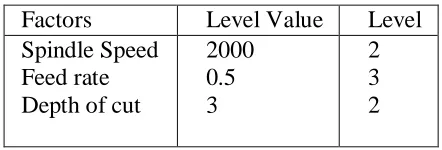
[image:9.612.306.527.171.246.2]347 Table 9: Optimum Machining Condition based On
Graph of MRR
Table10: Optimum machining condition based On Graph of SR
4.1. material Removable Rate
Figure 4 shows the main effect of MRR of each factor for various level condition it was increase in spindle speed then increase in the material removable rate and, the increase in the feed rate then decrease the decrease the MRR and depth of cut increase beginning in machining process in decrease MRR and after some process increase Depth of cut and slightly increase MRR. According to predicted optimal parameter setting we have conducted the confirmation test and found MRR 1.46 cm3/min which shows the successful implementation of this approach.
4.2. Surface Roughness
Figure 5 shows the main effects of SR of each factor for various level conditions. According to predicted optimal parameters setting we have conducted the confirmation test and found surface roughness 2.12 (Ra) which shows the successful implementation of this approach in case of drilling machine optimization of mild steel work piece
V.CONCLUSIONS
This paper has discussed the feasibility of machining Mild Steel by drilling machine with a HSS Tool. Taguchi method has been used to determine the main effects significant factors and optimum machining condition to the performance of drilling hole in mild steel based on the results presented here in, We can conclude that, the Spindle Speed of
drilling machine Tool mainly affects the SR. The Feed Rate largely affects the MRR.
REFERENCES
[1] V Krishna Raj, S Vijyanarayan, G Suresh (2005) High Speed drilling of GFRP.IJMES 12,189-195
[2] Chua MS, Rahman M, Wong YS, HT.” Determination of optimal cutting conditions using design of experiments and optimization techniques”, In T J Mach Tools Manuf 1993; 33(2): 297–305.
[3] Philip j Roos (1996) Taguchi techniques for quality engineering Mc Graw-Hill
[4] Mustafa Kurt, Eyup Baggie, Yusuf Kaynak (2009), Application of taguchi methods in the optimization of cutting parameters for surface finish and hole diameter accuracy in dry drilling process., Int J Adv Manuf Technol, 40, 458-469.
[5] Benardos, P.G., Vosniakos, G.C., 2003. Predicting surface roughness in machining: a review. Int. J. Mach. Tool Manuf. 43 (12), 833–844.
[6] Mohammed T. H. (2001).Hole quality in deep Hole Drilling. Materials and Manufacturing ProcessesVol.16, no. 2 P.147-164, DOI: 10.1081/AMP- 100104297
[7] Ranjit, K.R. (1990) A Primer on the Taguchi Method, competitive manufacturing series. Van nostand
[8] Taguchi, G, Elsayed, E.A. Hsiang, T.(1989). uality engineering in production systems. McGraw-Hill, New York
[9] Unal,R; Dean, E.B. (1991).Taguchi approach to Design optimization for Quality and cost. An Overview proceedings of the
international Society of parametric analyst 13th Annual,P.21-24
[10] Bemardos, P.G, Vosniakos, G.C. (2003).Predicting Surface roughness in machining; a review International journal of machine
tools & Manufacture Vol.43,no.8, p. 833-844,
DOI:10.1016/s0890-6955(03)00059-2
Factors Level Value Level Spindle Speed
Feed rate Depth of cut
1500 1.5 5
3 1 1or 3
Factors Level Value Level Spindle Speed
Feed rate Depth of cut
2000 0.5 3