International Journal of Emerging Technology and Advanced Engineering
Website: www.ijetae.com (ISSN 2250-2459,ISO 9001:2008 Certified Journal, Volume 3, Issue 1, January 2013)
739
Reliable Load Flow Solution for Controlling Power Network by
FACTS Devices
C. Sreenivasulu
1, Dr. G. Madhusudhana Rao
2, Dr.B.V.Sanker Ram
31S.S. Institute of Technology, JNTU, Hyderabad, INDIA. 2
JJ Group of Institutions, Hyderabad, INDIA.
3Professor of EEE,JNTU, Hyderabad, INDIA.
Abstract-- In this paper a new and efficient method for the reliable load flow solution of power network branches controlled by flexible AC transmission systems (FACTS) is presented. In the various methods proposed in past, the formulations was derived in which the Jacobian matrix is in UDUT form, where U is a constant upper triangular matrix depending solely on system topology and D is a block diagonal matrix. Now this paper is presenting a new technique consisting of embedded series Flexible AC Transmission System (FACTS) devices, facilitated by a formulation of power flow equations with bus voltage magnitudes and line flows as independent variables. Using IEEE standard systems, the line flow-based (LFB) formulation is shown to provide easy implementation with multiple series and shunt FACTS devices. The proposed method is very reliable with comparison to N-R method.
Keywords-- Distribution power flow analysis, flexible AC transmission system (FACTS), power system planning and modeling, voltage controls.
I. INTRODUCTION
Power flow is the most fundamental numerical algorithm for power system analysis. In 1967, Tinney and Hart developed the classical Newton based power flow solution method[l]. Later work by Stott and Alsac [2] made the fast decoupled Newton method as well as its various alternatives a kind of standard power flow method for EMS systems. Even though the fast decoupled Newton method works well for transmission systems, its convergence performance is poor for most distribution systems due to their high r/x ratio which deteriorates the diagonal dominance of the Jacobian matrix. For this reason, several non-Newton types of methods have been proposed [3-6].
Increased use of transmission facilities due to higher industrial output and deregulation of the Power Supply Industry have provided the momentum for exploring new ways of maximizing power transfers in existing transmission facilities while, at the same time, maintaining acceptable levels of network reliability and stability. In this environment, high performance control of the power network is mandatory. An in-depth analysis of the options available for achieving such objectives has pointed in the direction of power electronics.
International Journal of Emerging Technology and Advanced Engineering
Website: www.ijetae.com (ISSN 2250-2459,ISO 9001:2008 Certified Journal, Volume 3, Issue 1, January 2013)
740 The main objective of this paper is to develop an LFB formulation of power balance equations for analyzing a radial distribution system that will efficiently incorporate embedded series and shunt FACTS devices. The LFB equations use bus voltage magnitudes and line power flows as independent variables and directly relate the FACTS device variables with system operating conditions. The line loss terms are the only nonlinear terms in the formulation. By adding them to bus power injections, the coefficient matrix of LFB equations is rendered linear. A preliminary Breadth-First-Search (BFS) ordering of the branches transforms the coefficient matrix structure to strictly upper/lower diagonal and leads to simple backward/forward substitution for calculating real and reactive line power in each branch and voltage at each bus. The FACTS device models are described first, and the development of LFB equations follows. Numerical examples, including multiple FACTS devices in the standard IEEE systems, illustrate the power of the new approach. The procedure exhibits good convergence characteristics, high reliability, and computational efficiency. A balanced distribution feeder modeled by the positive sequence impedance is used in the paper, since the aim of this paper is to demonstrate the advantages of the LFB formulation in handling the embedded FACTS devices. FACTS devices can be assumed to be cost-effective when deployed on the main distribution feeder.
II. BASIC CIRCUIT THEORY IN DISTRIBUTION SYSTEMS
For a linear, time-invariant RLC circuit with a sinusoidal voltage source, the basic circuit theory can be expressed as (see Appendix A for details):
Ohm's Law: ib = ybvb (1)
KCL: Ab=in (2)
KVL: Bib, =0 (3)
For fundamental frequency power flow calculations, a distribution system is always modeled as a linear, time invariant RLC circuit. Earth is always treated as a reference node. For a radial distribution system with n nodes and without shunt branches, the number of branches is n-1. Therefore, the dimension of matrix A is n x (n-1).
Figure.1Single line diagram for independent radial distribution system
The independent loop for radial distribution systems can always be formed by a branch with its two shunt branches. Since shunt branches are usually neglected in modeling distribution lines, a fictitious shunt branch can be placed with branch voltage to be the nodal voltage as shown in Figure 1can be written as:
Vb=A T
Vn (4)
Combining (l), (2), and (4), we have: AYbATVn=In (5)
By knowing the nodal voltage at one node, assuming it is the first node for convenience, and nodal current injections at the other n-1 nodes, (6) can be derived from (5) for solving the remaining n-1 unknown nodal voltages:
Where
Note matrix An-1 is a square matrix Since every branch
is always directed away from one node and towards the other node, we have:
Where en and en-1 are unity column vectors with
dimension n and n-1 respectively. Then (6) can be simplified as:
An-1YbATn-1 is the Nodal Admittance Matrix which
most power engineers are familiar with. In other words, for a radial system without shunt branches, the Nodal Admittance Matrix is formed as the product of three square matrices. It is interesting to note that the back forward sweep method proposed in [5] for a radial system is exactly the same as solving Vn-1from (8) if we
organize (8) as follows:
Solving IL from (8a) is equivalent to the 'Backward
Sweep', and solving Vn-1 from (8b) is equivalent to the
'Forward Sweep'. This observation is very important as it motivated us to derive a Jacobian matrix in UDUT form and a back/forward sweep algorithm for the Newton method.
International Journal of Emerging Technology and Advanced Engineering
Website: www.ijetae.com (ISSN 2250-2459,ISO 9001:2008 Certified Journal, Volume 3, Issue 1, January 2013)
741 III. RADIAL SYSTEM
The radial distribution network graph has a tree structure with no loops as shown in Fig 2. The total number of lines equals the number of buses minus one. The pattern of incidence matrix depends on the order of lines and nodes, the incidence matrix of given distribution network is shown Fig.3 The Arbitrary order incidence matrix has a structure that depends on the order in which the lines are read from the data. Further, the incidence matrix is non square and singular. Any line oriented from a bus is given +1 and for towards node - 1 is assigned if the slack bus is excluded, the incidence matrix becomes square and non singular.
Fig.2 IEEE 13-node test feeder
Fig.3: Graph of IEEE 13-node feeder
Fig.4: Incidence matrix – with nodes in arbitrary order
IV. DECOUPLED LFB MODEL OF RADIAL DISTRIBUTION
SYSTEMS
The below matrix may be split into three “decoupled” equation sets and rewritten as follows:
With BFS ordered lines, the bus incidence matrix A and as (8) A1 and are upper triangle matrixes and AT1 is a
International Journal of Emerging Technology and Advanced Engineering
Website: www.ijetae.com (ISSN 2250-2459,ISO 9001:2008 Certified Journal, Volume 3, Issue 1, January 2013)
[image:4.595.315.550.306.767.2]742 This model is called linear LFB. The other variations are the LFB model, including the loss term and the decoupled formulation (D-LFB). Calculations are carried out with a PC. For a convergence criterion of, all three iterative methods took four iterations in each case. Table I shows the computation time in the various cases. For comparing the accuracy of the results, the maximum absolute error and the mean square deviation of the bus voltage values are calculated in the new formulations using the Newton–Raphson results as accurate ones. Table II shows the results from the three variations for the various cases studied. The conclusion is that the proposed LFB formulation is computationally superior and acceptably accurate.
Fig.5: Bus Incidence matrix
V. ALGORITHM FOR DECOUPLED LFB
1. Read the system line data and bus data
A) System data: no of buses, no of lines, reference bus or slack bus
b) Line data: From bus, to bus, line resistance, line reactance
c) Bus data: bus no , P Load, Q load..
d) Read itermax , epsilon, epsilon, base KVA , base voltage
e) Read the initial voltage at all buses
2. using above BFS method to modify the system network.
3. From idegree , itagf , itagto , adjq , and adjL vectors. 4. Calculate effective load at each bus starting from the last bus P effective load, Q effective load.
5. Initialize sum of active power loss slp=0, sum of
reactive powerloss slq=0, Previous iteration active power loss pl=0, reactive
power loss ql=0
6. Start iteration count iter=1
7. Initialize total active power loss tploss [i]=0,total reactive power loss
tqloss[i] = 0 for i = 1 to n. 8. Assign slp=pl, slq= ql, pl=ql=0 9. Find effective losses at each bus 10. Calculate load at each bus with losses
11. Calculate the voltages and phse angles, equations (3.3)
12. ∆ploss = slp – pl& ∆ qloss= slq-ql then set ploss of (i) = qloss (i)=0 for 1 to n
13.If ∆ ploss <= epsilon and ∆qloss <= epsilon go to step 10
14. If iter <= itermax Then iter = iter + 1 go to step 9 15. Problem not converged and stops.
16. Problem converged and prints the results.
VI. TEST RESULTS
IEEE 13 Bus System Results (Decoupled LFB)
Table I
Line Data of load Pl and Ql at end buses of each line
L.No LP LQ R X Pl Ql
1 1 2 0.020 0.065 0 0
2 2 3 0.022 0.020 0.04 0.023
3 2 4 0.020 0.065 0.034 0.025
4 2 5 0.015 0.020 0.271 0.155
5 3 6 0.013 0.012 0 0
6 4 7 0.013 0.012 0.046 0.026
7 4 8 0.010 0.032 0 0
8 4 9 0 0 0 0
9 5 10 0 0 0.034 0.030
10 7 11 0.007 0.007 0.08 0.058
11 7 12 0.019 0.007 0.034 0.016
12 9 13 0.013 0.012 0.025 0.017
Table II NLCONT
BUSNO NLCOUNT
1 1
2 4
3 2
4 4
5 2
6 1
7 3
8 1
9 2
10 1
11 1
12 1
[image:4.595.54.280.309.446.2]International Journal of Emerging Technology and Advanced Engineering
Website: www.ijetae.com (ISSN 2250-2459,ISO 9001:2008 Certified Journal, Volume 3, Issue 1, January 2013)
[image:5.595.321.544.157.531.2]743
[image:5.595.59.286.376.778.2]Table III ITAG Vector
Table IV
Real &Reactive Power at each Bus
Table V
Real &Reactive Power Loss at each line
Table VI
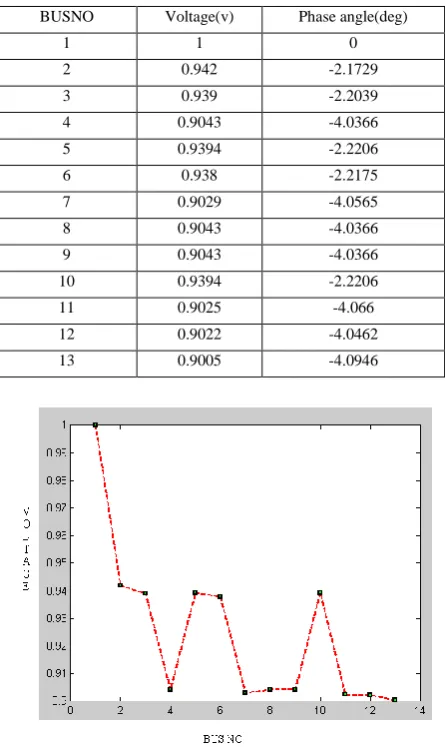
Voltage and Phase angle of each bus
BUSNO Voltage(v) Phase angle(deg)
1 1 0
2 0.942 -2.1729
3 0.939 -2.2039
4 0.9043 -4.0366
5 0.9394 -2.2206
6 0.938 -2.2175
7 0.9029 -4.0565
8 0.9043 -4.0366
9 0.9043 -4.0366
10 0.9394 -2.2206
11 0.9025 -4.066
12 0.9022 -4.0462
13 0.9005 -4.0946
Fig.6. Graph: Bus no Vs Voltage.
VII.CONCLUSIONS
FACTS devices offer a flexible and comprehensive solution to voltage profile control in distribution systems. Traditional methods such as voltage regulators, series, and parallel capacitor switching can be adapted to work more effectively with FACTS control. Methods of power flow analysis of distribution networks are generally different from the Newton–Raphson algorithm used in interconnected system analysis. This paper proposes a line flow-based formulation, which uses line power flows as variables instead of line currents. Since line reactive flows and bus voltage magnitudes are of interest in controlling voltage profiles, the line flow-based algorithm provides a direct and simple approach to handle single or multiple devices. This will enable easy determination of size and placement of such devices. The line flow-based equations have constant coefficient matrices and need no updating during the iterative procedure.
BUSNO ITAGF ITAGTO IDEGREE
1 1 1 1
2 2 5 4
3 6 7 2
4 8 11 4
5 12 13 2
6 14 14 1
7 15 17 3
8 18 18 1
9 19 20 2
10 21 21 1
11 22 22 1
12 23 23 1
13 24 24 1
BUSNO Peff Qeff
1 0.7332 0.4436
2 0.7332 0.4436
3 0.08 0.0514
4 0.5332 0.311
5 0.08 0.058
6 0.046 0.0264
7 0.0596 0.0332
8 0 0
9 0.2026 0.1226
10 0.08 0.058
11 0.034 0.016
12 0.0256 0.0172
13 0.1686 0.0924
LINE NO PLOSS QLOSS
1 0.0216 0.0694
2 0.0002 0.0002
3 0.0104 0.0333
4 0.0002 0.0002
5 0 0
6 0.0001 0.0001
7 0 0
8 0 0
9 0 0
10 0 0
11 0 0
International Journal of Emerging Technology and Advanced Engineering
Website: www.ijetae.com (ISSN 2250-2459,ISO 9001:2008 Certified Journal, Volume 3, Issue 1, January 2013)
744 REFERENCES
[1 ] W. F. Tinney and C. E. Hart, "Power Flow Solution by Newton's Method", IEEE Trans. Power App. Syst., Vol.PAS-86, November 1967, pp.1449-1460.
[2 ] B. Stott and 0. Alsac, "Fast Decoupled Load Flow", IEEE Trans. Power App. Syst., Vol.PAS-93, May-June] 1974, pp.859-869 [3 ] D. Shirmohammadi, H. W. Hong, A. Semlyen, and G. X. Luo, "A
Compensation-Based Power Flow Method for Weekly Meshed Distribution Networks", IEEE Trans. on Power Systems, Vo1.3, No.2, May 1988, pp.753-762.
[4 ] W. H. Kersting and D.L. Mendive, "An Application of Ladder Network Theory to the Solution of Three Phase Radial Load Flow Problems", 1976 IEEE PES Winter Meeting, Paper No. A76 044-8.
[5 ] R. D. Zimmerman and H. D. Chiang, "Fast Decoupled Power Flow for Unbalanced Radial Distribution Systems", 1995 IEEE PES Winter Meeting, New York, Paper No. 95 WM 219-6 PWRS. [6 ] F. C. Schweppe and D. B. Rom, "Power System Static-State Estimation, Part 11: Approximate Model", IEEE Trans. Power
App. Syst., Vol.PAS-89, No.1, January 1970, pp.125-130. [7 ] G. R. Krumpholz, K. A. Clements, and P. W. Davis, "Power
System Observability: A Practical Algorithm Using Network Topology", IEEE Trans. Power App. Syst., Vol.PAS-99, N0.4, July/August 1980, pp.1534-1542
[8 ] G. X. Luo and A. Semlyen, "Efficient Load Flow for Large Weakly Meshed Networks", IEEE Trans. On Power Systems, Vo1.5, No.4, November 1990, pp.3648-3657. 1974, pp.859-869. Pp.1309-1316.
[9 ] C. S. Cheng and D. Shirmohammadi, "A Three- Phase Power Flow Method for Real-Time Distribution System Analysis", IEEE Trans. On Power Systems, Vol.10, No.2, May 1995, pp.671-679. [10 ]L. 0. Chua and P-M Lin, "Computer-Aided Analysis of Electronic
Circuits", Prentice-Hall, 1975.
[11 ]C. N. Lu, J. H. Teng and E. Liu, "Distribution System State Estimation", 1994 IEEE PES Winter Meeting, paper 94WM098-4PWRS
[12 ]M. E. Baran and A. W. Kelly, "State Estimation for Real Time Monitoring of Distribution systems", 1994 IEEE PES Winter Meeting, paper 94WM235- 2PWRS.
[13 ]A. P. S. Meliopoulos and F. Zhang, "Multiphase Power Flow and State Estimation for Power Distribution Systems", 1995 IEEE PES Summer Meeting, paper 95SM562-9PWRS.
[14 ]Cheng and D. Shirmohammadi, “A three phase power flow method for real time distribution system analysis,” IEEE Trans. Power Syst., vol. 10, no. 2, pp. 671–679, May 1995.
[15 ]M. E. Baran and F. F. Fu, “Optimal sizing of capacitors placed on a radial distribution system,” IEEE Trans. Power Del., vol. 4, no. 1, pp. 735–742, Jan. 1989.
[16 ]A. G. Exposito and E. R. Ramos, “Reliable load flow technique for radial distribution networks,” in Proc. IEEE PE-344-PWRS-0-12, 1996.
[17 ]J. Gotham and G. T. Geydt, “FACTS device models for power studies,” in Proc. 27th NAPS, Bozeman, MT, Oct. 2–3, 1995, pp. 514–519.
AUTHORS PROFILE
Mr. C. Sreenivasulu, Associate Professor in S.S. Institute of Technology in the Department of Electrical and Electronics Engineering, AP, Hyderabad. He received his M.Tech & B.Tech from Sri Venkateswara University, Tirupati, AP, INDIA. Both in Electrical and Electronics Engineering. His research interests are power system opration and control, power system stability, FACTS and new type of A.C transmission system. Email: [email protected].
Dr. G. Madhusudhana Rao, Professor in JJ Group of Institutions, Hyderabad. Obtained his PhD from JNT University Hyderabad and completed M.Tech from JNT University-Hyderabad. He has Published 14 research papers in International Journals and more than 15 International conference papers and more than 10 national conference papers. His area of interest is Power Electronics and Drives with Expert Systems. E-mail: [email protected]