Hybrid Artificial Immune System-firefly Algorithm
Technique for Optimal DG Capacity and Operational
Strategy in Distribution System
M S Yusof1, S R A Rahim1,2,*, M H Hussain1, S A Azmi1,2, A Azmi1, N Hashim1
1
School of Electrical System Engineering, Universiti Malaysia Perlis, Malaysia
2
Centre of Excellence for Renewable Energy, Universiti Malaysia Perlis, Malaysia
Received September 6, 2019; Revised December 18, 2019; Accepted December 24, 2019
Copyright©2019 by authors, all rights reserved. Authors agree that this article remains permanently open access under the terms of the Creative Commons Attribution License 4.0 International License
Abstract
This paper presents a study on hybrid optimization technique for optimal distributed generation (DG) capacity and operational strategy in distribution system. In this study, hybrid method namely Artificial Immune System-Firefly Algorithm (AISFA) is developed to determine the optimal size of the schemes respectively in the distribution system. The Firefly Algorithm (FA) which is a type of meta-heuristic algorithm is inspired by the blinking or flashing behaviour of fireflies that is embedded into Artificial Immune System (AIS) algorithm. The aim of this study is to develop the AISFA algorithm in order to improve the voltage profile and minimize losses of distribution system between the different operational strategy and types of DG. The types of DG include DG type 1, DG type 2, and DG type 3. The proposed technique was verified on IEEE 69-bus test system and the program was developed using the MATLAB programming software. The results showed a significant loss reduction in the line losses and voltage profile improvement has been obtained for optimal DG capacity and operational strategy in distribution system. From the simulation, the results were recorded in terms of the total losses and minimum voltage for the system. The results of the optimisation process of DG are utilized for the assistance of power system operators and planners. The power system planner can adopt the suitable sizes and locations from the obtained result for the planning of utility in term of economic and geographical consideration.Keywords
Artificial Immune System, Distributed Generation, Firefly Algorithm, Hybrid AISFA, Voltage Profile Improvement1. Introduction
The power distribution network is one of the important parts of the power system. This is because it is the last part of power distribution to most customers such as industry, commerce and resident. Therefore, the distribution network must be kept customers in good quality power with acceptable voltage profile so power loss can be minimized. The introduction of schemes such as Distributed Generation (DG) plays an important role in the distribution system. The location and size of the scheme are critical because poor selection will have a negative impact on the power system.
Installation of DG is one of the acceptable and popular compensation schemes. However improper placement and sizing for DGs can cause the over-compensated or under-compensated phenomena[1]. With optimal placement and sizing of distribution and sizing of distributed generation or compensating capacitor or both of them, the maximum possible advantages could be obtained especially to improve the performance and to reduce losses in the system[2]–[8]. In order to increase the overall efficiency of power delivery in the distribution system, the loss reduction of I2R is very important to be considered.
optimization techniques.
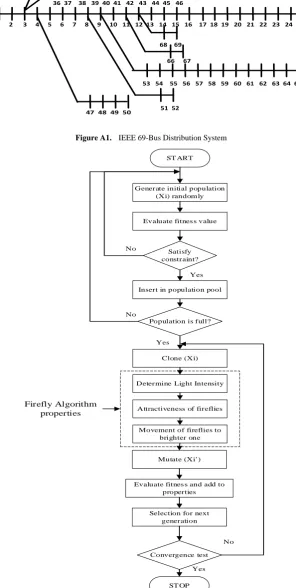
This study presented the comparative study between types of distributed generation (DG) on voltage profile and loss minimization of distribution system. The purpose of this project is to propose an meta heuristic technique in order to improve the voltage profile and minimize losses of distribution system between the different types of DG. The types of DG include DG type 1, DG type 2, and DG type 3. The effectiveness of developed technique is tested on a test system, namely IEEE 69-bus distribution system [23]. The single line diagram for the test systems is shown in Figure A1. The artificial intelligence technique that will be used to improve voltage profile and minimize the losses of the DG is Hybrid AISFA. The software that will be used to perform this optimization technique is MATLAB software. The best 5 optimal locations within the 69-bus test system and the DG sizing will be obtained. Then, the results that are obtained between the different types of DG will be compared in terms of voltage profile and loss minimization and the best type of DG will be identified.
2. Methodology
The main purpose of this study is to reduce losses in distribution system using computational intelligence technique. In this study, a hybrid method which is the combination of Artificial Immune System (AIS) and
Firefly Algorithm (FA) is used as computational intelligent technique in order to find the optimal sizing of the scheme at a candidate location. Distributed generation (DG) is used in this study to install in distribution network in order to reduce losses in the distribution system.
Figure B1 shows the flowchart implementation of hybrid AISFA in order to find the sizing of DG in distributed generation and the method is tested in IEEE 69-bus distribution test system. Based on the flowchart in Figure B1, the initialization of bus and line data of IEEE 69-bus system is identified as a distribution system.
The hybrid AISFA is developed to find the optimal sizing of DG capacity in order to minimize losses in distribution system. The proposed method must be able to produce the minimum size of schemes as low as possible directly proportional to the reduction of losses in the distribution system. If the desired results are not acceptable, the hybrid AISFA needs to be checked and edited in term of initialized value and parameters. This step keeps being carried out until the desired result is acceptable. Results from the simulation for each proposed schemes are observed and analysed. The objective function is proposed to minimise active power loss shown in (1).
𝑓(𝑥) = 𝑚𝑖𝑛�∑𝑙𝑖𝑛𝑒𝑃𝑙𝑜𝑠𝑠
𝑗=1 � (1)
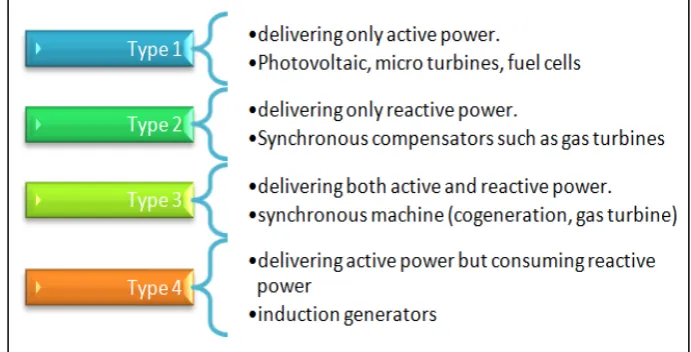
The optimal size of DG is modeled by taking the output of DG as variable to be optimised for different types of DG as shown in Figure 1.
[image:2.595.123.469.428.604.2]2.1. Proposed Hybrid Artificial Immune System-Firefly Algorithm (AISFA)
The proposed AISFA technique is developed with an objective to reduce the distribution losses while considering the voltage constraint in the distribution system. Several studies have revealed that hybrid algorithm could minimise the disadvantages and improve efficient, faster and more robust [24][25]. The AISFA is established by integrating FA properties into the AIS algorithm. The AIS idea is used to describe the basic reaction of the immune system by being adaptive to antigen stimulation. This idea expresses that the only cells can identify antigens that will reproduced, whereas other cells are ignored. Once the antibody attach to the antigen, then activated and set apart into plasma cells or memory cells, the Clonal selection works on T cells and B cells in cell B [26]. Previously, B cell duplicates are formed and experience somatic hyper-mutation. The result acquired diversity in the population of B cells to plasma cells produce antibodies antigen-specific works for antigens [27]. After the cloning process, the coding will continue with FA properties which are determination of the light intensity of fireflies, attractiveness of fireflies and the movement of firefly to the brighter one. For implementation of the algorithm, the parameters; 𝛽𝛽=0.2, 𝛾𝛾=1, 𝛼𝛼=0.25 are used. Firefly algorithm has three specific procedures which are based on the behaviour of firefly [28]. The value of objective function can only be proportional to the brightness. In the FA, with a reduction in light intensity and attractiveness, the distance from the source increases, and the variation of the light intensity and attractiveness should be a monotonically reducing function. Distance r varies with attractiveness via exp [−γr]. Then, the new solutions are evaluated will updated light intensity. The firefly attractiveness, β, Cartesian distance between any two fireflies i and j , and the
movement of firefly can be defined by (2), (3) and (4) respectively [1][29][30]. 2 r -e 0 γ β β = (2) d k ) j,k x i,k (x j x i x ij r ∑ = − = − = 1
2 (3)
0.5) -(rand ) i x -j (x 2 r -e 0 i x i
x = +β γ +α (4)
Next, the process is continuing with Artificial Immune System (AIS) which is mutation, evaluate fitness and add to properties, selection for next generation and convergence test. Convergence criteria are detailed by the difference of less than 0.0001 among the maximum and the minimum fitness. If the condition of convergence is not met, the procedure will be repeated until the condition of convergence is reached.
3. Result and Discussion
The five buses with lowest value of voltage magnitude, Vm are observed for installation of DG. Based on Figure 2,
bus 61, 62, 63, 64 and 65 are selected for installation of DG type 1 and DG type 2. Voltage magnitude for Bus 61 is 0.9124 pu, for bus 62 is 0.9121 pu, for bus 63 is 0.9117, for bus 64 is 0.9098 and for bus 65 is 0.9092.
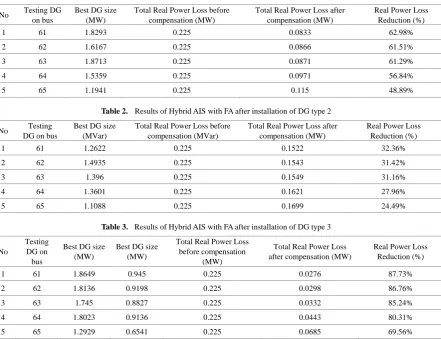
Based on the results obtained from Table 1, by installing DG type 1 at bus 61 with the DG sizing of 1.8293 MW has the highest real power loss reduction with 62.98%. The total reduction losses after compensation were 0.0833 MW from 0.225 MW. The second highest real power loss reduction is bus 62 with 61.51% followed by bus 63 with 61.29%, bus 64 with 56.84% and bus 65 with 48.89%.
[image:3.595.72.526.527.673.2]Table 1. Results of Hybrid AIS with FA after installation of DG type 1
No Testing DG on bus
Best DG size (MW)
Total Real Power Loss before compensation (MW)
Total Real Power Loss after compensation (MW)
Real Power Loss Reduction (%)
1 61 1.8293 0.225 0.0833 62.98%
2 62 1.6167 0.225 0.0866 61.51%
3 63 1.8713 0.225 0.0871 61.29%
4 64 1.5359 0.225 0.0971 56.84%
5 65 1.1941 0.225 0.115 48.89%
Table 2. Results of Hybrid AIS with FA after installation of DG type 2
No Testing DG on bus
Best DG size (MVar)
Total Real Power Loss before compensation (MVar)
Total Real Power Loss after compensation (MW)
Real Power Loss Reduction (%)
1 61 1.2622 0.225 0.1522 32.36%
2 62 1.4935 0.225 0.1543 31.42%
3 63 1.396 0.225 0.1549 31.16%
4 64 1.3601 0.225 0.1621 27.96%
5 65 1.1088 0.225 0.1699 24.49%
Table 3. Results of Hybrid AIS with FA after installation of DG type 3
No
Testing DG on bus
Best DG size (MW)
Best DG size (MW)
Total Real Power Loss before compensation
(MW)
Total Real Power Loss after compensation (MW)
Real Power Loss Reduction (%)
1 61 1.8649 0.945 0.225 0.0276 87.73%
2 62 1.8136 0.9198 0.225 0.0298 86.76%
3 63 1.745 0.8827 0.225 0.0332 85.24%
4 64 1.8023 0.9136 0.225 0.0443 80.31%
5 65 1.2929 0.6541 0.225 0.0685 69.56%
From the Table 2, by placing the DG unit at the bus 61 with the sizing of 1.2622 MVAR for DG type 2 has the highest real power loss reduction with 32.36%. The total reduction losses after compensation were 0.1522 MW from 0.225 MW. The second highest real power loss reduction is bus 62 with 31.42% followed by bus 63 with 31.16%, bus 64 with 27.96% and bus 65 with 24.49%.
Next, from Table 3, by installing DG type 3 at bus 61 with the DG sizing of 1.8649 MW and 0.9450 MVAR has the highest real power loss reduction with 87.73%. The total reduction losses after compensation were 0.0276 MW from 0.225 MW. The second highest real power loss
reduction is bus 62 with 86.76% followed by bus 63 with 85.24%, bus 64 with 80.31% and bus 65 with 69.56%.
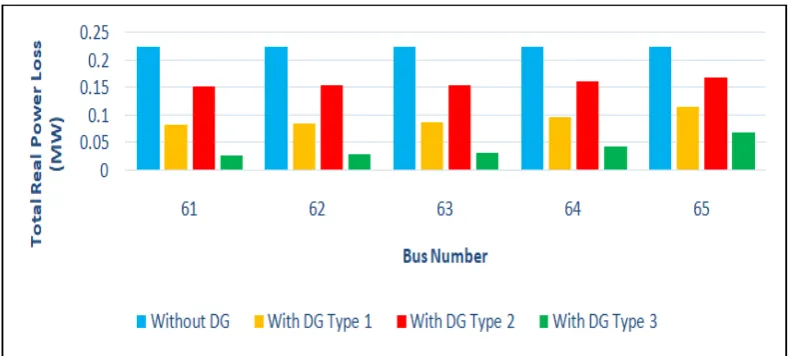
Figure 3. Results of Hybrid AIS with FA
4. Conclusions
In this study, the method has been proposed namely Hybrid Artificial Immune System-Firefly Algorithm (AISFA) where DG, one of the proposed compensation schemes is used. The proposed methods are verified on IEEE 69-bus distribution system. The five buses with lowest value of voltage magnitude (Vm) were selected
which are bus 61, 62, 63, 64 and 65. When the potential location has been identified, the Hybrid AISFA is designed with the objective of determining the size of DG in the radial distribution network. Then, different types of DG which are DG type 1, DG type 2 and DG type 3 provide the requirement result accurately and give good performance for solving sizing problem in the distribution system. The obtained results show that incorporating the schemes in the distribution system can decrease the total line power losses.
However, the installation of DG type 3 seems to have had a big impact in loss reduction compared to installation of DG type 1 and type 2 into the distribution system. Therefore, it can be concluded that the proposed methods are successfully applied for optimal allocation and sizing schemes in IEEE 69-bus test system.
Acknowledgements
Appendixes
1 2 3 4 5 6 7 8 9 10 11 12 13 14 15 16 17 18 19 20 21 22 23 24 25 26 27 28 29 30 31 32 33 34 35
36 37 38 39 40 41 42 43 44 45 46
53 54 55 56 57 58 59 60 61 62 63 64 65 68 69
66 67
51 52
[image:6.595.111.482.93.263.2]47 48 49 50
Figure A1. IEEE 69-Bus Distribution System
ST ART
Generate initial population (Xi) random ly
Evaluate fitnes s value
Satisfy constraint?
Insert in population pool Yes No
Population is full?
Clone (Xi)
Mutate (Xi’)
Evaluate fitnes s and add to properties
Selection for next generation
Convergence test
ST OP Yes No
No
Yes Determine Light Intensity
Attractiveness of fireflies
Movement of fireflies to brighter one
Firefly Algorithm properties
[image:6.595.146.443.144.733.2]REFERENCES
[1] S. R. A. Rahim, I. Musirin, M. M. Othman, and M. H. Hussain, “Effect of DG Installation in Distribution System for Voltage Monitoring Scheme,” Int. J. Electr. Comput. Energ. Electron. Commun. Eng., vol. 7, no. 12, pp. 520–525, 2013.
[2] Q. Kang, T. Lan, Y. Yan, L. Wang, and Q. Wu, “Group search optimizer based optimal location and capacity of distributed generations,” Neurocomputing, vol. 78, no. 1, pp. 55–63, 2012.
[3] H. Nasiraghdam and S. Jadid, “Load model effect assessment on optimal distributed generation (DG) sizing and allocation using improved harmony search algorithm,” in Conference on Smart Electric Grids Technology (SEGT), 2013, pp. 210–218.
[4] N. Rugthaicharoencheep and T. Langtharthong, “Reliability Improvement with Optimal Placement of Distributed Generation in Distribution System,” World Acad. Sci. Eng. Technol. Int. J. Electr. Sci. Eng., vol. 7, no. 10, pp. 394–398, 2013.
[5] M. M. Aman, G. B. Jasmon, A. H. A. Bakar, and H. Mokhlis, “A new approach for optimum simultaneous multi-DG distributed generation Units placement and sizing based on maximization of system loadability using HPSO (hybrid particle swarm optimization) algorithm,” Energy, Jan. 2014.
[6] C. Nayanatara, J. Baskaran, and D. P. Kothari, “Hybrid optimization implemented for distributed generation parameters in a power system network,” Int. J. Electr. Power Energy Syst., vol. 78, pp. 690–699, 2016.
[7] E. Zio, M. Delfanti, L. Giorgi, V. Olivieri, and G. Sansavini, “Monte Carlo simulation-based probabilistic assessment of DG penetration in medium voltage distribution networks,” Int. J. Electr. Power Energy Syst., vol. 64, pp. 852–860, 2015.
[8] A. El-Fergany, “Study impact of various load models on DG placement and sizing using backtracking search algorithm,” Appl. Soft Comput. J., vol. 30, pp. 803–811, 2015.
[9] A. Hadian and M. R. Haghifam, “Placement of DG with stochastic generation,” in 2010 IEEE PES Transmission and Distribution Conference and Exposition: Smart Solutions for a Changing World, 2010, pp. 1–7.
[10]K. Chellapilla and G. B. Fogel, “Multiple Sequence Alignment Using Evolutionary Programming,” in Proceedings of the 1999 Congress on Evolutionary Computation-CEC99, 1999, pp. 445–452.
[11]D. B. Fogel, “What is evolutionary computation?,” IEEE Spectr., vol. 37, no. 2, pp. 26, 28–32, 2000.
[12]W. Banzhaf, “Evolutionary Computation and Genetic Programming,” in Engineered Biomimicry, 2013, pp. 429– 447.
[13]S. C. Chu, H. C. Huang, J. F. Roddick, and J. S. Pan, “Overview of algorithms for swarm intelligence,” in
Lecture Notes in Computer Science (including subseries Lecture Notes in Artificial Intelligence and Lecture Notes in Bioinformatics), 2011, vol. 6922 LNAI, no. PART 1, pp. 28–41.
[14]J. Timmis, P. Andrews, and E. Hart, “On artificial immune systems and swarm intelligence,” Swarm Intell., vol. 4, no. 4, pp. 247–273, 2010.
[15]X.-S. Yang, “Swarm intelligence based algorithms: a critical analysis,” Evol. Intell., vol. 7, no. 1, pp. 17–28, 2013.
[16]R. Wattenhofer, “Physical algorithms,” in Lecture Notes in Computer Science (including subseries Lecture Notes in Artificial Intelligence and Lecture Notes in Bioinformatics), 2010, vol. 6199 LNCS, no. PART 2, pp. 38–51.
[17]J. Al-Enezi, M. Abbod, and S. Alsharhan, “Artificial Immune Systems-models, algorithms and applications,” Int. J. Res. Rev. Appl. Sci., vol. 3, no. May, pp. 118–131, 2010. [18]K. Trojanowski and S. T. Wierzchoń, “Immune-based algorithms for dynamic optimization,” Inf. Sci. (Ny)., vol. 179, no. 10, pp. 1495–1515, 2009.
[19]P. Jarosz and T. Burczyski, “Coupling of immune algorithms and game theory in multiobjective optimization,” in Lecture Notes in Computer Science (including subseries Lecture Notes in Artificial Intelligence and Lecture Notes in Bioinformatics), 2010, vol. 6114 LNAI, no. PART 2, pp. 500–507.
[20]N. H. Hashim, T. K. A. Rahman, M. F. A. Latip, and I. Musirin, “Application of ANN to determine the OLTC in minimizing the real power losses in a power system,” in National Power Engineering Conference, PECon, 2003, pp. 66–70.
[21]A. Heidari, V. G. Agelidis, and H. Zayandehroodi, “Reliability Worth Analysis of Distributed Generation Enhanced Distribution System Optimal Radial Basis Function Neural Network,” in Power Engineering and Optimization Conference (PEOCO), 2013, pp. 641–646.
[22]T. G. Manjunath and A. Kusagur, “Analysis of Different Meta Heuristics Method in Intelligent Fault Detection of Multilevel Inverter with Photovoltaic Power Generation Source,” Int. J. Power Electron. Drive Syst., vol. 9, no. 3, p. 1214, 2019.
[23]M. E. Baran and F. F. Wu, “Optimal sizing of capacitors placed on a radial distribution system,” IEEE Trans. Power Deliv., 1989.
[24]R. Syahputra and I. Soesanti, “An artificial immune system algorithm approach for reconfiguring distribution network,” AIP Conf. Proc., vol. 1867, 2017.
[25]S. N. B. Z. Siti Rafidah Abdul Rahim, Syahrul Ashikin Azmi, Mohd Herwan Sulaiman, Muhamad Hatta Hussain, “a Study on Optimizing Techniques for the Sizing of Dg in Distribution System,” Electr. Energy Ind. Electron. Syst., no. December, pp. 1–5, 2009.