Application of Data Mining with Association Rules to
Review Relationship between Insured, Products
Selection and Customer Behavior
Ase Suryana
1,*, Erwin Yulianto
21
Widyatama University, Indonesia 2
Langlangbuana University, Indonesia
Copyright©2019 by authors, all rights reserved. Authors agree that this article remains permanently open access under the terms of the Creative Commons Attribution License 4.0 International License
Abstract
The world of insurance business that is full of competition makes the perpetrators must always think about breakthrough strategies that can guarantee the continuity of their insurance business. One of the main assets owned by insurance companies is business data in an extraordinary amount. Data mining is a new technology that is very useful to help insurance companies find very important information from business data as the main asset they have. Data mining can predict trends and traits of business behavior that are very useful to support important decision making. Automated analysis carried out by data mining exceeds that carried out by traditional support systems. Apriori and FP-Growth are the most famous algorithms for finding high frequency patterns, these algorithms are part of the Rule Association used in this study.Keywords
Data Mining, Association Rules, FP Growth, Apriori Algorithm, Customer Behavior1. Introduction
The world of insurance business that is full of competition makes the perpetrators must always think of breakthrough strategies that can guarantee the continuity of their insurance business. One of the main assets owned by insurance companies is business data in an extraordinary amount. This gave birth to a need for technology that could use it to generate new knowledge, which could help in regulating insurance business strategies.
The interest of customers is recorded in the questionnaire data, which is usually filled by customers when applying for insurance. This data is usually stored for 5 years in the Core System database. The amount of data is also quite large, which is as many as 3 million records so that it can represent if used as a data mining source.
Questionnaire data has been only used for the basis of making policy and after that, it is barely used, even though it can be used to obtain information that may be needed by the company.
Customer interest data processing will provide an overview to the company of the global market's desire. This is very useful in determining products that can be accepted and needed by customers. The product has a broad understanding of everything that is offered, owned, used, or consumed so that it can satisfy desires and needs. The presence of products offered by companies with good quality will certainly attract the interest of customers and prospective customers to buy these products and to become permanent customers in these products. The better quality of products offered by a company, of course, will affect the interest of customers to insured so it will sell well in the market and will have an impact on the company's profit.
Data mining is a new technology that is very useful to help insurance companies to find very important information from business data as their main asset. Data mining can predict trends and traits of business behavior that are very useful to support important decision making in determining strategies that can guarantee the continuity of their insurance business. Automated analysis carried out by data mining exceeds that carried out by traditional decision support systems that have been widely used in general, thus encouraging the author to take research on the application of Data Mining with Association Rules to see the relationship between Insured, Product Selection and Customer Behavior.
2. Literature Review
2.1. Data Mining
knowledge or a process that uses statistical techniques, mathematics, artificial intelligence, imitation and machine-learning to extract and identify useful information for related knowledge from various big databases (Therling K, 2006). Data mining is also referred to a series of processes to explore added value in the form of knowledge that has not been known manually from a data set (Pramudiono, 2007). Data mining, often also referred as Knowledge Discovery in Database (KDD). KDD is an activity that includes collecting and using historical data, to find regularity, patterns or relationships in large data sets (Santosa, 2007).
Data mining is an activity of finding interesting patterns from large amounts of data. Data can be stored in a
database, data warehouse, or other information storage. Data mining is related to other fields of science, such as database systems, data warehousing, statistics, machine learning, information retrieval, and high-level computing. In addition, data mining is supported by other sciences such as neural networks, pattern recognition, spatial data analysis, image database, and signal processing (Han, 2006).
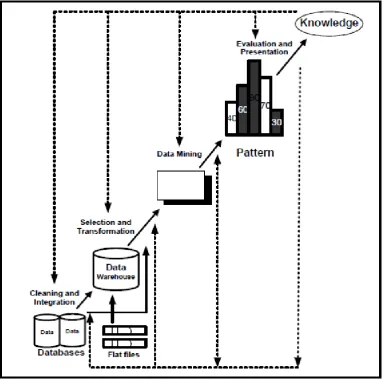
As a series of processes, data mining can be divided into several stages illustrated in Figure 1. These stages include Data Cleaning, Data Integration, Data Selection, Data Transformation, Mining Process, Pattern Evaluation, and Knowledge Presentation which are interactive. Users are directly involved or through the knowledge base.
[image:2.595.104.491.264.652.2](Source : Han, 2006)
2.2. Customer Behavior
Consumer behavior is a study of how individuals, groups and organizations and processes are carried out to select, secure, use and stop products, services, experiences or ideas to satisfy their needs and impacts on consumers and society (Kotler & Lan Keller, 2008)
In this study, the behavior of customers that will be studied, such as purchasing new policies, Top Up, Freelook, Partial Withdraw and Surrender. Some insurance terms are used, namely (Sanabila, 2016; Chou, et.al 2014):
1. The Insured is someone whose has life insurance agreement held for his soul.
2. Top Up is the addition of investment funds outside the payment of the basic insurance premium
3. Freelook is a period of 14 days when the policy holder can cancel the policy if he does not agree to the terms and conditions in the policy provisions for any reason. The company will refund the premium paid less the cost of cancellation of the policy.
4. Partial Withdrawal is a partial withdrawal of investment funds
5. Surrender is a written request from the policy holder to terminate the policy before the end of the insurance period.
2.3. Association Rules
Association rules or affinity analysis are related to the study of "what is together", such as transactions study in a supermarket. For example, someone who buys baby milk is also buys baby bath soap. In this case it means baby milk along with baby bath soap, because it originally came from the study of customer transaction databases to determine the habits of a product purchased with what products, then the association rules are also often called market basket analysis. The association rules want to provide this information in the form of "if-then" relationships. This rule is calculated from probabilistic data (Santosa, 2007).
Association analysis is also known as one of the data mining methods that forms the basis of various other data mining methods. In particular, one stage of association analysis called high frequency pattern analysis (frequent pattern mining) attracts the attention of many researchers to produce efficient algorithms. The importance of an associative rule can be known by two parameters, support value, which is the percentage of combination items in the database and confidence (certainty value), is the strong relationship between items in associative rules. Association analysis is defined as a process to finding all associative rules that meet the minimum requirements for support (minimum support) and minimum requirements for confidence (minimum confidence) (Pramudiono, 2007).
There are several algorithms that have been developed regarding association rules, but there is one classic algorithm that is often used, namely the priori algorithm. The basic idea of this algorithm is to develop frequent
itemset. By using one item and recursively developing frequent itemset with two items, three items and so on to frequent itemset with all sizes. To develop frequent sets with two items, can use frequent set items. The reason is if that a set of items does not exceed the minimum support, then any random larger itemet size will not exceed that minimum support.
In general, developing sets with fc-items uses frequent sets with k–1 items developed in the previous step. Each step requires a single check to the entire database. In the association there are terms antecedent and consequent. Antecedent represent the part of "if" and consequent to represent the part of "then”. In this analysis, antecedent and consequent are a group of items that do not have a relationship together (Santosa, 2007). From the large number of rules that might be developed, it is necessary to have rules that are quite strong with the level of dependence between items in antecedent and consequent. To measure the strength of the rules of this association, measures of support and confidence were used. Support is the ratio between the number of transactions that contain antecedent and consequent with transactions number. Confidence is the ratio between the number of transactions that include all items in the antecedent and consequent with the number of transactions covering all items in the antecedent which are explained in the following 2 equations.
Information: S = Support
𝛴𝛴 (𝑇𝑇𝑎𝑎 + 𝑇𝑇𝑐𝑐) = The number of transactions containing antecedent and consequencent
Σ (𝑇𝑇) = Number of transactions
Information: C = Confidence
𝛴𝛴 (𝑇𝑇𝑎𝑎 + 𝑇𝑇𝑐𝑐) = The number of transactions containing antecedent and consequencent
transactions in the database containing both items in the 2-itemset candidate. After the support of all 2-itemset candidates is obtained, the 2-itemset candidate that meets the minimum support requirements can be specified as a 2-itemset which is also a high frequency pattern with a length of 2. (Pramudiono, 2007).
For the next phase, the k-iterations can be divided into several parts:
1. Formation of candidate items. The k-itemset candidate is formed from a combination (k-1) - itemset obtained from the previous iteration. One characteristic of a priori algorithm is the trimming of k-itemset candidates whose subset containing k-1 items which is not included in the high-frequency pattern with the length of k-1.
2. Support calculation for each k-itemset candidate. Support from each k-itemset candidate is obtained by scanning the database to calculate the number of transactions that contain all the items in the k-itemset candidate. This is also a feature of apriori algorithm, which is necessary to calculate by scanning the entire database as long as the k-itemset.
3. Set high frequency patterns. High frequency patterns that contain k items or k-itemset are set from k-itemset candidates whose its support is greater than the minimum support and then the confidence of each item combination is calculated. The iterations stop when all items have been counted until there are no more item combinations. (Pramudiono, 2007) In summary, the a priori algorithm is as follows:
Besides the priori algorithm, there are also other algorithms such as FP-Growth. The difference between priori algorithm with FP-Growth is on the number of database scans. The priori algorithm scans the database every time iterates while the FP-Growth algorithm only does it once at the beginning (Bramer, 2007; Edwin, et.al 2017).
Based on some meanings above, the Case Study of the Association Rule is a study in a place that is determined to see the relationship between the antecedent and consequent that you want to know using the specified algorithm.
2.4. Rapid Miner
Rapid Miner is an open source software. Rapid Miner is a solution for analyzing data mining, text mining and prediction analysis. Rapid Miner uses a variety of descriptive and predictive techniques to provide insight to
users so that they can make the best decisions. Rapid Miner has approximately 500 data mining operators, including operators for data input, information output, data preprocessing and visualization. Rapid Miner is stand-alone software for data analysis and as a data mining machine that can be integrated into its own products. Rapid Miner is written by using the java language so that it can work on all operating systems.
Previously, Rapid Miner called YALE (Yet Another Learning Environment), where the initial version began to be developed in 2001 by Ralf Klinkenberg, Ingo Mierswa, and Simon Fischer at the Artificial Intelligence Unit of Dortmund University. Rapid Miner is distributed under the AGPL license (GNU Affero General Public License) version 3. Until now, thousands of applications have been developed using Rapid Miner in more than 40 countries. Rapid Miner as an open source software for data mining need not be doubted because this software is already the world's leading. Rapid Miner was ranked first as data mining software in a poll by KDnuggets, a data-mining portal in 2010-2011.
3. Research Method
The research method applied in this study is Descriptive Quantitative. The descriptive method of this case study presents a problem by collecting data and presenting data on research object. In this study the authors analyzed customer questionnaire data stored in the insurance company database core system. In addition to the data, it is also combined with the policy master data and the policy activity log. All of the data is processed with the help of the Rapid Miner. The purpose of this research using descriptive quantitative method is to make a systematic, factual, and accurate description of the facts, characteristics and relationships between the investigated phenomena to draw conclusions from the discussions conducted.
In this study, we wanted to know the relationship between the insured, the chosen insurance product and customer behavior after the policy was purchased. The stages are:
1. Data obtained from the company database is first removed from noise, inconsistent data, or data that is not relevant to the data mining hypothesis that will be done.
2. Because data obtained is not only from one file, the next step is to combine the questionnaire data, policy master, and policy activity log into a new database. 3. Select what attributes will be processed in data
mining.
4. Compile the data or merge it into a suitable format for data mining process.
6. Evaluate whether the results obtained are in accordance with the desired rules or not.
4. Discussion
4.1. Data Mining Analysis
In this study, the value of support and confidence will be sought from the relationship between background of the policy purchase by looking at the insured, product purchasing and customer behavior. Whereas the behavior can be categorized as the act of the customer such as policy cancellation before 30 days, partial funds withdrawal and closing of the policy.
Data that is too random will make the mining process take a long time and the level of the relationship will be low, so that mining will be processed include:
1. Relationship between the insured's and the purchase of policy products
2. Relationship between insured, selected products and the new policy issuance.
3. Relationship between the insured's, the product chosen and policy closing before 30 days.
4. Relationship between insured, selected products and partial funds withdrawal
5. Relationship between insured, the product chosen, and policy closing
4.2. Resource Analysis
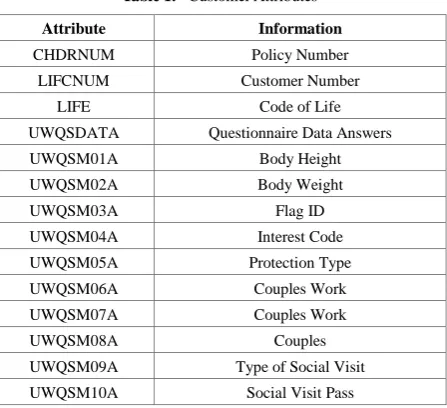
[image:5.595.308.537.140.268.2]Data used in this research consists of three data sources, namely customer questionnaire data, policy master data and policy activity log. Customer Questionnaire data is the customer data that must be filled in by the customer when applying for an insurance policy. Existing attributes can be seen in table 1 below.
Table 1. Customer Attributes
Attribute Information
CHDRNUM Policy Number LIFCNUM Customer Number
LIFE Code of Life UWQSDATA Questionnaire Data Answers UWQSM01A Body Height UWQSM02A Body Weight
UWQSM03A Flag ID
UWQSM04A Interest Code UWQSM05A Protection Type UWQSM06A Couples Work UWQSM07A Couples Work
UWQSM08A Couples
UWQSM09A Type of Social Visit UWQSM10A Social Visit Pass
[image:5.595.305.538.330.676.2]Policy Master Data is the policy data owned by the customer after the customer's submission has been approved by the company. Existing attributes can be seen in table 2 below.
Table 2. Policy Master Data
Attribute Information
CHDRNUM Policy Number
CLNTNUM Policy Holder Customer Number
CHDRTYPE Product Code
HISSDTE Applying Police Started Date
STATCODE Policy Status
BILLODATE Billing Date
PAIDTODATE Due Date
[image:5.595.64.288.544.748.2]Policy activity log data is the data of all policy activities from the date of issuance until the policy is expired. Existing attributes can be seen in table 3 below.
Table 3. Policy Activity Log Data
Attribute Information
CHDRPFX Cont Header Prefix
CHDRCOY Cont Header Company
CHDRNUM Contract Number
RECODE Record Code
TRANNO Transaction Number
PTRNEFF Ptrn Effective Date
TRDT Transaction Date
TRTM Transaction Time
TERMID Terminal Id
USER User Number
BATCPFX Batch
BATCCOY Batch
BATCBRN Batch
BATCACTYR Batch
BATCACTMN Batch
BATCTRCDE Batch Transaction
BATCBATCH Batch Batch
PRTFLG Print Flag
VALIDFLAG Valid Flag
USRPRF User Profile
JOBNM Job Name
DATIME Timestamp
DATESUB Date Submitted
and load) when building a data warehouse, in data ETL processes in the data source is combined into one data warehouse with the CHDRNUM or CLNTNUM key.
4.3. Use of Algorithm
The Apriori and FP-Growth algorithms are the most famous algorithms to finding high frequency patterns. High frequency patterns are item patterns in a database that have a frequency or support above a certain threshold called the minimum support or threshold. Threshold is the minimum transaction limit. If the number of transactions is less than the threshold, the item or combination of items will not be included in the next calculation.
[image:6.595.308.537.123.228.2]The using of thresholds can speed up calculations. The apriori algorithm is divided into several stages called iterations. Each iteration produces a high frequency pattern of the same length starting from the first pass which produces a high frequency pattern with the length of one. In first iteration, support for each item is calculated by scanning the database. After support from each item is obtained, items that have support greater than minimum support are chosen as high frequency patterns with length is 1 or often abbreviated as 1-itemset. The abbreviation of k-itemset means a set consisting of k items. The stages of data mining processing, such as incoming data, can be seen in table 4 below.
Table 4. Initial Data
Policy
Number Insured
Product Code
Customer Behaviour
A0000001 Self U1B Buy New Policy A0000002 Self U1B Top Up A0000003 Father U1H Buy New Policy A0000004 Mother U1B Freelook A0000005 Wife U1H Freelook A0000006 Self U1H Buy New Policy A0000007 Self U1B Buy New Policy A0000008 Mother U1B Surrender A0000009 Mother U1B Surrender A0000010 Self U1H Freelook
From the initial data, obtained the first candidate (C1) as in table 5.
Table 5. First Candidate (C1)
ItemSet Count
Self 5
Father 1
Mother 3
Wife 1
U1B 6
U1H 4
Buy New Policy 4
Top up 1
Freelook 3
Surrender 2
Set threshold = 3, the candidate whose value is less than 3 will be deleted. So, we get the results as in table 6 (L1).
Table 6. Results after Threshold Set (L1)
ItemSet Count
Self 5
Mother 3
U1B 6
U1H 4
Buy New Policy 4
Freelook 3
[image:6.595.306.538.274.354.2]After the second iteration, the second candidate is obtained (C2) as in table 7.
Table 7. Second Candidate (C2)
ItemSet Count
Self, U1B 3
Self, U1H 2
Mother, U1B 3
Mother, U1H 0
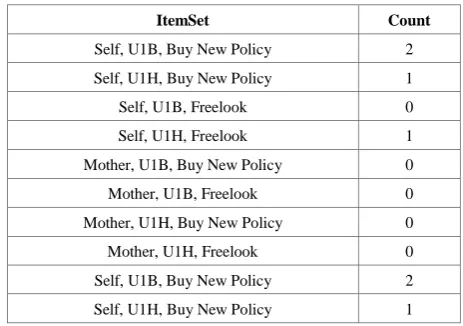
[image:6.595.304.536.392.555.2]After the third iteration, results are obtained as in table 8. Table 8. Third Iteration Results
ItemSet Count
Self, U1B, Buy New Policy 2
Self, U1H, Buy New Policy 1
Self, U1B, Freelook 0
Self, U1H, Freelook 1
Mother, U1B, Buy New Policy 0
Mother, U1B, Freelook 0
Mother, U1H, Buy New Policy 0
Mother, U1H, Freelook 0
Self, U1B, Buy New Policy 2
Self, U1H, Buy New Policy 1
Based on tables 7 and 8 above, if included in the Conventions and Support equation, the following results can be taken:
1.
Support Self, U1B, Buy New Policy =
𝑆 =𝑐𝑐𝑜𝑢𝑛𝑡(𝑆𝑒𝑙𝑓, 𝑈1𝐵, 𝐵𝑢𝑦 𝑁𝑒𝑤 𝑃𝑜𝑙𝑖𝑐𝑐𝑦)𝑁𝑢𝑚𝑏𝑒𝑟 𝑜𝑓 𝑇𝑇𝑟𝑎𝑎𝑛𝑠𝑎𝑎𝑐𝑐𝑡𝑖𝑜𝑛 =102
2.
Confidence Self, U1B, Buy New Policy =
[image:6.595.59.292.409.566.2]3.
Support Self, U1H, Buy New Policy =
𝑆 =𝑐𝑐𝑜𝑢𝑛𝑡(𝑆𝑒𝑙𝑓, 𝑈1𝐻, 𝐵𝑢𝑦 𝑁𝑒𝑤 𝑃𝑜𝑙𝑖𝑐𝑐𝑦)𝑁𝑢𝑚𝑏𝑒𝑟 𝑜𝑓 𝑇𝑇𝑟𝑎𝑎𝑛𝑠𝑎𝑎𝑐𝑐𝑡𝑖𝑜𝑛 =101
4.
Confidence Self, U1H, Buy New Policy =
𝑆 =𝑐𝑐𝑜𝑢𝑛𝑡(𝑆𝑒𝑙𝑓, 𝑈1𝐻, 𝐵𝑢𝑦 𝑁𝑒𝑤 𝑃𝑜𝑙𝑖𝑐𝑐𝑦)𝑐𝑐𝑜𝑢𝑛𝑡(𝑆𝑒𝑙𝑓, 𝑈1𝐻) =102
4.4. Function Modelling
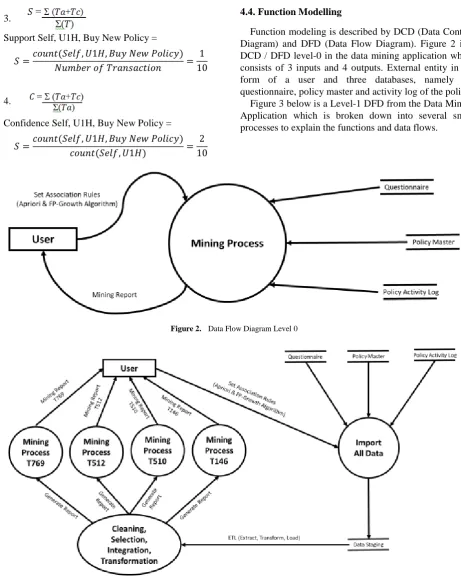
Function modeling is described by DCD (Data Context Diagram) and DFD (Data Flow Diagram). Figure 2 is a DCD / DFD level-0 in the data mining application which consists of 3 inputs and 4 outputs. External entity in the form of a user and three databases, namely the questionnaire, policy master and activity log of the policy.
Figure 3 below is a Level-1 DFD from the Data Mining Application which is broken down into several small processes to explain the functions and data flows.
Figure 2. Data Flow Diagram Level 0
[image:7.595.63.525.74.656.2]Following are the processes contained in the Data Mining Application:
1. Import Data, which is the process of loading data from three databases (questionnaire, policy master and policy activity log data) to a new database (Date Staging). All data will be entered without filtering. 2. Cleaning, Integration, Selection, and Transformation a. Cleaning data is a process of removing noise and
inconsistent or irrelevant data.
b. Data integration is the merging of data from various databases into one new database (data staging). Questionnaire, policy master data and policy activity log data are stored into one database.
c. Data Selection is the process of selecting what attributes will be processed in subsequent mining. d. Data transformation is the process of converting data
or combined it into a format suitable for processing in data mining.
3. Products mining process is a mining process to find out the relationship between product selection and the insured
4. T679 (Top Up) mining process is a mining process to determine the relationship of the insured, product selection with the addition of Top Up.
5. T512 (Surrender) mining process is a mining process to find out the relationship of the insured, product selection with the closing of the policy.
6. T510 (Partial Withdraw) mining process is a mining process to find out the relationship of the insured, the selection of products with partial funds withdrawal. 7. TI46 (Freelook) mining process is a mining process to
determine the relationship of the insured, product selection with closing policy after a 1 month review
5. Implementation
5.1. Data Input Tools
From ETL data results in the database, obtained three data store, namely the questionnaire, policy master and policy activity log. Based on the three data stores, then do items selection that will be used for data mining process, carried out cleansing, integration and data transformation so that they are ready to be processed by Rapid Miner. The following figure 4 contains the data source that will be obtained:
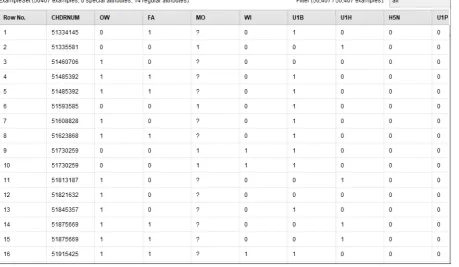
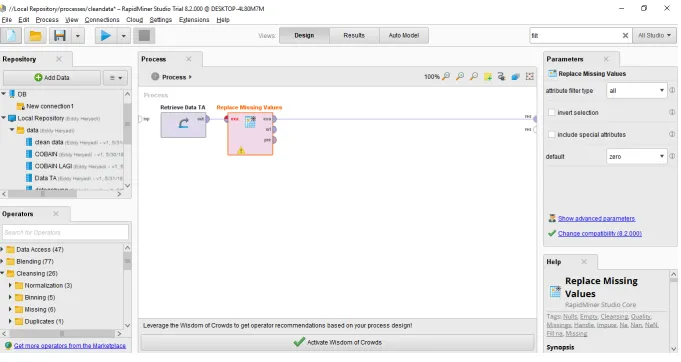
[image:8.595.73.533.389.656.2]After checking, it turns out that there are still fields that contain empty data, so the cleansing process will be carried out using Rapid Miner as shown in Figure 5 below.
Figure 5. Data Missing
[image:9.808.69.743.95.471.2]Figure 6. Data Missing Correction Process
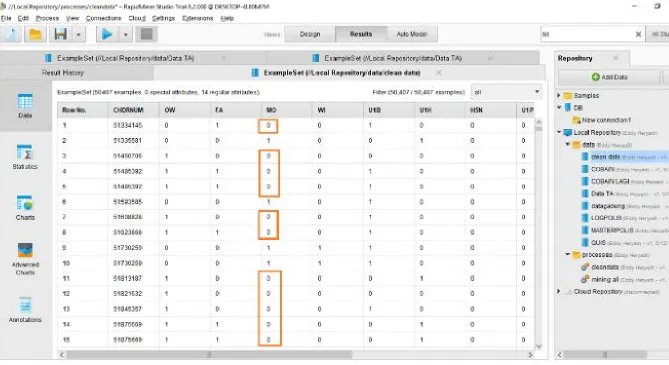
[image:10.808.67.748.77.439.2]Figure 7. Clean Data Input
5.2. Data Mining Process
The sequence of processes for data mining can be seen as follows:
[image:11.808.69.738.79.444.2]Figure 8. Data Mining Process
[image:12.808.66.743.79.442.2]Figure 9. Data Mining Process Result
[image:13.808.198.747.75.450.2]Figure 11. Data Mining Process Filter Conditions
6. Conclusions and Recommendations
6.1. Conclusions
The conclusion that can be taken in the execution of this research is the process of Data Mining can be used to display information on the relationship between the insured, product selection and customer behavior as follows (Pencearelli et al., 2018):
1. Related to relationships between insured and product selection, for self-insured value and U1B products have the highest level of Confidence and Support. 2. Relationship between the Insured, product selection
and positive behavior of insurance customers with the policies they bought. The results obtained by the tendency of policies purchased for themselves have positive behaviors compared to parents.
3. Relationship between the Insured, product selection and negative behavior of insurance customers with the policies they bought. The results obtained by the tendency of policies purchased for parents have negative behavior compared to themselves.
6.2. Recommendations
For the development of a better Data Mining Application, it will be further developed by using more item quantities for a wider period of time. In addition, the relationship seen can be varied with other items, such as customer behavior in submit a policy claim whether health, accident or death associated with body weight, body height, smoking habits, etc.
REFERENCES
[1] Al Fata, Hanif Universitas Amikom, 2007,” Analisis dan Perancangan Sistem Informasi untuk Keunggulan Bersaing Perusahaan dan Organisasi Modern”, Penerbit Andi, Jogjakarta
[2] Bramer, Max, 2007, “Principles of Data Mining”, Springer, London
[3] Elmasri, Ramez & Shamkant B. Navathe, 2000, “Fundamentals of Database Systems. Third Edition”, Addison Wesley Publishing Company, New York.
[4] Han, J. & Kamber, M, 2006, “Data Mining Concepts and Techniques Second Edition”. Morgan Kauffman, San Francisco.
[5] Kadir, Abdul, 1999, “Konsep dan Tuntunan Praktis Basis Data”, Penerbit Andi, Yogyakarta.
[6] Kotler, Philip & Lan Keller, Kevin, Manajement Pemasaran, Indonesia, PT Macanan Jaya Cemerlang, 2008
[7] Pencarelli, T., Škerháková, V., Ali Taha, V., & Valentiny, T. (2018). Factors Determining Italian Online Shoppers’
Preference of Cash on Delivery: Empirical Analysis, Polish Journal of Management Science, 18 (2), 245 – 258.
[8] Rainardi, Vincent, 2008, “Building a Data Warehouse with Examples in SQL Server”, Springer, New York
[9] Santosa, Budi, 2007, “Data Mining Teknik Pemanfaatan Data untuk Keperluan Bisnis”, Graha Ilmu, Yogyakarta
[10] Sharma, G., & Yadav, A. 2018. Fault Tolerance in Real Time Distributed System. Review of Computer Engineering Research, 5(2), 20-24.
[11] Setiawan, Awan & Rusmawan, Dadan, 2017, “Graduate Rate Analysis of Student Using Data Mining and Algorithm Apriori”, International Journal of Soft Computing, Vol. 12, No. 5, p287-293
[12] Suryana, Ase., Yulianto, Erwin., Pratama, & Khrisna Dea, 2017, “Perancangan Sistem Pendukung Keputusan Penilaian Prestasi Pegawai Terbaik Menggunakan Metode SAW, AHP & TOPSIS”, Jurnal Ilmiah Teknologi Informasi Terapan (Jitter), Vol. 3, No. 2, p130-139, Universitas Widyatama, Bandung
[13] Therling K. (2006). “An Introduction to DataMining: Discovering hidden value in your data warehouse”, www.thearling.com, diakses tanggal 15 April 2018
[14] Yulianto, Erwin., Setiawan, Awan., 2018, “Optimasi Rute Sales Coverage Menggunakan Algoritma Cheapest Insertion Heuristic Dan Layanan Google Maps API”, Information System Journal (Internal), Vol. 1, No. 3, p38-52, STKOM Al Ma’soem, Bandung
[15] Chou, C. M., Shen, C. H., Hsiao, H. C., & Chen, S. C. (2014). Factors Affecting Entrepreneurial Internship Effectiveness In It Industry: A Structural Equation Modeling. Review of Industrial Engineering Letters, 1(1), 36-43.