Journal of Chemical and Pharmaceutical Research, 2015, 7(10S):187-192
Research Article
CODEN(USA) : JCPRC5
ISSN : 0975-7384
Association between SLC30A8 C/T (rs13266634) polymorphism and type 2
diabetes mellitus (T2DM): A meta-analysis of case-control studies
Thirunavukkarasu Ramasamy and Jayalakshmi Mariakuttikan*
Department of Immunology, School of Biological Sciences, Madurai Kamaraj University, Tamil Nadu, India _____________________________________________________________________________________________
ABSTRACT
Type 2 Diabetes Mellitus (T2DM) is the most common metabolic disease characterized by hyper-glycemia, due to impaired insulin secretion or action. One of the most studied genes is SLC30A8 (ZnT8) which is expressed majorly in pancreatic β-cells and participates in storage and transport of insulin. To analyze the association between Zn+ transporter 8 gene (SLC30A8 rs 13266634) polymorphism and T2DM. In this study a systematic electronic search in PubMed, Google Scholar, Embase, Science Direct and Web of Science was carried out by two investigators. Pooled odds ratios (ORs) with 95% confidence intervals (95% CIs) were calculated to assess the strength of the association by using MedCalc® 15.4 software. Based on the inclusion and exclusion criteria, fourteen studies belonging to the Asian population involving 9232 T2DM patients and 8384 controls were considered in the Meta-analysis. The combined overall analysis revealed that the CC genotype of SLC30A8 C/T polymorphism exhibited a significant association with T2DM (Dominant model: OR=0.858; 95% CI=0.792-0.929; P<0.001) explaining the risk of C allele with diabetes. In the subgroup dominant model frequency comparison also the results indicated that rs13266634 C/T polymorphism was significantly associated with increased T2DM risk among E. Asians (OR = 0.612, 95% CI: 0.539 –0.6996, P < 0.001). Similarly, the Additive model revealed association of C/T with T2DM risk in S. Asians (OR = 0.967, 95% CI: 0.799 –1.17, P < 0.047). The present meta-analysis result indicates that C allele of SLC30A8 C/T polymorphism is associated with risk of T2DM in the Asian continent. However, larger prospective studies are needed to validate such meta-analysis.
Keywords: ZnT8 gene; Type 2 Diabetes mellitus; Genetic Polymorphism;SLC30A8rs13266634; Meta-analysis.
_____________________________________________________________________________________________
INTRODUCTION
EXPERIMENTAL SECTION
Search strategy
This study carried out a systematic electronic search in PubMed, Google Scholar, Embase, Science Direct and Web of Science by two investigators. We focused on the most-studied rs13266634 C/T polymorphism, and identified all the relevant papers published in English, using the key words, case-control study of Type 2 diabetes; polymorphism of SLC30A8; polymorphism of ZnT8; rs13266634 in combination with T2DM. We included only those studies which were carried out from the geographical area of the Asian continent. Published manuscripts from electronic databases were retrieved and analyzed. The inclusion criteria were as follows: (1) original studies in case–control study design; (2) the number of subjects reported with each allele or genotype in cases and controls; (3) sufficient published data for estimating an odds ratio (OR) with 95% confidence interval (CI) or provided raw data that allowed us to calculate them. Animal studies, case reports, review articles, abstracts, editorials, reports with incomplete data, and studies based on pedigree data were excluded.
Data extraction
Two investigators independently extracted data using a standard form and reached consensus. The following data were collected from each study: the first author’s name, publication date, ethnicity, country, sample size, genotyping method, allele frequency and odds ratio. Based on inclusion and exclusion criteria, fourteen studies from Asian population involving 9232 T2DM patients and 8384 controls were considered for the Meta-analysis.
Statistical analysis
[image:2.595.93.530.474.737.2]The statistical analysis was performed using MedCalc® 15.4 software. The association between SLC30A8 (rs13266634) C/T polymorphism and risk of T2DM was interpreted by calculating OR with 95% CI that were used to assess the strength of association in the meta-analysis. The significance of the pooled OR was determined by the Z-test, and P < 0.05 was considered statistically significant. The allelic contrast (C versus T, allelic model) and the following genotype contrasts: homozygotes CC versus homozygotes TT (CC versus TT, additive model); homozygotes CC versus a combination of CT and TT (CC versus CT + TT, dominant model) and a combination of CC and CT versus TT (CC + CT versus TT, recessive model) were analyzed. Forest plot was selected for representation of the data. The Q test was used to measure the weighted sum of squares on a standardized scale to assess the heterogeneity between the data. Further I2 value was calculated which denotes the percentage of observed total variation across the studies that are due to real heterogeneity rather than chance. A value of zero percent indicates no observed heterogeneity, and larger values show increasing heterogeneity. The Begg’s funnel plot was used to test the publication bias among the included studies.
Table: 1 Characteristics of the individual studies and distribution of SLC30A8 C/T (rs 13266634) genotype and allele among T2DM patients and controls, included for meta-analysis
Study Arms C T CC CT TT HWE Population
Horikoshi et al.(2007) case (n= 860) 681 1039 149 383 328
control (n= 859) 738 980 172 394 293 0.06 Japanese
Ng et al. (2007) case (n= 433) 940 26 408 24 1
control (n= 419) 818 20 399 20 0 0.617 Hong Kong
Chang et al.(2007) case (n= 760) 1483 37 724 35 1
control (n= 760) 1476 44 716 44 0 0.411 Taiwan
Sanghera et al.(2008) case (n=532 ) 775 289 290 195 47
control (n= 386) 511 187 188 135 26 0.795 N. Indian
Lee et al.(2008) case (n=908 ) 1107 709 324 459 125
control (n= 207) 560 444 156 248 98 0.974 Korean
Ren et al. (2008) case (n=481 ) 917 45 438 41 2
control (n= 207) 952 30 463 26 2 0.0189 Beijing
Rong et al. (2009) case (n= 1381) 2521 241 1156 209 16
control (n= 1766) 3206 326 1455 296 15 0.989 Pima Indian
Potapov et al.(2010) case (n=588 ) 931 245 350 231 7
control (n= 597) 880 314 318 244 35 0.184 Russian
Lin et al. (2010) case (n=1529 ) 2874 184 1348 178 3
control (n= 1439) 2763 111 1328 107 4 0.242 Chinese
Mohaddese et al.(2012) case (n= 125) 187 63 62 63 0
control (n= 125) 177 73 53 71 1 0.00002 E. Azerbaijan
Zheng et al.(2012) case (n= 227) 244 210 65 114 48
control (n= 152) 172 132 48 76 28 0.828 Chinese
Kommoju et al.(2013) case (n= 758) 1168 318 440 288 30
control (n= 60) 1046 319 379 211 31 0.812 S. Indian
Bazzi et al.(2014) case (n= 90) 145 33 62 21 6
control (n= 96) 164 28 69 26 1 0.393 Saudi
Fghih et al.(2014) case (n=151 ) 231 71 90 51 10
control (n= (155) 227 83 89 49 17 0.015 Iranian
RESULTS
Included studies
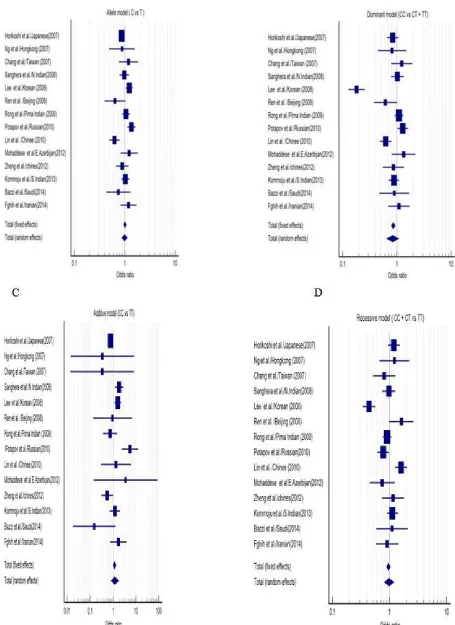
Fig 2:Forest plots for association between SLC30A8 C/T gene polymorphism and T2DM:A) allele model (Avs T); B) dominat model ( CC vs CT+ TT); C) additive model (CC + TT) and D) recessive model (CC + CT vs TT). The area of the squares reflects the study specific
weight. The diamond shows the summary random-effects odds ratio estimate from 14 studies
Table 2: Summary risk estimates for association between SLC30A8 rs13266634 C>T polymorphism and T2DM
Genetic contrasts Ethnic group Studies (n) OR (95% CI) P value Heterogeneity
Q- test I2 (%) P value
C vs T Overall 14 0.951 (0.895 - 1.01) P=0.101 117.87 88.97 P<0.0001
W. Asian 3 1.1 (0.865 - 1.4) P=0.437 2.3121 13.5 P=0.3147
E. Asian 7 0.93 (0.854 - 1.013) P=0.97 27.72 78.36 P<0.0001
S. Asian 3 1.032 (0.926 - 1.151) P=0.572 0.3262 0 P=0.8495
CC vs TT Overall 14 1.16 (0.997 -1.35) P=0.055 44.6 70.85 P<0.0001
W. Asian 3 1.149(0.576 - 2.29) P=0.693 4.82 58.54 P=0.0896
E. Asian 7 0.967 (0.799 - 1.17) P=0.731 16.934 64.57 P<0.0095
S. Asian 3 1.35 (1.005 - 1.825) P<0.047 4.89 59.1 P=0.0867
CC vs CT+TT Overall 14 0.858 (0.792 - 0.929) P<0.001 113.68 88.56 P<0.0001
W. Asian 3 1.125 (0.836 - 1.514) P=0.436 0.957 0 P=0.619
E. Asian 7 0.612 (0.539 - 0.696) P<0.001 66.91 91.03 P<0.0001
S. Asian 3 1.006 (0.887 - 1.140) P=0.929 2.24 10.66 P=0.3265
CC+CT vs TT Overall 14 0.958 (0.886 - 1.037) P=0.289 68.26 80.96 P<0.0001
W. Asian 3 0.889(.661 - 1.196) P=0.436 0.96 0 P=0.62
E. Asian 7 0.995 (0.881 - 1.122) P=0.931 60.6 90.1 P<0.0001
S. Asian 3 0.994 (0.877 - 1.127) P=0.929 2.24 10.66 P=0.3265
Association of SLC30A8 C/T (rs13266634) and T2DM risk
The combined overall analysis revealed that the CC genotype showed a significant association between SLC30A8 C/T polymorphism and T2DM (Dominant model: OR=0.858; 95% CI=0.792-0.929; P<0.001) Similarly the C allele (Allelic model: OR=0.958, 95% CI=0.886-1.037, P=0.289) and CT heterozygote (Recessive model: OR=0.951, 95% CI=0.895-1.010, P=0.101) also explained the risk of C allele with diabetes. In subgroup dominant model frequency comparison also, the results indicated that rs13266634 C/T polymorphism was significantly associated with increased T2DM risk in E. Asians (OR = 0.612, 95% CI: 0.539 –0.6996, P < 0.001). Similarly, the Additive model revealed association of C/T with T2DM risk in S. Asians (OR = 0.967, 95% CI: 0.799 –1.17, P < 0.047). And when the pooled odds ratio for rs13266634 C/T polymorphism and T2DM risk was calculated under a random-effects model, the results of overall Asians and Sub groups of the Asians (E. Asian, S. Asian, and W. Asian) were similar to those under a fixed-effects model (Table 1).
Heterogeneity test and publication bias
HWE test was performed to detect the genetic equilibrium of each study. The genotypic distributions in the controls of all included studies were in agreement with HWE except for the three studies, Japanese (1), Beijing (15) and E. Azerbaijan (19). In the sub-group population analysis there was heterogeneity observed between several groups. But interestingly, heterogeneity was not observed among the S. Asian populations (Table 2). Publication bias was calculated based on funnel plot representation (Fig: 3) and the shape of funnel plot seemed symmetrical showing the evidence of no bias.
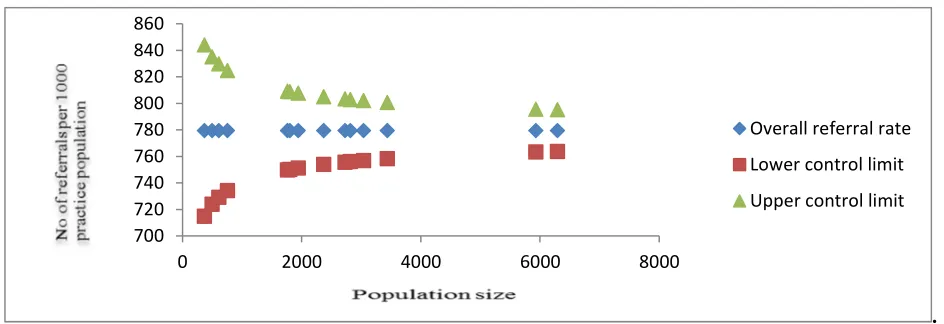
Fig. 3 Funnel plot evaluation for publication bias in Asian T2DM patients and SLC30A8 rs13266634 C>T polymorphism studies
.
DISCUSSION
The pathogenesis of T2DM is complex and genetic factors play a key role in the disease susceptibility. Mutation of SLC30A8 is associated with dysfunction of pancreatic β-cells. Recently number of studies has reported the importance of ZnT8A in the development of diabetes. In most genetic studies, the main functional effect of this polymorphism was a decreased insulin release (21, 22). It was observed in animal model that the Arg325 form(C
700 720 740 760 780 800 820 840 860
0 2000 4000 6000 8000
Overall referral rate
Lower control limit
[image:5.595.70.542.522.684.2]allele) of ZnT8 is less active as Zinc transporter (23). The association between SLC30A8 gene and T2DM has been also confirmed in other meta-analysis (24). The present meta-analysis which was focused on the association between rs 13266634 C/T polymorphism and T2DM analyzing studies carried out in Asian population revealed that genetic variations are significant in T2DM. The data from published studies in this geographic region were combined to estimate genetic association using various models, among which the dominant model showed significance (OR=0.858; 95% CI=0.792-0.929; P<0.001). Further the sub-group analysis among Asian population according to ethnicity, showed significant association in dominant model (OR = 0.612, 95% CI: 0.539 –0.6996, P < 0.001) among E. Asians and Additive model (OR = 0.967, 95% CI: 0.799 –1.17, P < 0.047) among S. Asians. Recently a meta-analysis study by Tan et al. (2009) has also detected a heterogeneity between Asian populations (I2=39%). The SLC30A8 C/T rs13266634 risk allele has an estimated prevalence of 55% in Asians, 75% in Europeans according to Hap-Map data attributing a risk of T2DM around 9.5% in Europeans and 8.1% in East Asians (25). In conclusion the SLC30A8 rs 13266634 polymorphism is among the most replicated genetic markers of T2DM and it has a specific role in Asian population (26). In the present meta-analysis, the C allele of SLC30A8 C/T polymorphism was associated with the risk of T2DM in Asian populations. However, larger prospective studies are needed to validate such meta-analysis.
Acknowledgement
The study was supported by UGC - NRCBS, CAS, DST-PURSE, and UGC – Meritorious fellowship. We are grateful to Miss. Sony Kadiam, Research Scholar, Dept. of Immunology, Madurai Kamaraj University, India for her valuable assistance for writing this manuscript.
REFERENCES
[1] M.A. Permutt; J. Wasson; N. Cox, J Clin Invest, 2005, 115, 1431- 9.
[2] J.R. Perry; T.M. Frayling, Curr Opin Clin Nutr Metab Care, 2008, 11, 371-7. [3] F. Chimienti; S. Devergnas; A. Favier; M. Seve , Diabetes, 2004,53, 2330–7. [4] F.Chimienti; A. Favier; M. Seve, Biometals, 2005,18, 313–7.
[5] N.D. Palmer; M.O. Goodarzi;C.D. Langefeld; J. Ziegler; J.M. Norris; D.M. Haffner, Diabetes 2008, 57, 1093– 100.
[6] V. Steinthorsdottir; G. Thorleifsson; I. Reynisdottir; R. Benediktsson; T. Jonsdottir; G.B. Walters, Nat Genet
2007,39, 770–5.
[7] M. Horikoshi; K. Hara; C. Ito, N. Shojima; R. Nagai; K. Ueki, Diabetologia, 2007, 50, 2461-6. [8] YH. Lee; ES. Kang; SH. Kim; SJ. Han:CH. Kim; HJ Kim , J Hum Genet, 2008, 53, 991-8. [9] MC. Ng; KS. Park;B. Oh; CH. Tam; CYM. Cho; HD , Diabetes 2008, 57, 2226-33.
[10] R. Rong;RL. Hanson; D. Ortiz; C. Wiedrich; S. Kobes; WC. Knowler, Diabetes 2009, 5, 8478-88. [11] Y. Lin; P. Li; L. Cai, BMC Med Genet, 2010, 11, 97.
[12] X. Zheng; Ren W, S. Zhang; Mol Biol Rep. 2012, 39(1),17-23.
[13] DK.Sanghera; Ortega L; Han S, Singh J; Ralhan SK; Wander GS, BMC Med Genet, 2008, 9(59),1–9. [14] V.A. Potapov; M.S.Chistiakov;M.V. Shamkhalova; V.V. Shestakova, Diabetes India, 2009, 219–223. [15] S.M. Mohaddes,F. Karami, J. Gharesouran, and A. Bahrami, Journal of Sciences, 2012, 23(1), 15-20. [16] H. Faghih; S. Khatami; N. Azarpira; A. Foroughmand, Mol Biol Rep,2014, 41, 2709–2715.
[17] M.D. Bazzi; F.A. Nasr; M.S. Alanazi; A. Alamri; A.A. Turjoman; A.S. Moustafa; A.A. Alfadda; A.A.K. Pathan and N.R. Parine, Genet. Mol. Res, 2014, 13 (4), 10194-10203.
[18] U.J. Kommoju; J. Maruda; S. Kadarkarai; K. Irgam; J. P. Kotla; L. Velaga; B. M. Reddy, Meta Gene, 2013, 1, 15–23.
[19] Q. Ren; XY. Han; F. Wang; XY. Zhang; LC. Han;YY. Luo; XH. Zhou; L.N. Ji, Diabetologia, 2008, 51(7), 1146-1152.
[20] YC. Chang; TJ.Chang; YD. Jiang; S. Kuo; KC. Lee; KC.Chiu; LM. Chuang , Diabetes 2007, 56(10),2631-2637.
[21] V. Lyssenko; A. Jonsson; P. Almgren; N. Pulizzi; B. Isomaa ; T. Tuomi T, N Engl J Med , 2008, 359, 2220-32.
[22] H. Staiger; F. Machicao; N. Stefan; O. Tschritter; C. Thamer; K. Kantartzis, PLoS One, 2007, 2. e832. [23] TJ.Nicolson; EA. Bellomo; N. Wijesekara; MK. Loder; JM. Baldwin; AV. Gyulkhandanyan, Diabetes, 2009, 58, 2070-83.
[24] S. Cauchi; S. Del Guerra; H. Choquet ; V. D’Aleo; CJ. Groves; R. Lupi, Mol Genet Metab, 2010, 100(1), 77–82.