The Development of a Rapid Diagnostic System for Difficult to
Culture Human Pathogens
By
Balkis A Talip, B.Sc.(Hons), M.Sc.
In partial fulfilment of the requirements of the degree of Doctor of
Philosophy
May 2013
School of Biomedical Sciences
Faculty of Life and Health Sciences
University of Ulster
v
LIST OF TABLES
Table Page
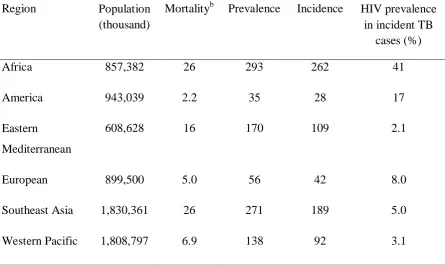
1.1 An average estimation of the burden of disease caused by tuberculosis in 2011 reported by WHO. This summary has been
adapted from Global Tuberculosis Report 2012
(www.who.int/tb/publications/global_report/) and represents the rate per 100,000 populationsa (Dias et al. 2012).
6
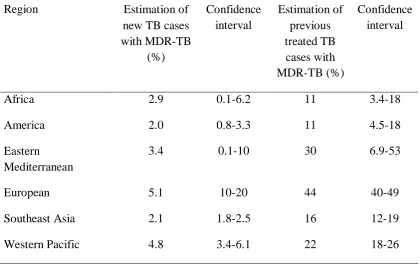
1.2 An estimation of MDR-TB cases reported in 2011 from WHO regions. This data was adapted from the Global Tuberculosis Report 2012 (www.who.int/tb/publications/global_report/). Direct measurements are still in progress therefore, the data supplied is estimation from the actual incidence (Dias et al. 2012).
9
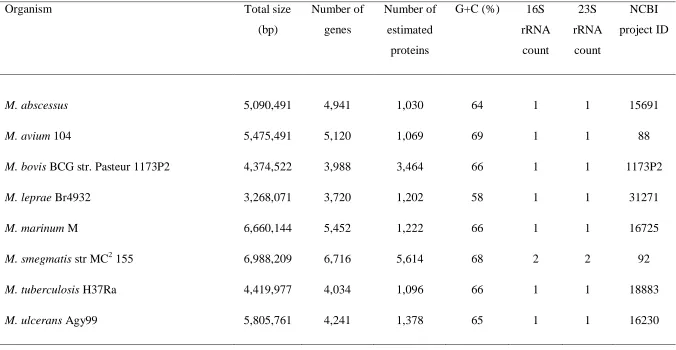
1.3 List of selected Mycobacterium spp. showing variation in size and genome composition from species to species. This data was analysed and summarized from Genome Atlas Database (http://www.cbs.dtu.dk/services/GenomeAtlas).
14
1.4 Most frequent human diseases caused by common RGM group/species.
21
1.5 Commercially available NAA assays for the detection of
Mycobacterium spp. from clinical specimens.
34
3.1 List of primers used in this study for detection of M. smegmatis
(NCIMB8548), environmental isolates VS/02 and genomic DNA from M. tuberculosis (ATCC®25177).
99
3.2 The purity and concentration of DNA extracted from archived slides by using the scraping techniques.
117
3.3 The DNA amplification correlates with fixation, staining and DNA extraction methods by using nested PCR.
122
3.4 Average of Cq value of samples detected using nested real-time
PCR from primary amplicons of enumerated M. smegmatis cells catapulted from archived glass slides. The Cq values correlate with
the numbers of cells successfully catapulted and primarily amplified using touchdown PCR.
vi
LIST OF TABLES
Table Page
3.5 The concentration and purity of DNA extracted using different methods and subjected to a pre-amplification step using MDA REPLI-g® UltraFast Mini kit.
151
3.6 Comparison of the sensitivity for detection of rpoB gene from M. smegmatis cells, isolated from archived glass slides, using nested touchdown and nested real-time PCR detectionassay.
155
4.1 List of primers used in this study for detection of M. smegmatis
(NCIMB8548) for RNA based work.
184
4.2 The concentration and purity of RNA extracted from two isolates of
M. smegmatis and determined using the NanoDrop 2000 spectrophotometer.
194
4.3 The concentration and purity of RNA extraction using combined methods of Lysing matrix-A step, GeneJet kit, gDNA eliminator spin column (RNAeasy Plus Mini kit) and “on-column” DNase treatment from M. smegmatis (NCIMB 8548), fixed on glass slides and quantified using the NanoDrop 2000 spectrophotometer.
196
4.4 The Cq values of primary amplicons detected using 16S rRNA gene
specific primers for nested real-time PCR. The Cq values correlate
with the RNA extracted from M. smegmatis fixed on glass slides by different types of slide processing, isolated and primarily amplified using PCR.
201
4.5 The Cq values of the primary amplicons detected using rpoB gene
specific primers for nested real-time PCR. The Cq values correlate
with the RNA extracted from M. smegmatis fixed on glass slides by different type of slides processing isolated and primarily amplified using PCR.
206
4.6 The Cq values of cDNA amplification using a 16S
rRNA-sequence-specific probe. The Cq values correlate with the RNA extracted
from M. smegmatis fixed on glass slides, by different types of slide processing, isolated and primarily amplified using PCR.
vii
LIST OF FIGURES
Figure Page
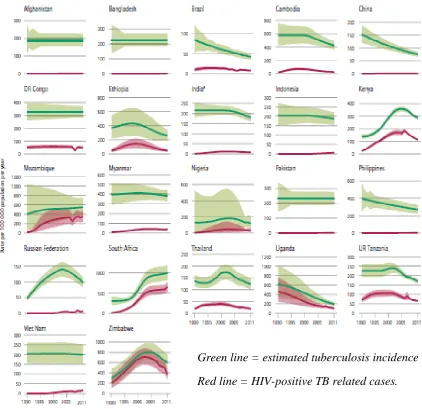
1.1 The incident rate of tuberculosis, reported from 1990 to 2011, from 22 classified high burden countries (HBCs) within the WHO region (Dias et al. 2012). These figures indicate that the tuberculosis incidence has been falling since the peak recorded in mid-1990s among 22 HBCs. This was for most countries except for several regions of Africa as shown from the graph pattern.
7
1.2 An estimated number of tuberculosis and death (in millions) reported between 1990 to 2011 globally (Dias et al. 2012). The falling rates of tuberculosis cases are shown globally from mid-2000. Despite the number of tuberculosis incidence cases increasing, death rates have been reportedly declining every year.
8
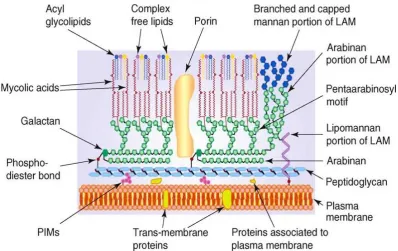
1.3 Schematic diagram of Mycobacterium showing the main components of the outer and inner layer of cell walls. The presence of mycolic acid in the complex of covalent-linked MA-AG-PG is a unique character for identification of the genus Mycobacterium and plays an important role as a permeability barrier (Medjahed, Gaillard & Reyrat 2010).
13
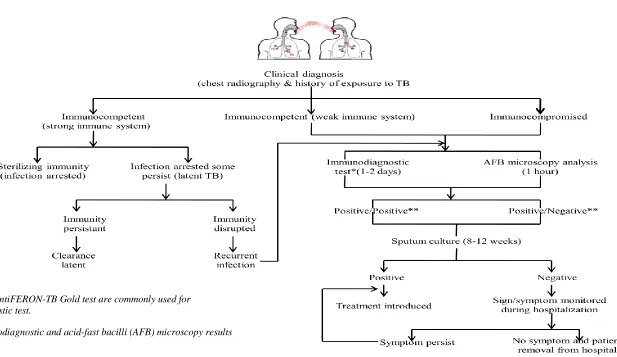
1.4 The flow-chart shows natural cause progression of tuberculosis and general plan-of-detection in immunocompetent and immunocompromised individual following exposure to tubercle bacilli by inhalation.
17
2.1 (a - b) The morphology of M. smegmatis observed on Nutrient agar plates after 48 hours incubation at 37oC. (a) The small colonies with a white to yellow colour were observed on the Nutrient agar plate; (b) Negative control of sterile Nutrient agar in which no colonies had grown.
51
2.2 (a - d) The M. smegmatis observed in broth growth media. Changes of broth turbidity were compared with the non-inoculated broth media (-ve control) incubated for 24 and 48 hours at 37oC. Pellicle and sediment were observed in both broth media inoculated by colonies and culture suspension respectively after 24 hours incubation. The sedimentation was obvious in the BHI broth after 48 hours. (a) The M. smegmatis grown in Nutrient broth observed after 24 hours; (b) The M. smegmatis grown in Nutrient broth observed after 48 hours; (c) The M. smegmatis grown in BHI broth observed after 24 hours; (d) The M. smegmatis grown in BHI broth observed after 48 hours.
viii
LIST OF FIGURES
Figure Page
2.3 (a - b) The M. smegmatis cells incubated for 48 hours, observed under the LCM at 63× magnification. (a) The red coloured of
M. smegmatis cells stained by using standard Ziehl-Neelsen procedures; (b) The colourless and the very light-red coloured
M. smegmatis cells stained by using 37oC carbol-fucshin dye solution.
55
2.4 Growth curve of M. smegmatis in Nutrient and BHI broth measured by optical density (OD600) versus incubation time
(hour). The doubling time is shown by the dashed arrow for both growth media. The t1 was 24 hours post-inoculation and
t2 was the end of exponential growth.
57
2.5 (a – b) Ziehl-Neelsen stained slides of M. smegmatis isolating process. This uses a scraping technique and showed that the largest amount of cells were recovered from the slides observed under LCM at 63× magnification. (a) Smear before isolation; (b) Smear after isolation by using the scraping method.
59
2.6 (a – b) LPC application of LCM performed on the un-smeared PALM® PEN-membrane slide which ensures the efficiency of LPC or the laser-cutting (microdissection) application. (a) Prior to laser pulse being applied; (b) LPC application applied shown by black arrows indicating the laser function.
62
2.7 (a – b) The M. smegmatis smear was mounted and stained by using the Ziehl-Neelsen standard method on a PALM® PEN-membrane slide which was observed and isolated at 63× magnification. (a) M. smegmatis cells before LPC; (b) M. smegmatis cells after LPC.
63
2.8 (a - b) Isolation of M. smegmatis cells from a thick smear Ziehl-Neelsen stained slide observed and isolated at 63× magnification. (a) Thick smear Ziehl-Neelsen slides before any laser pulses have been applied; (b) The laser-cutting or microdissection application was used on the smear and showed a slightly clear zone indicated by the black arrow. The LPC application is shown by white arrow.
ix
LIST OF FIGURES
Figure Page
2.9 (a - c) Isolation of M. smegmatis cells fixed and stained by Ziehl-Neelsen standard protocols. The cells were observed and isolated from the glass slides by using LPC application at 63× magnification. (a) M. smegmatis cells before catapulting; (b) The clear zone has shown the cells were catapulted by LPC; (c) The PCMs collected in the ddH2O was re-examined at 63
× magnification with no re-staining.
67
2.10 (a - c) M. smegmatis cells stained by Ziehl-Neelsen observed and isolated from glass slides using the 63× magnification of LCM. (a) Ziehl-Neelsen stained slides before catapulting; (b) The selected area was catapulted by using LPC application; (c) PCMs collected in the PTA was re-examined to ensure cells were successfully collected.
72
2.11 (a - c) The PCMs of individual M. smegmatis cells observed under TEM and catapulted into 1% PTA from archived glass slides. (a) Several catapulted individual cells; (b) Several different shapes of post-catapulted cells; (c) An intact single cell successfully catapulted and isolated using LPC.
74
2.12 (a - b) A M. smegmatis cell grown and isolated from the Nutrient broth (48 hours, 37oC). This was used to compare the shape and dimension with the PCMs isolated by LCM. (d) Several
M. smegmatis cells with slight different dimensions; (e) a single cell of M. smegmatis.
76
2.13 (a - b) LPC application for isolating Gram-negative bacteria P. aeruginosa PAO1 fixed and stained by Gram-staining on glass slides at 63× magnification. (a) P. aeruginosa PAO1 stained smear before catapulting; (b) The catapulting action has removed the top layer of the smear displaying different colour intensity at the catapulting zone compared to (a).
79
2.14 (a - b) Gram-stained slides of mixed bacteria cultures (P. aeruginosa
PAO1 and M. smegmatis). These showed that the LPC application is able to isolate different type of bacterial cells. (a) The mixed-cultures of bacteria before catapulting; (b) The mixed-culture of bacteria after catapulting. LPC was used to isolate cells of interest selectively.
x
LIST OF FIGURES
Figure Page
3.1 (a - c) The agarose gel electrophoresis (1.5%) shows the amplification of DNA extracted from M. smegmatis
(NCIMB8548), environmental isolate (VS/02) and genomic DNA from M. tuberculosis (ATCC® 25177). (a) Primary PCR using primers BMS738aF and 1311R amplified a 599 bp product; (b) Nested PCR using primers BnMS1100bf and 1184br amplified 103 bp product; (c) Nested PCR using primer BnMS949bf and 1105br which amplified a 179 bp product. Lanes 1 and 6: 100 bp ladder, lane 2: M. smegmatis
(NCIMB8548), lane 3: environmental isolate (VS/02), lane 4: genomic DNA M. tuberculosis and lane 5: negative control.
109
3.1 (d - e) The agarose gel electrophoresis (1.5%) shows the amplification of DNA extracted from M. smegmatis
(NCIMB8548), environmental isolate (VS/02) and genomic DNA from M. tuberculosis (ATCC® 25177). (d) Primary PCR using primers MS-rpoB-F2 and R2 which amplify a 450 bp product; (e) Nested PCR using primers MS(in-9) rpoB-F and R which amplify a 148 bp product. Lanes 1 and 6:100 bp ladder, lane 2: M. smegmatis (NCIMB8548), lane 3: environmental isolate (VS/02), lane 4: genomic DNA from M. tuberculosis (ATCC® 25177) and lane 5: negative control.
111
3.1 (f - g) The agarose gel electrophoresis (1.5%) shows the amplification of DNA extracted from M. smegmatis
(NCIMB8548), environmental isolate (VS/02) and genomic DNA from M. tuberculosis (ATCC® 25177). (f) Primary PCR using primers MycoF and R which amplify a 764 bp product; (g) Nested PCR by using primers Myco-F7-in and R7-in which amplify a 271 bp product. Lanes 1 and 6:100 bp ladder, lane 2: M. smegmatis (NCIMB 8548), lane 3: environmental isolate (VS/02), lane 4: genomic DNA from M. tuberculosis
(ATCC® 25177) and lane 5: negative control.
112
3.2 Correlation of DNA concentration of unstained slides with extraction and fixation methods.
116
3.3 Correlation of DNA concentration with staining and extraction methods from air-dried slides.
120
3.4 Correlation of DNA concentration with staining and extraction methods from heat-fixed slides.
xi
LIST OF FIGURES
Figure Page
3.5 (a - e) Agarose gel electrophoresis showing an approximate 176 bp nested PCR product amplified with primers BnMS949bf and 1105br. DNA was extracted by using different extraction method. (a) DNA extracted from Ziehl-Neelsen (hot stain) stained slides; (b) DNA extracted from Ziehl-Neelsen (37oC stain) stained slides; (c) DNA extracted from Mycobacteria
fluorescent stain kit stained slides; (d) DNA extracted from Gram-stained slides; (e) DNA extracted from unstained slides. The 100 bp ladder showed in lanes 1 and 12. Lanes 2 to 5 showing the air-dried samples and 8 to 11 showing the heat-fixed samples. Lanes 2 and 8: heat-shock; lanes 3 and 9: heat-shock followed by ethanol precipitation; lanes 4 and 10: QIAamp® DNA Micro kit; lane 5 and 11: Chelex-100; lane 6: negative control; lane 7: positive control.
124
3.6 (a - b) Dual parameter dot plot (i) and histogram (ii) showing the distribution of FSC and dual-staining uptake of an exponential culture of bacteria. The red and green colour of the dot plot indicated TO (0.5 µg/ml) and PI (1.3 mg/ml) taken up by cells. The FSC determined the size of cell ranging from 0.5 to 40 µm (a) The total number of M. smegmatis cells - 489,420 enumerated from 15 µl culture; (b) The total number of P. aeruginosa PAO1 cells - 438,525 enumerated from 15 µl cultures. The histogram (ii) indicated that all cells were determined and there was no interference from background noise.
127
3.7 (a - b) The observation of post-enumerated bacteria cell cultures under the fluorescence microscope, 40× magnification using blue light for excitation. Results indicate that targeted bacteria cells were stained using TO (0.5 µg/ml) and PI (1.3 mg/ml). The green and red staining represents live and dead cells respectively. (a) Population of M. smegmatis cells showing live and dead cells; (b) Population of P. aeruginosa PAO1 cellsshowinglive and dead cells.
128
3.8 (a - b) This figure shows that it is possible to enumerate pre-stained cells recovered from glass slides using FCM. The cells were isolated using LCM and were stained with TO (0.5 µg/ml) and PI (1.3 mg/ml). The incubation time was 40 minutes at room temperature to allow for the dyes absorption into the cell wall before employing the FCM. (a) A dot plot (i) analysis demonstrates the uptake of FCM staining dyes by PCMs. The histogram (ii) analysis indicates various sizes of samples for enumeration; (b) P. aeruginosa PAO1 catapulted cells from Gram-stained glass slides.
xii
LIST OF FIGURES
Figure Page
3.9 (a – c) Observations of post-enumerated samples under the fluorescence microscope, 40 × magnifications, using blue light for excitation. The results indicate the prolonged incubation time has increased the pre-stained PCMs cells permeability to absorb the dyes showed by arrow. (a) M. smegmatis; (b) P. aeruginosa PAO1; (c) The background with the unclear staining indicates that, several cells could not allow the dye absorption resulting in dye diffusion.
132
3.10 (a – f) A 10-fold serial dilution of catapulted M. smegmatis cells stained using TO (0.5 µg/ml) and PI (1.3 mg/ml) which are subjected to FCM for enumeration. The dot plot analysis (i) shows that the cells were enumerated according to the dilution factor. The total number of cells per µl is reduced for each counting. The dual-parameter histogram (SSC versus FSC) shows uniformity of a bell-shape peak and indicates the subjected PCMs were enumerated without background interference (a) 10-1 (b) 10-2 (c) 10-3 (d) 10-4 (e) 10-5 (f) 10-6.
135
3.11 (a - e) A set of catapulted Ziehl-Neelsen stained M. smegmatis cells isolated from glass slides using LCM. The pre-stained M. smegmatis cells were stained with TO (0.5 µg/ml) and PI (1.3 mg/ml). The incubation time was 40 minutes at room temperature to allow the dye absorption into the M. smegmatis cell wall before employing the FCM. The post-enumerated cells were collected and subjected to DNA extraction to ensure the amplifiable DNA was recovered.
xiii
LIST OF FIGURES
Figure Page
3.12 (a – c) The absolute quantification to evaluate the LOD from assay was performed using amplicons from primary touchdown PCR. The DNA was extracted from fresh cultured M. smegmatis (standard samples). This external standard was performed to detect false negative result and determine primers efficiencies. (a) Nested real-time PCR amplification pattern shows the limit of the carrying capacity for detection and was progressively decreased at 10-4 dilution of template concentration. i: 10 ng/µl; ii: 1 ng/µl; iii: 10-1 ng/µl; iv: 10-2 ng/µl; v: 10-3 ng/µl; vi: 10-4 ng/µl; vii: non-template control (NTC); (b) SYBR Green I melting curve analysis shows that no non-specific product was amplified; (c) Post-quantification analysis shown on 1.5% agarose gel electrophoresis. A 179 bp product was amplified using nested primers (BnMS949bf and 1105br) specifically for the rpoB gene of M. smegmatis. Lanes 1 and 9: 100 bp ladder; lane 2: 10 ng/µl; lane 3: 1 ng/µl; lane 4: 10-1 ng/µl; lane 5: 10-2 ng/µl; lane 6 10-3 ng/µl; lane 7: 10-4 ng/µl; lane 8: non-template control (NTC).
142
3.13 (a - c) Detection of M. smegmatis cells from archived glass slides using real-time LightCycler nested PCR. This produced 176 bp rpoB gene-specific product. (a) Nested real-time PCR detects approximately 200 enumerated of M. smegmatis cells catapulted from glass slides by LCM. The DNA templates were amplified by using touchdown PCR. The Cq relates to
the amount of template originated from the number of catapulted cells; (i) 3182 cells (ii) 1578 cells (iii) 795 cells (iv) 397 cells (v) positive control (vi) 198 (vii) negative control (NTC); (b) A single peak of Tm Calling analysis
showed that a specific product could be amplified with no inhibitory effect; (c) Agarose gel (1.5%, 4oC) showing a 176 bp nested PCR product amplified with primers BnMS949bf and 1105br. DNA sequencing of amplified materials confirmed the amplified product to be the rpoB gene of M. smegmatis. Lanes 1 and 9: 100 bp ladder, lane 2: 3,182 cells, lane 3: 1,578, lane 4: 795, lane 5: 397, lane 6: 198, lane 7: positive control, lane 8: negative control.
xiv
LIST OF FIGURES
Figure Page
3.14 (a - b) A agarose gel electrophoresis (1.5%, 4oC) showing the MDA using REPLI-g® UltraFast Mini kit of catapulted M. smegmatis cells, isolated from archived glass slides using LCM. Samples were extracted using different methods to determine the most appropriate DNA extraction method for low number of catapulted cells. (a) Undiluted post-MDA reaction; (b) 1:25 dilution of post-MDA reaction. Lanes 1 and 6: 100 bp ladder; lane 2: heat-shock; lane 3: heat-shock followed by ethanol precipitation; lane 4: QIAamp® DNA Micro kit; lane 5: positive control; lane 6: negative control
152
3.15 (a - b) A primary touchdown PCR of post-MDA reaction showed no visible product on agarose gel electrophoresis (1.5%, 4oC). (a) Amplification was performed using an undiluted post-MDA reaction; (b) Amplification was performed using the 1:25 dilution of post-MDA reaction. Lanes 1 and 7: 100 bp ladder; lane 2: heat-shock; lane 3: heat-shock followed by ethanol precipitation; lane 4: QIAamp® DNA Micro kit; lane 5: positive control; lane 6: negative control.
153
3.16 (a - b) A nested touchdown PCR of post-MDA reaction showing non-visible or a low intensity 176 bp product on agarose gel electrophoresis (1.5%, 4oC). (a) The primary PCR was performed using an undiluted post-MDA reaction in which no amplification product was observed; (b) The primary PCR was performed using a 1:25 dilution of post-MDA reaction showing low intensity of amplification at lanes 2 and 3. Lanes 1 and 7: 100 bp ladder; lane 2: heat-shock; lane 3: heat-shock followed by ethanol precipitation; lane 4: QIAamp® DNA Micro kit; lane 5: positive control; lane 6: negative control.
xv
LIST OF FIGURES
Figure Page
3.17 (a - c) Nested real-time PCR using primers BnMS949bf and 1105br for the detection of 30 M. smegmatis cells isolated from glass slides. The post-MDA reaction was primarily amplified by touchdown PCR using an undiluted post-MDA reaction amplicons. The undiluted primary amplicon was used as a template for the nested real-time PCR detection system. The analysis was carried out based on different DNA extraction methods; i: heat-shock; ii: heat-shock followed by ethanol precipitation; iii: QIAamp® DNA micro kit. (a) The Cq pattern
of amplification showed the detection of samples at different Cq values. A dilution (10-6) of the positive control was used to
increase the efficiency of detection; (b) Tm Calling analysis
showed two melting peaks generated from the melting curve after amplification. The products were then analysed using agarose gel electrophoresis; (c) Agarose gel electrophoresis (1.5%, 4oC) shows the 176 bp nested real-time product. Lanes 1 and 7: 100 bp ladder; lane 2: heat-shock; lane 3: heat-shock followed by ethanol precipitation; lane 4: QIAamp® DNA Micro kit; lane 5: positive control; lane 6: negative control.
157
3.18 (a - c) Nested real-time PCR using primers BnMS949bf and 1105br for the detection of 30 M. smegmatis cells isolated from glass slides. A template from the post-MDA reaction, primarily amplified using touchdown PCR was used. The primary amplification was performed using the 1:25 dilution of post-MDA reaction and an undiluted amplicon was used for nested real-time PCR detection system. The analysis was carried out based on different DNA extraction methods; i: heat-shock; ii: heat-shock followed by ethanol precipitation; iii: QIAamp® DNA micro kit. (a) The Cq pattern of amplification showed
the detection of samples at different Cq value. The diluted (10 -6
) positive control was used to increase the efficiency of detection; (b) A single peak of Tm Calling analysis indicates
that the product was specifically amplified. The products were further analysed using agarose gel electrophoresis; (c) Agarose gel electrophoresis (1.5%, 4oC) shows the 176 bp nested real-time PCR amplification product. Lanes 1 and 7: 100 bp ladder; lane 2: heat-shock; lane 3: heat-shock followed by ethanol precipitation; lane 4: QIAamp® DNA Micro kit; lane 5: positive control; lane 6: negative control.
xvi
LIST OF FIGURES
Figure Page
3.19 The Cq pattern comparison analysis of nested real-time PCR
post-detection by using Cq values obtained from amplification
of undiluted and diluted (1:25) post-MDA reaction amplicons.
161
4.1 The agarose gel electrophoresis (1.0%, 4oC) shows the 23S and 16S rRNA extracted from total RNA of M. smegmatis
(NCIMB8548) and environmental isolates (VS/02) cultures using three kinds of extraction method. The amplicon brightness and the smears shown on the gel are associated with the RNA extraction method used and the RNA degradation due to the presence of chromosomal DNA (ChDNA). Lane 1: 1 kb ladder, lanes 2 and 3: NCIMB8548 and VS/02 extracted using GeneJET RNA purification kit, lanes 4 and 5: NCIMB8548 and VS/02 extracted using combined methods of Lysing matrix-A, gDNA eliminator spin column (RNeasy Plus Mini kit) and GeneJET RNA purification kit, lanes 6 and 7: NCIMB8548 and VS/02 extracted using combination methods of Lysing matrix-A, gDNA eliminator spin column (RNeasy Plus Mini kit), GeneJET RNA purification kit and “on-column” DNase treatment.
193
4.2 The agarose gel electrophoresis (1.0%, 4oC) showing the 23S and 16S rRNA extracted from total RNA of M. smegmatis
(NCIMB8548) isolated from glass slides using combined methods of Lysing matrix-A, gDNA eliminator spin column (RNeasy Plus Mini kit), GeneJET RNA purification kit and “on-column” DNase treatment. The low amplicon brightness shown on the gel could be due to the RNA degradation. Lane 1: 1 kb ladder, lane 2: Ziehl-Neelsen stained slide sample, lane 3: frozen-Ziehl-Neelsen stained slide sample, lane 4: unstained slide sample.
xvii
LIST OF FIGURES
Figure Page
4.3 (a – c) Nested real-time PCR of M. smegmatis (NCIMB8548) cells isolated from glass slides using 16S rRNA gene-specific primers. (a) The Cq of primary amplicons observed at cycle
25; (i) Ziehl-Neelsen stained slide sample (ii) frozen-Ziehl-Neelsen stained slide sample (iii) unstained slide sample (iv) positive control (v) negative contol (NTC); (b) Tm Calling
analysis showing a single narrow peak of amplification product. The stable DNA amplification is shown by melting curve analysis with no by-product generated during the process; (c) Agarose gel (1.5%, 4oC) showing 166 bp nested real-time PCR amplified product. Lanes 1 and 7: 100 bp ladder, lane 2: Ziehl-Neelsen stained slide sample, lane 3: frozen-Ziehl-Neelsen stained slide samples, lane 4: unstained slide samples, lane 5: positive control, lane 6: negative control (NTC).
199
4.4 (a – c) Nested real-time PCR of M. smegmatis (NCIMB 8548) cells isolated from glass slides using rpoB gene-specific primers. (a) The Cq of primary amplicons observed at cycle 30; (i)
Ziehl-Neelsen stained slide sample (ii) frozen-Ziehl-Neelsen stained slide sample (iii) unstained slide samples (iv) positive control (v) negative contol (NTC); (b) Tm Calling analysis
showing an additional weak, broad peak with Tm of 77oC
which arose from a non-specific by product from the unstained sample labelled iii (red line). (c) Agarose gel (1.5%, 4oC) showing a 176 bp nested real-time PCR product amplified. Lanes 1 and 7: 100 bp ladder, lane 2: Ziehl-Neelsen stained slide sample, lane 3: frozen-Ziehl-Ziehl-Neelsen stained slide sample, lane 4: unstained slide sample, lane 5: positive control, lane 6: negative control (NTC).
204
4.5 (a – b) Amplification of cDNA of M. smegmatis (NCIMB 8548) cells isolated from glass slides using a 16S rRNA-sequence-specific probe. (a) The Cq has shown the cDNA was amplified
from all samples and the first detection was visible at Cq >20;
(i) Ziehl-Neelsen stained slide sample (ii) frozen-Ziehl-Neelsen stained slide sample (iii) unstained slide sample (iv) positive control (v) negative contol (NTC); (b) Agarose gel (1.5%) showing the amplified 67 bp nested real-time PCR product. Lanes 1 and 7: 50 bp DNA ladder, lane 2: Ziehl-Neelsen stained slide sample, lane 3: frozen-Ziehl-Ziehl-Neelsen stained slide sample, lane 4: unstained slide sample, lane 5: positive control, lane 6: negative control (NTC).
209
5.1 Flow-chart of conventional detection system for MTBC versus system model developed in this study.
xviii
ABSTRACT
The World Health Organization (WHO) has outlined a TB-free World
strategy that aims to reduce tuberculosis prevalence by 2015. That could be achieved
through the development of a specific and rapid detection system. In countries with a
high incidence of tuberculosis, detection is solely based on sputum smear
microscopy using Ziehl-Neelsen stain and chest radiography. This is followed by
cultivation, which requires up to 12 weeks for confirmation. The diagnostic test
available is insensitive, laborious, lacks specificity and does not even give
unequivocal proof of infection. Consequently, this study was conducted to obtain
confirmatory diagnostic information from Ziehl-Neelsen stained smears on glass
slides. The fast-grower, non-pathogenic Mycobacterium smegmatis was used as the
model organism due to similarity to the pathogenic strain, Mycobacterium
tuberculosis. Laser capture microscopy (LCM) is primarily used as a microdissection
tool in studies involving tissues and membranes. This technology was able to isolate
intact individual cells fixed on archived glass slides regardless of how the smears
and staining have been performed, confirmed by transmission electron microscopy
(TEM) observation. Typically between 100 – 1,000 catapulted cells are enumerated
using flow cytometry (FCM). A series of DNA extraction techniques which are
heat-shock, heat-shock followed by ethanol precipitation and QIAamp® DNA Micro kit
were compared and optimized for the lowest number of post-catapult cells. To
maintain the detection of lowest number of catapulted cells, the rpoB-gene specific
primers were designed for amplification using nested real-time PCR. Routinely, this
system was able to detect as few as 30 catapulted cells per assay. This result
demonstrated that it is possible to isolate the bacteria from glass slides and
xix inhibitory factors. In conclusion, we strongly recommend that this system may offer
improved specificity and speed of tuberculosis detection with lower risk of exposure
xx
ABBREVIATIONS
AIDS Acquired Immunodeficiency Syndrome
BLAST Basic Local Alignment Search Tool
bp Base Pairs
CDC Centres for Diseases Control and Prevention
cDNA copy DNA/complementary DNA
Cq Quantification cycle
DNA Deoxyribonucleic acid
dNTP Deoxyribonucleoside Triphosphate
FCM Flow cytometry
G gram(s)
HIV Human immunodeficiency virus
L litre(s)
LCM Laser Capture Microscope/Laser Capture Microscopy
MDA Multiple displacement amplification
mg milligram(s)
ml millilitre(s)
mm millimetre(s)
mM millimolar
mRNA messenger RNA
µg microgram(s)
µl microlitre(s)
µm micrometer(s)
NAA Nucleic Acid Amplification Assay
NCBI National Center for Biotechnology Information
ng nanogram(n)
PBS phosphate buffered saline
xxi
PI Propidium Iodide
PCM Post-catapult material(s)
PMIT Photomultiplier tubes
RNA Ribonucleic Acid
rRNA Ribosomal RNA
rpoB gene that encodes β-subunit of bacterial RNA polymerase
RT-PCR Reverse Transcription PCR
ddH2O double distilled water
sp./spp. species
Taq Thermus aquaticus
TBE tris-borate-EDTA
TE Tris-EDTA
TO Thiazole orange
tRNA total RNA
U unit
xxii
TABLE OF CONTENTS
ACKNOWLEDGEMENT iii
DECLARATION iv
LIST OF TABLES v
LIST OF FIGURES vii
ABSTRACT xviii
ABBREVIATIONS xx
Chapter Page
1 General introduction. 1
1.1 An overview of the global tuberculosis (TB) incidence. 2
1.2 Description of the genus Mycobacterium. 10
1.3 Epidemiology and transmission. 15
1.4 Clinical significance. 18
1.4.1 Slowly-growing mycobacteria (SGM). 18
1.4.2 Rapidly-growing mycobacteria (RGM). 19
1.5 A standard diagnosis of M. tuberculosis from clinical specimens. 24 1.6 A variety of modern diagnostic methods for detection and
identification mycobacterial infections.
25
1.6.1 Biological and biochemical methods. 25
1.6.1.1 Microscopy techniques. 25
1.6.1.2 Culture techniques. 27
1.6.2 Immunodiagnostic test for tuberculosis. 28
1.6.3 Nucleic acid amplification (NAA) assays. 29
1.7 Aim and objectives. 37
2 The potential of laser capture microscopy as an isolation tool for isolating bacterial cell from slides.
38
2.1 Introduction. 39
2.2 Aim and objectives. 42
2.3 Materials and methods. 43
2.3.1 Bacterial strains. 43
2.3.1.1 Mycobacterium smegmatis (M. smegmatis). 43 2.3.1.2 Pseudomonas aeruginosa PAO1. 43
2.3.2 Smear preparation. 43
2.3.3 Acid fast staining (Ziehl-Neelsen). 44
2.3.4 Gram-staining. 44
2.3.5 Slides scraping. 45
2.3.6 Laser capture microscopy (LCM). 45
2.3.7 Transmission Electron Microscopy (TEM). 46
2.3.7.1 Sample preparation for TEM from fresh culture.
46
2.3.7.2 Sample preparation from post-catapult materials (PCMs).
xxiii
2.3.8 Growth curve of Mycobacterium smegmatis. 47
2.4 Results 49
2.4.1 M. smegmatis: observation from the growth media.
49
2.4.2 Cell morphology of M. smegmatis observed under LCM.
54
2.4.3 A growth curve study of M. smegmatis in Nutrient and brain heart infusion (BHI) broth media.
56
2.4.4 Isolating Zieh-Neelsen stained M. smegmatis from slides by using scraping method.
58
2.4.5 An optimization study for isolating bacterial cells fixed on glass slides.
60
2.4.5.1 Isolation of M. smegmatis cells fixed on the PALM® PEN-membrane slide.
60
2.4.5.2 Isolation of M. smegmatis cells fixed on normal glass slides.
64
2.4.6 TEM showing that intact M. smegmatis cells are recovered from glass slides following LCM treatment.
69
2.4.7 Optimization of the LCM for isolation of other bacteria fixed on glass slides.
77
2.5 Discussion. 81
3 The development of molecular detection system for bacterial cells isolated from glass slides by laser capture microscopy technique.
87
3.1 Introduction. 88
3.2 Aim and objectives. 93
3.3 Materials and methods. 94
3.3.1 Bacterial strains and cultivation conditions. 94 3.3.1.1 Mycobacterium smegmatis (M. smegmatis). 94 3.3.1.2 Pseudomonas aeruginosa PAO1. 94
3.3.1.3 Control DNA. 94
3.3.2 Stain inhibition study. 94
3.3.2.1 Slide preparation. 95
3.3.2.2 Acid fast staining (Ziehl-Neelsen) 95
3.3.2.3 Gram-stain. 95
3.3.2.4 Fluorescent stain kit for Mycobacteria (Mycobacteria fluorescent stain kit) (Sigma-Aldrich, UK).
95
3.3.2.5 Isolation of bacterial cells. 95 3.3.2.6 Molecular detection of M. smegmatis cells
scraped from glass slides.
xxiv
3.3.3 DNA extraction. 96
3.3.3.1 DNA extraction using FastDNA® Spin for soil kit.
96
3.3.3.2 Heat shock. 97
3.3.3.3 Heat shock-ethanol precipitation. 97
3.3.3.4 Chelex-100 97
3.3.3.5 QIAamp® DNA Micro kit (Qiagen, USA). 98 3.3.4 Multiple Displacement Amplification (MDA). 98
3.3.5 Primers. 98
3.3.6 Polymerase Chain Reaction (PCR). 102
3.3.6.1 Hot-start PCR. 102
3.3.6.2 Primary PCR. 102
3.3.6.3 Nested PCR. 103
3.3.6.4 Nested touchdown PCR. 103 3.3.6.5 Nested real-time PCR. 103
3.3.7 Pre-washing for inhibitory removal. 104
3.3.8 Agarose gel electrophoresis. 104
3.3.9 Purification of DNA fragments. 105
3.3.10 Sequencing of amplicons. 105
3.3.11 Analysis of nucleotides. 106
3.3.12 Flow cytometric quantification (FCM). 106
3.3.13 Statistical analysis. 107
3.4 Results 108
3.4.1 Primer validation. 108
3.4.2 Stain inhibition study and optimization of DNA extraction methods for M. smegmatis recovered from glass slides.
113
3.4.3 Optimization of FCM for quantification of cells isolated from glass slides.
125
3.4.4 Enumeration of cells isolated from archived glass slides using FCM.
129
3.4.5 The detection sensitivity of post catapulted M. smegmatis cells using a touchdown and real-time nested PCR method.
139
3.4.6 Determination of the minimum number of cells that could be detected by using combinations of MDA- nested PCR assay.
147
3.5 Discussion. 162
4 Investigation of the presence of RNA extracted from Mycobacterium smegmatis isolated from glass slides.
173
4.1 Introduction. 174
xxv
4.3 Materials and methods. 179
4.3.1 Bacterial strains and cultivation conditions. 179 4.3.1.1 Mycobacterium smegmatis (M. smegmatis) 179
4.3.2 Smear preparation. 179
4.3.3 Frozen smear preparation. 179
4.3.4 Modification of acid fast staining (Ziehl-Neelsen) from standard protocols.
179
4.3.5 Isolation of M. smegmatis cells from slides by scraping method.
180
4.3.6 RNA extraction. 180
4.3.6.1 Cell disruption using mechanical and enzymatic procedures.
181
4.3.6.2 RNA purification. 181
4.3.7 DNase treatment. 182
4.3.7.1 On-column DNase treatment. 182 4.3.7.2 DNase treatment of eluted RNA. 182
4.3.8 Primers. 183
4.3.9 cDNA synthesis. 186
4.3.10 Primary polymerase chain reaction (primary PCR). 186
4.3.11 Nested PCR. 187
4.3.12 Real-time PCR. 187
4.3.12.1 Nested real-time PCR. 187
4.3.12.2 Real-time PCR using a pre-designed probe. 188
4.3.13 Pre-washing for inhibitory removal. 188
4.3.14 Agarose gel electrophoresis. 188
4.3.15 Confirmation of amplified DNA. 189
4.4 Results. 190
4.4.1 Optimization of total RNA extraction methods for M. smegmatis cells isolated from glass slides.
190
4.4.2 Optimization of RT-PCR and RT-nested real-time PCR for the detection of RNA using 16S rRNA gene specific primers.
197
4.4.3 Primary and nested real-time PCR to detect RNA Using rpoB gene-specific primers.
202
4.4.4 16S rRNA-sequence-specific probe binding assays for the detection of RNA extracted from M. smegmatis cells, isolated from glass slides.
207
4.5 Discussion 212
5 General discussion. 219
xxvi
Appendix (A - D) 230
Chapter 1
2
1.1 An overview of the global tuberculosis (TB) incidence.
Tuberculosis is a major health problem caused by Mycobacterium
tuberculosis complex (MTBC) with many new cases reported each year which claim
almost 2 million deaths (Dagnew et al. 2012, Dias et al. 2012). Many countries are
affected by tuberculosis (Table 1.1). In 2011, 85% of cases were reported from
Africa and Asia with the major prevalence, 59%, contributed from India and China
alone. Meanwhile, a small proportion of tuberculosis incidence reported was by the
Americas (3%), the European region (4.3%), Eastern Mediterranean (7.7%) and
Western Pacific (21% (reported in 2010) (Dias et al. 2012, Small 2012).
Tuberculosis is ranked as the eighth leading cause of death in low- and middle
income countries. However, it becomes the third biggest killer after HIV/AIDS and
ischemic heart disease among adult populations (age 15 to 59) (Lessells et al. 2011,
Noens et al. 2011, Balakrishnan et al. 2012). M. tuberculosis infection is transmitted
by the inhalation of infected aerosol droplets generated by people with pulmonary
disease, through coughing. Transmission by other methods has not been reported.
Although tuberculosis is curable, the available treatment regimes slow the
infection rate but do not eliminate this infection from the population. This is
indicated when reported tuberculosis cases continued to increase every year even
though the number per 100,000 population decreased by 1% (Dias et al. 2012,
Fitzpatrick et al. 2012). Treatment, using first-line drugs to treat M. tuberculosis
among susceptible patients, does have an effect within 6 months. For the
non-susceptible patient, second-line drug treatments are introduced which are used to
treat multidrug-resistant tuberculosis (MDR-TB) strains (Ahmad 2011). Despite the
3 the high cost and side effects of their use result in cases of MDR-TB not being
eradicated.
Tuberculosis cases also relate to the spread of HIV/AIDS. In the 22
high-burden countries (HBCs) classified by WHO (accounting for 80% of tuberculosis
cases) showed the tuberculosis cases reported from 1990 to 2011 are mostly
contributed from the HIV-positive patient (Figure 1.1) (Dias et al. 2012, Fitzpatrick
et al. 2012). According to WHO, one in four deaths from tuberculosis is HIV related.
The diagnoses of HIV-positive patients are more difficult to treat as opposed to
non-HIV-positive patients. In 2007, almost 1.37 million new tuberculosis cases were
reported among HIV infected people alone. In addition, due to the low curable rate
of people living with HIV, the mortality rate increased among these cases. The
highest number of HIV-related tuberculosis cases peaked in Africa during the 1980s
and steadily increased to 2004 (Blanc et al. 2009). The extensive treatment and
monitoring then slowed the epidemic. Although new tuberculosis cases had
reportedly decreased among the WHO region, the absolute numbers of cases
increased along with the growth of population.
From 2009 to 2011, the majority of tuberculosis incidence and deaths were
reported from less-developed regions of world countries with the highest death rates
recovered from the poorest region of Africa, India, China and Southeast Asia
(approximately 20 to 40 per 100,000 population) (Small 2012, Fitzgerald, Sterling &
Haas 2010). This may be due to low income countries having limited access to
health-care systems, high exposure to unhealthy dwelling, poor-nutrition, HIV
infection, diabetes mellitus, and unhealthy life styles like smoking and drug abuse
(El Khechine et al. 2009, Balakrishnan et al. 2012). Dating from 1990, the
4 known as high tuberculosis burden areas where reported cases increased until 1998
(approximately 20 to 40 rates per 100,000 population). There was a decline of 8.5%
in mortality rate shown from 1998 to 2011 (Dias et al. 2012). This trend has been
related to improvements in political and socio-economic status of former Soviet
Union dependents. Globally, mortality rates of tuberculosis are successfully
decreasing as reported in 2011 among 22-HBCs (Figure 1.2).
The rise of MDR-TB and extensively drug-resistant TB (XDR-TB) cases
have become a major concern of the WHO. This may be due to the determination of
successful current strategic planning to control the spread of disease. There were an
estimated 630,000 cases of MDR-TB among the world’s 12 million tuberculosis
cases reported in 2011. The actual number of cases and incidence trend is currently
under investigation (Dias et al. 2012). Therefore the assessment of data for each
country is still not fully accessible. However, an estimated number of MDR-TB
cases reported, based on region, has been provided by WHO. Data was obtained
from affected countries (Table 1.2). This surveillance data is crucial due to the
chronic effects of MDR-TB infection.
Existing diagnostic methods for MDR-TB are slower and take longer to
perform in comparison to diagnostics for MTBC common infection. Second-line
drug treatment for MDR-TB is expensive due to the long treatment regime required
to ensure effectiveness and prevent recurring infections. Although the death rate
recorded in the WHO region from 1990 to 2011 has decreased, the actual number of
deaths from HIV-related tuberculosis cases still may be greater than recorded. This
may be due to no tuberculosis diagnosis from HIV patients but in such cases death is
often not recorded as deaths due to tuberculosis. Many studies indicated that tackling
5 tuberculosis controls. This involves many different intervention strategies which are
6 Table 1.1: An average estimation of the burden of disease caused by tuberculosis in
2011 reported by WHO. This summary has been adapted from the Global
Tuberculosis Report 2012 (www.who.int/tb/publications/global_report/) and
represents the rate per 100,000 populationa (Dias et al. 2012).
Region Population
(thousand)
Mortalityb Prevalence Incidence HIV prevalence in incident TB
cases (%)
Africa 857,382 26 293 262 41
America 943,039 2.2 35 28 17
Eastern
Mediterranean
608,628 16 170 109 2.1
European 899,500 5.0 56 42 8.0
Southeast Asia 1,830,361 26 271 189 5.0
Western Pacific 1,808,797 6.9 138 92 3.1
Note:
a
= The value is the point categorized as “best” estimation at lower and upper bounds
of the 95% uncertainty interval.
b
= Mortality excludes deaths among HIV-positive tuberculosis cases. Deaths among
HIV-positive tuberculosis cases are classified as HIV deaths according to the
International Classification of Diseases (ICD-10).
7 Figure 1.1: The incident rate of tuberculosis, reported from 1990 to 2011, from 22
classified high burden countries (HBCs) within the WHO region (Dias et al. 2012).
These figures indicate that the tuberculosis incidence has been falling since the peak
recorded in the mid-1990s among 22 HBCs. This was for most countries except for
several regions of Africa as shown from the graph pattern.
Green line = estimated tuberculosis incidence
[image:30.595.120.543.70.479.2]8 Figure 1.2: An estimated number of tuberculosis cases and death (in millions)
reported between 1990 to 2011 globally (Dias et al. 2012). The falling rates of
tuberculosis cases are shown globally from mid-2000. Despite the number of
[image:31.595.119.553.73.314.2]9 Table 1.2: An estimation of MDR-TB cases reported in 2011 from WHO regions.
This data was adapted from the Global Tuberculosis Report 2012
(www.who.int/tb/publications/global_report/). Direct measurements are still in
progress therefore, the data supplied is an estimation of the actual incidence (Dias et
al. 2012).
Region Estimation of
new TB cases with MDR-TB
(%)
Confidence interval
Estimation of previous treated TB
cases with MDR-TB (%)
Confidence interval
Africa 2.9 0.1-6.2 11 3.4-18
America 2.0 0.8-3.3 11 4.5-18
Eastern
Mediterranean
3.4 0.1-10 30 6.9-53
European 5.1 10-20 44 40-49
Southeast Asia 2.1 1.8-2.5 16 12-19
Western Pacific 4.8 3.4-6.1 22 18-26
[image:32.595.110.531.244.509.2]10
1.2 Description of the genus Mycobacterium.
Currently, there are almost 200 mycobacterial species that have been
described by molecular techniques (Pfyffer, Palicova 2011). Mycobacterium is the
only genus in the family of Mycobacteriacea. This aerobic bacterium contains
various morphological shapes based on growth condition. Some species such as
Mycobacterium smegmatis and M. tuberculosis are able to grow in a limited oxygen
environment. It has typical rod-shape or slightly curve with cell dimensions of 0.2 to
0.6 µm by 1 to 10 µm (Pfyffer, Palicova 2011).
This genus cell wall is unique and contains a high proportion of a complex
lipid that prevents access of common aniline dyes. This complex cell wall comprises
an outer and inner compartment. The outer compartment contains protein and lipid.
The lipid-linked polysaccharides (outer cell wall) consist of lipoarabinomannan
(LAM), lipomannan, phthiocerol dimycocerosate, trehasole and phosphatidylinositol
mannoside (Draper 1998, Hett, Rubin 2008). In addition, the sulfolipid is only
present in M. tuberculosis. The outer compartment of the cell wall is soluble and has
a role for interacting with the host immune system. The insoluble inner compartment
of the cell wall consists of peptidoglycan (PG), arabinogalactan (AG) and mycolic
acid (MA). These are linked together by covalent bonds and contribute to the core
component of mycobacteria cell wall (Cole et al. 1998, Draper 1998, Toney et al.
2010).
Mycobacteria are grouped neither as Gram-positive nor Gram-negative
bacteria. They have some unique qualities that are divergent from members of the
Gram-positive group, which is that the cell wall contains mycolic acids. A
11 sheets) with a size range of 20 to 80 nm for each sheet. This is contrary to a
Gram-negative bacterial cell wall which consists of 1 to 10 thin layers (approximately 10
nm thickness of each layer) of PG (Figure 1.3). In contrast, a Mycobacterium cell
wall consists of between 4 to 15 nm thickness of PG associated with teichoic acids,
lipoteichoic acids and MAs which does not significantly show a distinctive layer of
PG (Brennan 2003, Hett, Rubin 2008).
Mycobacteria are commonly described as acid-fast, implying that after
staining they resist decolourization with acidified alcohol and also with strong
mineral acid. The common staining procedure used is Ziehl-Neelsen staining
(Pfyffer, Palicova 2011) which makes the bacteria stain red. The property of
acid-fast, due to the waxy materials in the cell walls is particularly important to
recognizing the Mycobacterium genus and primarily determines the permeability of
cell walls. It is composed of α-alkyl and long β-hydroxyl-fatty acids (60 to 90
carbons for each chain) and is linked to AG. A study by Rao et al. (2005) has shown
that a component of MAs (trans-cyclopropanation) suppresses inflammation caused
by M. tuberculosis infection (Rao et al. 2005, Hett, Rubin 2008).
The Mycobacterium genus is also grouped as high G+C content bacteria with
an average of 61 to 71 mol% G+C for all member species except 57 mol% for M.
leprae. The genome size varies from species to species ranging from 4 to 7 million
base pair (bp) (Table 1.3). Ninety percent (90%) of the genome represents coding
regions that potentially encode for more than 6000 proteins (Cole et al. 1998,
Zakham et al. 2011). Natural division and growth of Mycobacterium species differs
based on slowly-growing to rapidly-growing characteristics. Slowly-growing
Mycobacterium (SGM) requires more than 7 days for visible growth to appear as
12 when grown on Löwenstein-Jensen (L~J) medium. However, the RGM may require
13 Figure 1.3: Schematic diagram of Mycobacterium showing the main components of
the outer and inner layer of cell walls. The presence of mycolic acid in the complex
of covalent-linked MA-AG-PG is a unique character for identification of the genus
Mycobacterium and plays an important role as a permeability barrier (Medjahed,
14 Table 1.3: List of selected Mycobacterium spp. showing variations in size and genome composition from species to species. This data was
analysed and summarized from Genome Atlas Database (http://www.cbs.dtu.dk/services/GenomeAtlas).
Organism Total size
(bp)
Number of genes
Number of estimated
proteins
G+C (%) 16S
rRNA count
23S rRNA
count
NCBI project ID
M. abscessus 5,090,491 4,941 1,030 64 1 1 15691
M. avium 104 5,475,491 5,120 1,069 69 1 1 88
M. bovis BCG str. Pasteur 1173P2 4,374,522 3,988 3,464 66 1 1 1173P2
M. leprae Br4932 3,268,071 3,720 1,202 58 1 1 31271
M. marinum M 6,660,144 5,452 1,222 66 1 1 16725
M. smegmatis str MC2 155 6,988,209 6,716 5,614 68 2 2 92
M. tuberculosis H37Ra 4,419,977 4,034 1,096 66 1 1 18883
[image:37.842.84.760.178.528.2]15
1.3 Epidemiology and transmission.
Members of the Mycobacterium genus are incapable of replicating in
inanimate environments. For the MTBC and M. leprae, replication occurs in tissues
of human and warm-blooded animals. The risk of infection is dependent on the load
of the bacillus that has been inhaled, levels of infectiousness, person-to-person
contacts and the immune level of the potential host. This air-borne pathogen is
transmitted from an active pulmonary tuberculosis patient by expectoration (cough).
The droplet nuclei, approximately 1 to 5 µm in size “meander” in the air and are
transmitted to the susceptible person by inhalation (Figure 1.4).
The primary route of infection is the lungs. Tuberculosis can also infect other
vital organs of human body such as kidney, spine and brain. Due to the relatively
small size of the droplets inhaled into the lungs, the infection penetrates the defence
system of bronchi and enters the terminal alveoli. These are then engulfed by
alveolar macrophage and dendritic cells. The cell-mediated immune response arrests
the multiplication of M. tuberculosis and stops infection. An infected person with a
strong immune system is able to combat the infection within 2 to 8 weeks
post-infection, when the active cell-mediated immune response alleviates multiplication
of M. tuberculosis. However, in some patients, the tubercle bacilli are latently
infected with asymptomatic appearance. This occurs when the tubercle (infected
macrophage or granuloma) is not completely eradicated by the immune system.
Therefore, the tubercles remain in the system for a longer period of time. This type
of infection is called latent tuberculosis.
The latently infected person is non-infectious however the infection can be
detected by tuberculin skin test (TST), and interferon gamma (IFN-γ) release assays
16 (10%), it has been reported that reactivation of latent tuberculosis (active
tuberculosis) may possibly happen after years of post-infection. The risk of
reactivation is greater in HIV infected patients (15%) (Ahmad 2011). Studies have
shown that, the pathogen enables the intracellular replication before responses of the
immune system occurs in the lymph nodes and other extra pulmonary sites. This is
an extraordinary ability that M. tuberculosis has to allow persistence and avoid
eradication by host-immune system (Ahmad 2011, Obregon-Henao et al. 2012).
Unlike M. tuberculosis, non-tuberculous mycobacteria (NTM) are live in
moist habitats such as lakes, rivers and damp-soil. For example, M. avium complex
(MAC), M. genavense, M. kansasii, M. xenopi, M. simiae, M. gordonae and some
RGM have been recovered from tap water (Han, De & Jacobson 2007, Esteban et al.
2008, Stout et al. 2011). Some NTM play important roles in nosocomial disease and
pseudo-outbreaks. A recent study showed that NTM may be isolated from skin,
upper respiratory tract, intestinal tract and genital tract and shows no symptoms to
individuals (Lim, Kim & Yang 2012). Although the presence of NTM is not
significant it indicates effects of infection and due to their ubiquity nature, their
17 Figure 1.4: The flow-chart shows natural cause progression of tuberculosis and general plan-of-detection in immunocompetent and
immunocompromised individual following exposure to tubercle bacilli by inhalation.
* TST and QuantiFERON-TB Gold test are commonly used for immunodiagnostic test.
[image:40.842.112.729.98.455.2]18
1.4 Clinical significance.
1.4.1 Slowly-growing mycobacteria (SGM).
The higher prevalence of MTBC is known to involve several factors such as
poverty, individual movement from high-risk countries, close-contact with infected
tuberculosis patients and reactivation of latent tuberculosis among HIV infected
persons (Pfyffer, Palicova 2011, Knechel 2009). MTBC consists of M. tuberculosis,
M. bovis, M. bovis BCG (bacillus Calmette-Guérin), M. africanum M. caprae, M.
microti, M. canettii and M. pinnipedii. They share genetic homology with no
significant variation between sequences (~0.01 to 0.03%) although they have
characterized difference with phenotypes (Homolka et al. 2008). Although all
members of MTBC cause infection of humans, M. bovis, M. bovis BCG, M. microti
and M. pinnipedii commonly infect warm-blooded animal as their primary host. It is
likely that transmission occurs from animal to human (de la Rua-Domenech 2006,
Leung et al. 2008, Kiers et al. 2008). Primarily, the animal to human tuberculosis
transmission cases have been found from people who have worked or resided in the
particular environment (Miltgen et al. 2002, Cvetnic et al. 2007, Romero et al. 2007,
Kiers et al. 2008, Schoepf et al. 2012).
In adults, tuberculosis progression is slow. Tuberculosis infection shows
several significant clinical manifestations in pulmonary and extrapulmonary sites
(Knechel 2009). Prolonged coughing, severe weigh-lost, night sweats, low-grade
fever, dyspnoea and chest pain are clinical symptoms indicated from pulmonary
infections. The extrapulmonary manifestation of M. tuberculosis infection includes
meningitis, pleuritis, pericarditis, synovitis, cervical lymphadenitis and infections of
19 2011). In HIV infected tuberculosis patients, both types of clinical manifestation are
significant due to the rapid progression of infection.
M. africanum and M. canetti tuberculosis infection is mainly reported in
tropical Africa (Miltgen et al. 2002, de Jong, Antonio & Gagneux 2010). It can be
transmitted to western regions by migration of infected persons that used to live in
Africa. Studies have shown that M. africanum can be subdivided into type I (M.
bovis-like) and II (M. tuberculosis-like) based on chromosomal deletion distribution
and geographic origin (Mostowy et al. 2004, de Jong, Antonio & Gagneux 2010).
Infected patients have shown similar pulmonary clinical features regardless of type.
Studies by de Jong et al. (2007) showed that a smear-positive tuberculosis patient
identified various clinical and epidemiology differences between M. africanum type
II and M. tuberculosis. Patients infected with this strain more likely showed major
lung affects which were observed on chest X-rays regardless of a cough duration
manifestation and occured in the group of older, HIV infected and malnourished
patients (de Jong et al. 2007). M. canetti tuberculosis infection have also been highly
reported in Africa with similar clinical features of the M. africanum infection.
Although the main reservoir of M. canetti is unknown, patients show M. tuberculosis
tuberculosis pulmonary clinical features and also lymphadenitis in tuberculosis
infected children. Most of the cases have been reported from the continent of Africa
(Miltgen et al. 2002).
1.4.2 Rapidly-growing mycobacteria (RGM).
The RGM are grouped as NTM and are opportunistic pathogens that can
grow within 7 days in specific growth media. To date, more than 130 species of
20 and contribute to major health care-associated pseudo-outbreaks worldwide.
Although many species have been identified as RGM, studies have shown that
non-pigmented RGM, M. fortuitum, M. chelonae and M. abscessus are pathogenic and
responsible for disease in humans (Han, De & Jacobson 2007, Chan et al. 2010).
Several cases have been reported due to the presence of RGM, commonly M.
fortuitum, M. chelonae and M. abscessus and including less common (>10 clinical
isolates or cases) human pathogenic RGM species; M. phocacium, M. mucogenicum
and M. smegmatis group (known as sensu stricto). The common RGM
species/groups cause health care-associated pseudo-outbreak diseases and are
described in table 1.4. A study by Gayathri et al. (2010) has shown the in vitro
antibiotic susceptibility testing among 148 RGM isolates and has indicated that a
majority of RGM were sensitive to Amikacin (98%), Gatifloxacin (91%),
Moxifloxacin (87%), Ciprofloxacin (76%) and Norfloxacin (Gayathri et al. 2010).
Although the majority of health care-associated pseudo-outbreak diseases are
treatable using antibiotics, the emergence of multidrug-resistant M. abscessus strains
worsen the pseudo-outbreak infection scenario due to the most-virulent and
21 Table 1.4: Most frequent human diseases caused by common RGM group/species (continued on next page).
Organism Infection/disease Clinical features Potential host
M. fortuitum
group
Post-traumatic wound Localized cutaneous, localized cellulitis or abscesses
Normal or healthy patient undergone surgery
open fracture following bone and join surgery,
Osteomyelitis, arthritis Metal puncture wound and motor accident patient related cases
Catheter infections Bacteremia Immunosuppressed patients receiving
corticosteroid
Post-keratoplasty and LASIK surgery
Keratitis Normal or healthy patient undergone surgery
Cosmetic/salon equipment contamination
Furunculosis Normal or healthy patient exposed to
contamination
M. chelonae Post-surgical trauma Desseminated cutaneous, Immunosuppressed patients receiving corticosteroid
Catheter infections Hematogenous
spread/bacteremia
Immunosuppressed patients receiving corticosteroid
Chronic pulmonary infection Lipoid pneumonia Older non-smoking women on long-term corticosteroids therapy patient
Post-keratoplasty and LASIK surgery
22 Table 1.4: Most frequent human diseases caused by common RGM group/species (continued on next page).
Organism Infection/disease Clinical features Potential host
M. abscessus Post-traumatic wound Localized cutaneous immunosuppressed patients receiving corticosteroid
Post-surgical wound Chronic disseminated
cutaneous
Immunosuppressed patients
Otitis Ear tube placement surgical patients
Pulmonary Chronic lung infection Cyctic fibrosis, M. avium complex infected patient,
non-smoking older women with bronchiectasis. Chronically immunosuppressed patients receiving corticosteriod
Catheter infections Multiple draining cutaneous nodules at lower extremities
Immunosuppressed patients receiving corticosteroid
Post-keratoplasty and LASIK surgery
Keratitis Normal or healthy patient undergone surgery
M. smegmatis
group
Post-surgical or medical procedures, face-lift plastic surgery
Cellulitis, localized abscess, Normal or healthy patient undergone surgery
Post-surgical open-fractures wound
23 Table 1.4: Most frequent human diseases caused by common RGM group/species.
Organism Infection/disease Clinical features Potential host
M.
mucogenicum
Catheter infection Bacteremia Immunosuppressed patients receiving
corticosteroids
M. fortuitum
biovarint complex
traumatic wound, Post-surgical open-fractures wound
Osteomyelitis Metal puncture wound and motor accident patient related cases