Journal of Chemical and Pharmaceutical Research, 2014, 6(6):1940-1947
Research Article
ISSN : 0975-7384
CODEN(USA) : JCPRC5
Analysis of moment structure program application in management
and organizational behavior research
Jia Liuzhan
Henan University of Technology, Management School, China
_____________________________________________________________________________________________
ABSTRACT
One of widely used program in Structural Equation Modeling was Analysis of Moment Structure Program, this software was broadly used in management and organizational behavior research. The program could help researchers to process data in various aspects, such as data exploration analysis, confirm a theoretical model, contrast the alternative model to select a superior model, to determine the degree of effect among several factors, etc. This paper attempt to give a synoptic introduction of the software for introduction. For example, the basic principles and elementary knowledge for Analysis of Moment Structure, the application and function field, the superiority of its use in model contrast, and the advancements of its contrast with other structural equation modeling software. The evaluation and review of Analysis of Moment Structure was also provided.
Key words: analysis of moment structure; structural equation modeling; management and organization behavior;
latent variable
_____________________________________________________________________________________________
INTRODUCTION
The data process method which was Structural Equation Modeling (SEM) technique was extensively used in management, social science, and psychology research fields, etc. This method was designed to explore the relationships and effect among observed variables and latent variables, which also called measured variables and unobserved, the effect size among latent variables was also included. Structural equation modeling was regard as included and integrated other statistics analytical methods such as regression analysis, path analysis, and factor analysis. Structural equation modeling had contained two parts which were measurement model and construct model. Each equation represented a causal relationship that generated a hypothesis which can be test by estimating the structural parameter of the relationship [1]. For many college graduates and journal paper, the structural equation modeling was a compulsory advanced course for further research or published. This graduate course overviewed the application of structural equation modeling to various analysis problems confronted throughout the organizational behavior, human resource management, applied psychology, developmental and educational psychology, social science and behavioral science.
THE OUTLINE OF ANALYSIS OF MOMENT STRUCTURE PROGRAM
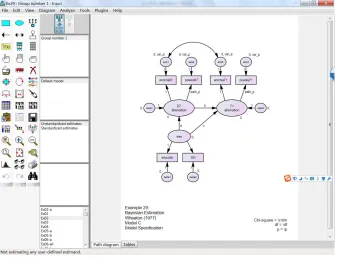
[image:2.595.139.476.187.447.2]The Amos was developed and operated within the Microsoft Windows interface. It characterized with friendly operation interface, allowed the researchers to use AMOS graphic to work directly from path diagram tools. Amos graphic provided the user with all the tools that will be needed in later creating and working with SEM path diagrams. Each tool was represented by a button and performed a particular function. AMOS allowed the users to have a few days as the evaluation period. When the evaluation had expired, users may had to purchase it. This software provided users with friendly and powerful tutor and guider, the users can learned how to use the program by the tutor and examples offered by the software. The software had developed high version in recently and gain better quality [2].The interface operations of the AMOS were as the Fig.1.
Fig. 1: The interface of AMOS
Amos was a computer program that used to multivariate data analysis which known as structural equation modeling, causal modeling and analysis of moment structures. The program included many sub modules such as multi-regression, analysis of variance (ANOVA), multivariable analysis (MANOVA), path analysis, mediate and moderate variable analysis, those programs were widely used in management studies and organizational behavior research. It was developed by the Amos Development Corporation which owned by the Statistical Product and Service Solutions Corporation previously, and now, this corporation was purchased by IBM. There were two components included in AMOS that also in all SEM program. The first component was measurement model and the other was structural model. The measurement model involved connects observed variables to a set of unobserved or latent variables through confirmatory factor analysis. The structural equation model was causal relationships among the latent variables themselves.
Because provided plentiful examples and tutorial guide, analysis of moment structures was an easy-to-use program for SEM. Through the Amos, the researchers can quickly specify, view, and modify their theory model graphically using simple drawing tools. Then the users could evaluated the supposed model’s fit, made any modifications by the recommendation, and print out a publication-quality graph of final model. Amos could performed the computations command quickly and displayed the results in seconds.
With the popular accepted and used of structural equation modeling, the AMOS had got the attention from various researchers. There were several advantages to recommend it. To begin with first, it was inexpensive that implied students could purchase their own copy. What was more, the AMOS had insert into SPSS as a menu option. Second, it had clear users guide easy to operation. Any instructor who had tried to learn through the documentation that accompanied Linear Structural Relations packaged will find a pleasure to avoid the tedious symbols which dominated by the use of Greek letters of the Linear Structural Relations.
unstandardized and standardized regression coefficients, the standard error estimated of the unstandardized regression coefficients, and test of statistical significance of the null hypothesis that each unstandardized regression coefficient equals zero. The users would see a floating toolbar appear. The toolbar may partially obscured the AMOS drawing area, but users could move it out of the way by dragging it to the side of the computer screen.
The researchers who attempt to use AMOS may be followed the direction as below: First, to make preparation of an input file that include the data set and model specify. Second, run the AMOS program processing. Third, inspected the output file of the analysis, to accept the model or modify it. A nice feature of AMOS was its high-quality graphical output. The users could took this output and copy it to the windows clipboard. From there you can insert it into a word processor such as Microsoft Word processor or a representation package like word processor program such as Microsoft Power Point.
THE FEATURES OF AMOS
i The Building of Theory Model
How to use data model to examine the fitness between data and theoretical model? Five basic steps characterized most statistical modeling applications: model specification, model identification, model estimation, model testing, and model modification [6] [7].In some substantive situations this may be excessive demand for researchers because theories were often poorly developed or even non-existent. However, theory-implied models were commonly stated in multiple regression, path analysis, confirmatory factor analysis, and structural equation models.
Concerned of these modeling demands, Jöreskog and Sörbom [8] distinguished three approaches to statistical modeling. The three approaches include: (a) a strictly confirmatory criterion in which a single formulated model was either accepted or rejected; (b) alternative models or competing models situation in which several models were suggest and one of them was selected, and (c) the model generating when an initial model was specified and does not fit the data well, it was modified (re-specified) and repeatedly tested until some fit was accepted. Overall, these three approaches had been called exploratory versus confirmatory approaches to statistical modeling.
The problem frequently perplexed researchers was that to deal with the relationship between the hypothesis model and the recommended fitness index. The strictly confirmatory approach was rare in practice because most researchers were simply not willing to reject a proposed model without at least suggesting some alternative model. The researchers had spent much time and energy in formulating the supposed theory model. Modification indices were currently used by researchers mainly in structural equation modeling to instruct model modification. The Amos computer program now provided researchers with an easy implementation of model modification in the output file using several well-known fit function criteria in an automated exploratory specification search procedure of former version of AMOS. The automated exploratory specification search procedure yielded a ranking of the top ten best models by default given several fit function criteria to imply how to make modification of model by add or delete or restrict a path or specify a parameter. However, researcher must ultimately choose one as the best model to retain.
When to modify the theoretical model according the modification index, to be bear in mind that, no automated specification search could made decision without sound theory. Therefore, as long as researchers kept in mind that the best use of automatic search procedures was to limit their attention to plausible theoretical models, the specification search procedure will never should not be abused in empirical applications. It would still be the responsibility of the researcher to decide which one to accept as the best theoretical model.
In the research practice, the initial model was often not the ultimate model. The initial model was generally hypothesized after a review of the literature, supported by theory, and was being analyzed to confirm the initial theory-implied model using sample data. Researchers often discovered that the initial model didn’t yielded reasonable fit criteria and will therefore modify their model by adding or dropping paths [9].When the research fortunately got the most fitness model, the research work should to be continued. Once obtained a model that fit well and was theoretically consistent and provided statistically significant parameter estimates, researcher must interpret it in the light of research questions and then distill the results in written form for publication. AMOS provided two ways for researcher to examine parameter estimates. One method was to use the path diagram output to visually displayed the parameter estimates while the other approach was to use tables similar to those containing the overall model fit statistics.
or similar to the one discovered by the specification search procedure.
As an evidence of misfit model, the AMOS provides the modification indexes that can be conceptualized as a chi- square statistic with one degree of freedom. Especially, concern each fixed parameter specified, AMOS provided a modification indexes value of which represented the expect drop in overall chi-square value if the parameter were to be freely estimated in a subsequent run, all freely estimated parameters were supposed had modification indexes values equal to zero. Although this decreased in chi square was expected to approximate the modification indexes value, the actual difference can be larger than expected. However, their absolute magnitude was not as important as their relative size, which can sever to be a means to measuring the importance of one against the others in pinpointing possible misfit parameters.
ii The Assessment of Theory Model
In the several important function of AMOS, one of frequently used module was to select the best fitness theoretical model from alternative models. So the experts had developed many parameters to demonstrate the superior and inferior for the model. Much research had contributed to the development of goodness of fit statistics that addressed the sensitivity of the chi-square to sample size; all programs could report a smorgasbord of fit indexes. The based indicator was chi-square. The lower value of the chi-square meant the better of the theory model. Because the chi-square test of absolute model fit was sensitive to sample size and non- normality in the underlying distribution of the input variables, investigators often turn to various descriptive fit statistics to assess the overall fit model of the data. In this framework, a model may be rejected on an absolute basis, yet a researcher may still claim that a given model out performed some other baseline model by a substantial amount. Take another way, the argument researchers made in this context was that their chosen model was substantially less false than a baseline model, typically the independence model. A model that was parsimonious, and yet performed well in comparison to other models may be of substantive interest. For example, the Tucker-Lewis Index (TLI) and the Comparative Fit Index (CFI) compared the absolute fit of the specified model to the absolute fit of the independence model. The greater the discrepancy between the overall fit of the two models, the larger the values of these descriptive statistics.
The output result of AMOS also added a separate section to report the parsimony adjusted fit statistics. These fit statistics were similar to the adjusted R square in multiple regression analysis: the parsimony fit statistics penalized large models with many estimated parameters and few leftover degrees of freedom. The output file contained a large array of model fit statistics. All were designed to test or described overall model fit. Each researcher had his or her favorite collection of fit statistics to report. Commonly reported fit statistics were the chi-square, its degrees of freedom, its probability value, the Root Mean Square Error of Approximation (RMSEA) accompanied its lower and upper confidence interval boundaries. There was also a Standardized Root Mean Residual (Standardized RMR) available through the menu option, but it was important to note that this fit index was only available for complete datasets (it will not be printed for databases containing incomplete data). The analysis process of AMOS was based on a covariance matrix of the variables which concerned. In order to test and compare the supposed model, AMOS used many fitness indexes to manifest the character of model. Models will be compared statistically by using the chi-square difference test [3].
In order to let researchers to made model specification and model select, Amos provided some indexes. Amos permit exploratory specification theory searches for the best theoretical model, given an initial model using the following fit function and modification index: chi-square, chi-square divided by the degrees of freedom (C/df), Akaike Information Criteria (AIC), Browne-Cudeck Criterion (BCC), Bayes Information Criterion (BIC), and significance level (p). Maximum likelihood estimation and unbiased covariance (as input to be analyzed) analysis properties were selected default in AMOS to obtain these fitness index above. Before extracting estimates, standardized estimates and modification indices in Amos’s output option were selected. To interpret standardized estimates in group comparisons, researchers would need to standardize the entire sample data before calculating the measurement calculation.
Fig. 2: The operation tab of AMOS
The question of how to report the result of AMOS often confused some researchers. Hoyle [4] and Hatcher [5] provided excellent discussions of how to write the results of structural equation models for publication in journals and textbooks. Hoyle provided guidelines for writing about structural equation models whereas Hatcher provided sample text from a mock write-up of the results of a SEM analysis ostensibly performed for a manuscript to be submitted for publication in a scholarly journal.
iii The Deliberation of Model Modification
To drop or add a route from one variable to another variable may be a simple operation for researchers, but it was substantial change for model specification. Any time the researchers restrict or modify a model, he or her implicitly changing its meaning in some fundamental way. In many instances, a change in model specification results in a trivial or unimportant corresponding alteration of the model’s substantive meaning, but in other cases model modification can foreshadowed a strong shift in the model’s meaning from a theoretical standpoint. Therefore, it was crucially important to think through each proposed model modification and asked myself if making the modification was theoretically consistent with the research goals. A second consideration to take into account when modify a model was that researcher was relying on the empirical data rather than theory to help specify the model. The more empirically- based modifications incorporate into the final model, the less likely the model was to replicate in new samples of data. For these reasons, researcher should modify models based upon theory as well as the empirical results provided by the modification indices. As a practical consideration, it was also worth noting that AMOS provided modification index output only when complete data were input into the program. In other words, the one could not obtained modification index information when use missing data with AMOS.
It was significant and difficult to select the appropriate model. When choosing the best theoretical model based on the specification search results, all or only a few of the fit function criteria may suggest the best model. Substantive theory and model validation must therefore guide any model modification process [9]. But as noted by many experts, researchers should begin with a substantive theoretical model to avoid misuse in empirical applications.
For researchers to modify presumptive model, the implicit index was the major source of helper. The modification of an initial model to improve fit index had been termed as specification search [10]. The specification search process was typically undertaken to detect and correct specification errors between an initial theory and implied model to reveal the nature relationship among the variables under study. The research experience had suggested that specification errors would invoked serious consequence and should be corrected. The most common approach for conducting specification searches was to alternate parameter restrictions in the initial model, once at a time to be observed exactly, to examine model fit index improvement.
THE APPRAISAL OF AMOS WITH OTHER SEM SOFTWARE
Currently, there were a couple of programs of SEM; the Amos was the better in some aspect than others. In distinct contrast to the sparseness of appropriate computer programs by which to implement SEM procedures in twenty years ago, however, researcher today had several programs to choose, such as AMOS, EQS and LISREL. The AMOS was some difference with others SEM programs upon three aspects: first was the preliminary analyses, second was model specification, parameter estimation, goodness of fit, misspecification, the third was treatment of missing, nonnormal and categorical data [12].
i Model Specification and Parameter Estimates
The programs of SEM also had different degree of difficult and easy when to make model specification and parameter specification. AMOS could use drawing tool button to specify model in path diagram. As a convention, in the schematic presentation of structural equation models, measured or observed variables were representation in rectangles and unmeasured or latent variables in ellipses or circles. As each of the AMOS, EQS and LISREL program, the maximum likelihood estimation was default. However, other estimate methods were available for users if needed. By the AMOS, this requirement was conveyed to the program by selecting the “Estimation” tab in the “Analysis Properties” dialogue box and then chooses the estimation procedure which was desired.
The essence of SEM was to investigate the fitness between the data and assumed model. Think about the model assessment, the primary interest in SEM was the extent to which a hypothesized model fit or adequately describes the sample data, evaluation of model fit should derived from various perspectives and be based on several criteria that enabled users to assess model fit from a diversity perspectives. In particular, these focus on the adequately of the model as an entirety and the parameter estimates.
In order to assessing the fit of individual parameters in the model, there were three aspects of concern: one was the feasibility of the parameter estimates, the second was the appropriateness of the standard errors, and the third was the statistical significance of the parameter estimates.
Theoretical evolution was another important function of AMOS. Assessment the model adequacy focused on two kinds of information, one was the residuals and the other was modification index. The residuals values in SEM represented the deviation between elements in the sample data and in the restricted variance and covariance matrices, one residual represents each pair of observed variables. Supposed a well-fitting model, these values should be close to zero and evenly distributed among all observed variables, but the large residuals accompany by particular parameters indicated there exist misspecification in the model, then to affect the whole model fit.
ii Preliminary Analysis of Data
Different programs had different demand for the attribute of data. When concerned about the preliminary analysis of data, the three software did varying degrees and in varying ways. AMOS: descriptive statistics related to nonnormality as well as to detection of outliers, can be requested via an “Analysis Properties” dialogue box that easy to access. EQS: EQS always reported the univariate and multivariate sample statistics. As in the LISREL, information about the sample statistics must be obtained by using particular program.
iii Treatment of Missing, Monnormal and Categorical Data
The appropriate kind data of SEM was that called interval data. One of the critically important theory assumption associated the SEM was the supposed that the data had a multivariate normal distribution [14]. To violate this normal distribution can seriously corrupt statistical hypothesis testing such that norm theory test statistic may not reveal an adequate evaluation of the model under research. The approach of AMOS to resolve the problem of multivariate nonnormal data was to undertake a procedure in terms of “bootstrap”. The Bootstrap served as a resampling method by which the original sample in considered representing the population. Multiple subsamples of the same size as the parent sample were then drawn randomly with replacement, from this population. These subsamples then provided the data for empirical investigation of the diversity of parameter estimated and index of fit. The considered advantage of this approach was that it allowed the researchers to assess the stability of parameter estimate and then produced their values with a greater extend of accuracy. When data were not normally distributed or otherwise flawed in some way (almost always the case), larger samples will be compensation. It was difficult to make absolute recommendations what sample sizes was suitable. The general recommendation was thus to obtain more data whenever possible.
The data that surveyed from Likert scale questionnaires was the normal data used in AMOS. Another important assumption supposed with SEM was the requirement that all variables should to be on continuous scale. However, concerned about the data in organizational and management generally, and assessment data in particular were typically of ordinal scale, this issue had long been focused. Although use of the distribution free method was widely accepted as an appropriate estimation procedure in this regard, so it’s very stringent and impractical on the sample size [15]. When concerned to the AMOS, it was unable to identical the categorical scaling of variables. As contract, the EQS program allowed for estimation with normal theory maximum likelihood, and then offered the robust chi- square and standard errors for correct statistical inference. However, this approach was not recommended for all case but the largest sample size.
CONCLUSION
The AMOS was development to satisfy the data process demand from research effort. One major importance problem in the assessment instrument was the extent to which the measurement scale does measure that which they were supposed to measure, in other words, the degree to which their factorial structures were valid. One of the most strictly methodological approaches to ensure for the validity of dimensions structures was the use of confirmatory factor analysis (CFA) within the framework of structural equation modeling. The AMOS had reached this standard and promoted the research of complex organizational variables. The AMOS was better in some aspects than other SEM software and gain advance application in many research fields. Many graduate student and researchers that were intended to avoid the obscure composition language were preferred to choose this software. As an easy and powerful SEM program, AMOS was supposed to favor the researchers. In recently years, the AMOS had been purchased by Statistical Product and Service Solutions (SPSS) Corporation firstly, and then acquired by International Business Machines Corporation (IBM). The AMOS software had developed from a simple weak company to be one of remark product of the nationwide corporation of IBM, had revealed that AMOS accept by vast majority of researchers and institutions.
Acknowledgments
Supported by Foundation of Henan University of Technology Doctoral Program (NO: 150142), Supported by Natural Science of Key Program Foundation of He'nan Educational Committee (NO: 13A630167).
REFERENCES
[1] Schumacker. R. E., Lomax. R. G. A Beginner’s Guide to Structural Equation Modeling, pp.121-132, 1989. [2] Gignac. G. E., Palmer. B. Bates. T and Stough. C. Australian Journal of Psychology, vol.58, no.12, pp.144–150,
2006.
[3] Steiger. J. H, Shapiro. A and Browne. M. W. Psychometrika, vol.50, no.3, p. 253–264, 1985. [4] Hoyle. R. Structural Equation Modeling: Concepts, Issues and Applications, p. 231-235, 1995.
[5] Hatcher. L. A Step-by-Step Approach to Using the SAS System for Factor Analysis and Structural Equation
Modeling, p.108-119, 1994.
[6] Schumacker. R. E. Multiple Linear Regression Viewpoints, vol.21, no.4, p. 12–22, 1994.
[7] Schumacker. R. E and Lomax. R. G. A Beginner’s Guide to Structural Equation Modeling, p.167-178, 2004. [8] Sörbom. D. Psychometrika. vol.54, no.3, p. 371–384, 1984.
[13] Arbuckle. J. L. Advanced Structural Equation Modeling: Issues and Techniques, p.205-221, 1996.
[14]K. Jöreskog and D. Sörbom. LISREL 8: User’s Reference Guide, Lincolnwood, Scientific Software International,
p.187-196, 1989.