© 2017, IRJET | Impact Factor value: 6.171 | ISO 9001:2008 Certified Journal
| Page 26
EFFECT OF BASE ISOLATION ON SEISMIC PERFORMANCE OF RC
IRREGULAR BUILDINGS
Sunny Patel
1, Abbas Jamani
21
P.G. Student, Department of Structural Engineering, L.J.I.E.T., Ahmedabad, Gujarat, India
2Associate Professor, Department of Structural Engineering, L.J.I.E.T., Ahmedabad, Gujarat, India
---***---Abstract -
In the present study of base isolation, irregular
shaped six models have been analysed without base isolation, with rubber isolation and friction isolation using Etabs software. A building was analysed using the equivalent lateral force method and response spectrum analysis as fixed base (FB) and as isolated base (IB). So in this work the performance of RC building in dynamic are studied with base isolation and the results are compared with the results obtained for building without base isolation. A seismic evaluation of the building, isolated with the LRB and FPS, is performed using a nonlinear three-dimensional analytical model. The parametric study is concentrated on base shear and displacements of isolated models having geometric irregularities in vertical and plan.
Key Words: Base isolation, Irregular Buildings, Seismic Performance, LRB, FPS, Etab
1.INTRODUCTION
Reinforced concrete is a major construction material for civil infrastructure in current society. Construction design has always preceded the development of structural design methodology. Earthquakes are one of nature’s greatest hazards, throughout historic time they have caused significant loss of life and severe damage to property, especially to man-made structures. The first step in understanding earthquake risk is to dissect the earthquake risk or loss process into its constituent steps. Earthquake risk begins with the occurrence of the earthquake, which results in a number of earthquake hazards. The most fundamental of these hazards is faulting, that is, the surface expression of the differential movement of blocks of the Earth’s crust. To avoid the consequences of earthquake there is a technique known as base isolation. Dramatic collapse of buildings has been observed after each disastrous earthquake, resulting in loss of life. To prevent such a loss Base isolation is used which enables a building to survive potentially devastating seismic impact by providing flexibility in to the connection between the building and the foundation. The mechanism of the base isolator increases the natural period of the overall structure, and decreases its acceleration response to earthquake /seismic motion. Base isolation is an effective method for earthquake resistant design to reduce vibrations transmitted from ground to the structure.
1.1 Base Isolation
The earthquakes in the recent past have given new ideas to them by giving enough evidence of performance of different type of structures under different earthquake conditions and foundation conditions. This has given birth to different type of innovative techniques to save the structures from the earthquakes.
The technique of base isolation has been developed in an attempt to reduce the response on buildings and their contents during earthquake attacks and has proven to be one of the most effective methods for a wide range of seismic design problems on buildings in the last two decades.
Base isolation systems are increasingly utilized methods of advanced seismic resistance. The base isolation is technique that has been used to protect the structures from the damaging effects of earthquake.
Base isolation or seismic isolation is an approach to earthquake-resistant design that is based on the concept of reducing the seismic demand rather than increasing the earthquake resistance capacity of the structure.
1.2
TYPES OF BASE ISOLATION SYSTEM
1.2.1 Elastomeric-Based Systems: The spring and damper elements connecting the building mass to its support are called bearings. Considering the basic concept of base isolation system, we need to manufacture devices that can provide appropriate stiffness in vertical direction and flexibility in horizontal direction. Following years of development, elastomeric bearings have been developed to fulfill the various needs of base isolation systems.
Natural rubber Bearings
Lead-Plug Bearings
© 2017, IRJET | Impact Factor value: 6.171 | ISO 9001:2008 Certified Journal
| Page 27
2. DESIGN OF ISOLATION SYSTEMS
2.1
Design of lead rubber bearing isolation system
(LRB)by IS code (1893 Part I - 2002) method.
Step 1: Analysis of fix base building
Step 2: Set the target time period or displacement Step 3: Determination of hysteresis parameters of isolator
(
Ku, Kd, and Qd)
Step 4: Calculation of bearing dimensions Step 5: Check isolator stability
Step 6: Check strain limit in rubber
Step 7: Calculate remaining properties and summarize Step 8: Calculation of properties of isolator for designed dimension
2.2
Design of friction pendulum system (FPS) by IS
code (1893 Part I-2002) method.
Step 1: Analysis of fix base building
Step 2:
Find
The period Td of the friction pendulum system(FPS) isolated structure
through a proper choice of
the radius of curvature, RFPS
Step 3: Determine the effective stiffness Keff Step 4: Determine the effective damping ratio ξeffStep 4: Determine vertical displacement δv of the structure
Step 5: Check the condition (
DR ≥ μ)
for re-centering of theisolated structure.
3. ANALYSIS OF STRUCTURE
In the present task, Six model has been used. Software ETAB-2013 has been used for performing analyses of this structure. The details for generating the structural model in the software are as given below:
Model Description
Concrete Grade M25
Steel Grade Fe415
Storey Height 3.5
Slab thickness 150 mm
Seismic Zone zone - V
Soil type Type II
Importance factor 1
Response reduction factor 5
Live load 3 KN/m2
Dead load 2.5 KN/m2
geometric irregularity in plan and another three model has been prepared with vertical geometric irregularity.
Model 1 : Plus shape G+5 story
Model 2 : L shape G+5 story
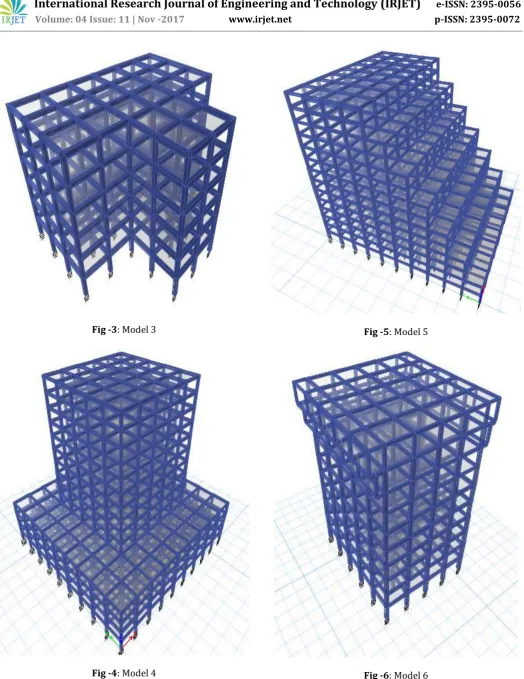
Model 3 : T shape G+5 story
Model 4 : 14 story with vertical irregularity 0.22
Model 5 : 14 story with vertical irregularity 0.60
Model 6 : 10 story with vertical irregularity 0.125
Fig -1: Model 1
© 2017, IRJET | Impact Factor value: 6.171 | ISO 9001:2008 Certified Journal
| Page 28
Fig -3: Model 3Fig -4: Model 4
Fig -5: Model 5
[image:3.595.37.562.52.732.2]© 2017, IRJET | Impact Factor value: 6.171 | ISO 9001:2008 Certified Journal
| Page 29
Compare the results for different model with differentsupport conditions (i.e. Fix Base, with rubber isolation and friction isolation) for story shear and story displacements.
0
2000
4000
Story 1Story 2Story 3Story 4Story 5Story 6
Story Shear : X-direction
FB
LRB
FPS
Chart -1: Story Shear X direction for Model 1
Chart -2: Story Shear y direction for model 1
0
10
20
30
40
50
Base Story
1
Story
2
Story
3
Story
4
Story
5
Story
6
Story Displacement :
X-direction
Chart -3: Story displacement X direction for Model 1
0
20
40
60
Base Story
1
Story
2
Story
3
Story
4
Story
5
Story
6
Story Displacement :
Y-direction
FB
LRB
FPS
Chart -4: Story displacement Y direction for Model 1
0
2000
4000
Story 1Story 2Story 3Story 4Story 5Story 6
Story Shear : X-direction
FB
LRB
FPS
© 2017, IRJET | Impact Factor value: 6.171 | ISO 9001:2008 Certified Journal
| Page 30
Chart -6: Story Shear Y direction for Model 20
100
Base Story
1
Story
2
Story
3
Story
4
Story
5
Story
6
Story Displacement :
X-direction
FB
LRB
0
100
Base Story
1
Story
2
Story
3
Story
4
Story
5
Story
6
Story Displacement :
Y-direction
FB
LRB
Chart -8: Story displacement Y direction for Model 2
0
5000
Story
1
Story
2
Story
3
Story
4
Story
5
Story
6
Story Shear :
X-direction
FB
LRB
Chart -9: Story Shear X direction for Model 3
Chart -10: Story Shear Y direction for Model 3
© 2017, IRJET | Impact Factor value: 6.171 | ISO 9001:2008 Certified Journal
| Page 31
Chart -12: Story displacement X direction for Model 30
5000
Story
1
Story
3
Story
5
Story
7
Story
9
Story
11
Story
13
Story Shear :
X-direction
FB
LRB
Chart -13: Story Shear X direction for Model 4
0
2000
4000
Story
1
Story
3
Story
5
Story
7
Story
9
Story
11
Story
13
Story Shear :
Y-direction
FB
LRB
Chart -14: Story Shear Y direction for Model 4
Chart -15: Story displacement X direction for Model 4
0
100
Story Displacement :
Y-direction
FB
LRB
Chart -16: Story displacement Y direction for Model 4
© 2017, IRJET | Impact Factor value: 6.171 | ISO 9001:2008 Certified Journal
| Page 32
0
5000
Story
1
Story
3
Story
5
Story
7
Story
9
Story
11
Story
13
Story Shear :
Y-direction
FB
LRB
Chart -18: Story Shear Y direction for Model 5
Chart -19: Story displacement X direction for Model 5
0
50
100
Story Displacement :
Y-direction
FB
LRB
Chart -20: Story displacement Y direction for Model 5
Chart -21: Story Shear X direction for Model 6
Chart -22: Story Shear Y direction for Model 6
0
50
100
B
ase
St
o
ry
1
St
o
ry
2
St
o
ry
3
St
ory
4
St
o
ry
5
St
o
ry
6
St
o
ry
7
St
o
ry
8
St
ory
9
St
o
ry
10
Story Displacement :
X-direction
FB
LRB
© 2017, IRJET | Impact Factor value: 6.171 | ISO 9001:2008 Certified Journal
| Page 33
0
10
20
30
40
50
60
70
B
ase
St
ory
1
St
o
ry
2
St
o
ry
3
St
o
ry
4
St
ory
5
St
ory
6
St
o
ry
7
St
o
ry
8
St
o
ry
9
St
ory
10
Story Displacement :
Y-direction
FB
LRB
FPS
Chart -24: Story displacement Y direction for Model 6 3. CONCLUSIONS
When compared with fixed base structure, the story
shear is reduced in base isolated structures.
In comparison of isolated structures with LRB and FPS
story shear decrease more with reduse in story height in FPS isolated structure.
As per results story displacement value is high in base
isolated structures compared with fix base structure. As story height increases the displacement value increases more in FPS isolated structures compared with LRB isolated structures.
For structures with less height LRB isolated structure
gave good results but for more height building response is good in FPS isolated structure.
Thus it is concluded that the response of building is
good in base isolated structures than fixed base structures.
REFERENCES
[3] Prof. T. Subramani, J. Jothi, M. Kavitha ,”Earthquake
Analysis of Structure by Base Isolation Technique in SAP” IJERA,ISSN : 2248-9622 Volume 4,2014.
[4] Smita Gupta, Dr. M Helen Santhi ,“Dynamic Analysis of
Soft Story Frame with Isolators”, IJMTST, ISSN : 2455-3778 Volume 2,2016.
[5] Ganga Warrier, Balamonica, Sathish Kumar,
Dhanalakshmi, “Elastomeric Base Isolation System For
Seismic Mitigation of Low-Rise Structures”,
International Journal of Engineering research and Structure, ISSN 0976 –6308, Volume 6, Issue 6, June (2015)
[6] IS: 1893:2002, Criteria for earthquake resistant design
of structures, Bureau of Indian Standards, New Delhi.
[1] S. M. Dhawade , Prof. Ram Meghe , “Comparative Study
for Seismic Performance of Base Isolated & Fixed Based RC Frame Structure”, IJCER, ISSN : 2278-3652 ,Volume 5,2014