Munich Personal RePEc Archive
Diagnosing performance management
and performance budgeting systems: A
case study of the U.S. Navy
Webb, Natalie J and Candreva, Philip J
Naval Postgraduate School
9 March 2009
Online at
https://mpra.ub.uni-muenchen.de/14754/
Diagnosing performance management and performance budgeting systems:
A case study of the U.S. Navy
Natalie J. Webb, PhD
Philip J Candreva
Naval Postgraduate School
Diagnosing performance management and performance budgeting systems:
A case study of the U.S. Navy
Abstract
We present here a case study of an organization within the U.S. Navy that created a new
organizational construct and performance management system. We explore the issues faced by
naval leaders as they attempt to use their performance information to make resource allocation
decisions at the sub-organization level, and base budgets at the organization and service (navy)
level. We attempt to diagnose many of the practical problems a government organization
encounters when implementing a performance management system, to include trying to inform
budgets, and make recommendations on actions that would improve the strength of the
performance system. We find in the organization a good conceptual framework, organizational
enthusiasm, and reasonable attempts to link disparate information systems into a coherent whole.
The good intentions are hindered, however, by inadequate accounting systems, a lack of
understanding of cost accounting methods, weak use of terminology and longstanding
institutional attitudes. This case confirms challenges associated with both performance
management systems and performance budgeting found in the literature, and we offer
recommendations for public officials considering such endeavors.
1. Introduction
In a recent manuscript, Schick (Schick A. , 2008, p. 2) stated, “the literature and practices
of performance budgeting have been too long on exhortation and too short on diagnosis.” We
present here the case of a very sophisticated and informative performance management system
used within the U.S. Navy, examining the strengths and weaknesses of the system as used by the
internal management team. We also explore the issues faced by naval leaders as they attempt to
use their performance information to make resource allocation decisions at the sub-organization
level, and base budgets at the organization and service (navy) level. We attempt to diagnose
many of the practical problems a government organization encounters when implementing a
performance management system, to include trying to inform budgets, and make
recommendations on actions that would improve the strength of the performance system.
We examined the surface warfare enterprise (SWE), part of the U.S. Navy’s surface
warfare (SURFOR) organization that supports surface ships. The SWE organization is an ideal
case study for public managers because it is in the midst of transformation; it is a relatively new
organizational construct using an innovative performance management system providing
information to help improve efficiency and effectiveness of the organization. The SWE’s goal is
“to streamline ship maintenance and training for sailors, increasing the amount of time surface
ships spend at sea” (SWEwebsite). It is the hope of Navy leaders that the system will also drive
the budgeting process. The SWE (and the Navy) wants to close the “affordability gap” between
resources available and needed by improving efficiency and effectiveness in all activites. (See
www.navyenterprise,navy.mil/about/faz.aspx.)
The ultimate outcome for navy ships is how they perform if and when they execute a
mission, assigned by an organization outside the SWE. A combatant commander, one of the
unified or specified top military leaders established by the President and generally in command
of a geographic area, takes a ready ship provided by the SWE and tasks it to perform a specific
mission, usually in conjunction with other military assets. Rather than being able to measure the
complex interactions of multiple military assets across different missions, SWE leaders focus on
preparing individual ships for these contingencies. For the SWE, the final measure of
performance is a warship ready for tasking across multiple possible missions, an output with a
quality measure (Robinson, 2007, p. 28) (Hatry, 2001). The SWE uses a performance
management system based on five key performance algorithms or figures of merit (FOMs). The
FOMs correspond to Personnel, Equipment, Supplies, Training and Ordnance, or the acronym,
PESTO.
In the next section, we provide a review of the performance management and
performance budgeting literatures relevant to our case study. In the third section, we describe
the organization of the surface forces and the SWE. We explain the performance management
system and how SWE leaders measure readiness in the PESTO areas by ship and mission. In the
fourth section we provide details on the PESTO readiness indicators calculated from
performance algorithms. We explain some of the benefits and shortfalls of measuring readiness
using the algorithms and resulting performance indicators. We also discuss problems in
aggregating the measures to get at overall ship and SWE effectiveness. We then discuss how the
SWE uses cost analysis and some of the difficulties in measuring costs of inputs used to generate
readiness indicators. In the final section, we discuss our findings and results, grounded in the
literatures. We then conclude and make recommendations to help the SWE and other public
organizations best (and most realistically) use performance systems to inform management and
budgeting.
2. Literature Review
Performance Management
Robinson (2007, p. xxvi) defines program management or managing-for-results as “the
use of formal performance information to improve public sector performance across the board,
including in human resource management, in strategic planning and budgeting.” He further
defines performance management as “consist[ing] of classifying government transactions into
functions and programmes in relation to the government’s policy goals and objectives;
establishing performance indicators for each programme or activity; and measuring the costs of
these activities and the outputs delivered” (2007, p. 3). With respect to specific programs and
activities conducted by an organization, performance management systems assess the efficiency
and effectiveness by measuring and evaluating inputs to activities or work to outputs (efficiency)
and outputs to outcomes (effectiveness).1
Frumpkin and Galaskiewicz (2004), and Robinson (2007), among others, note that
government organizations have the least direct control over inputs and the least precise indicator
of outputs of any type of organization. Performance management is often hampered by the lack
of control of some inputs and the difficulty in finding an appropriate output measure.
Ambiguous causal relationships, environmental contingencies, and lag times contribute to the
uncertain link between the production of outputs and attainment of outcomes (Havens H. , 1983).
In the case of the Navy, budget authority serves as a proxy for inputs and their costs and as
quality measures for PESTO activities performed to result in ready ships (Keeney, 2005). Euske
et al provide guidance on applying activity-based management to service processes. In their
work, they suggest tracking inputs and their resources relative to the output (service) the
customer expects, “balancing that perspective with how to manage the service within the
enterprise” (1999, p. 9) More generally, activity-based costing uses input budget data (costs) to
connect specific activities to outputs to support management decisions. See, for example,
Brown, R.E., Myring, M.J. & Gard, C.G. (1999), Mullins, D.R. & Zorn, C.K. (1999) or
Williams, C. & Melhuish, W. (1999). The activity-based costing and activity-based management
literatures provide useful insight into how to tackle the Navy’s problem of connecting input
usage to outputs, even when both are difficult to measure.
As is typical for organizations with intangible outputs, proxy indicators substitute for
observable outputs and are problematic for determining efficiency and effectiveness. In this case
study, the PESTO indicators cannot be aggregated into a single meaningful measure of
readiness2; thus there is no output or outcome measure that can help determine organizational
efficiency, much less effectiveness. To determine if a ship is “ready,” personnel use personal
experience and judgement with the five stoplight indicators. The measures available help
determine where to spend the next dollar, but cannot inform the performance management
system directly nor the budgeting process, indirectly.
Performance budgeting
Robinson suggests multiple definitions for performance budgeting. In the broad case, “it
refers to public sector funding mechanisms and processes designed to strengthen the linkage
between funding and results (outputs and outcomes), through the systemic use of formal
performance information, with the objectives of improving the allocative and technical efficiency
of public expenditure.” (Robinson, 2007, p. 1) He also refers to performance information as
“information on results achieved by public expenditures and [ . . .] information on the costs of
achieving those results.” (ibid. p. 1). He further discusses that performance budgeting can be
used to inform budgeting (as a tool) or it may be used to directly link performance measures to
funding. As we will show, the SWE is attempting to do this with limited success.They are
generating performance information (albeit incomplete), they desire technical and allocative
efficiency, but they do not adequately understand the causal relationships nor do they have
financial information in the most appropriate format.
Havens (1983) notes the difficulty of integrating performance information into the budget
process. Schick (2008, p. 5) reminds us that a performance-based budget must be based on units
of outputs or outcomes and the costs allocated to them. This information should have value to
the decision maker: Havens continues, “What is needed is a flow of analytic information which
reaches decision-makers at the time and in the form best suited to support them in making
resource allocations and other policy judgments.” (1983, p. 104) (See also, Robinson (2007).)
The SWE has yet to make the leap from its longstanding encumbrance-based budgeting and
accounting systems to a system of cost accounting that will provide adequate performance-based
cost information. Their leaders’ attempts illustrate the difficulty of adapting performance-based
budgeting to a government organization.
Empirical evidence suggests that the federal government, many state governments and
other countries use performance information in the management of programs and display the
information in their budgets, but little evidence tells us whether spending decisions were greatly
influenced by the performance information. For more, see Schick (2001) (Willoughby, 1998)
(Hackbart, 1999) (Congressional Budget Office, 1993). Joyce (1993) suggests that basing the
budget on performance may be an unrealistic objective and that performance information should
only be expected to inform the budget process. He recommends that at each stage of the budget
process – development, execution, audit & evaluation – and by each actor in the process, the
different information needs be analyzed and met. Performance should inform budgeting, in
different ways, at different times for different budget participants (Joyce P. G., 2003). Reform of
budgeting processes is not at all easy, Jones & McCaffery (2002) remind us as they stipulate
“inevitable budgetary dilemmas” that make the reform of budget processes confusing. The
production and processing of information in the budget process is such that a pure performance
basis is unrealistic. The SWE’s struggle to link performance measures with budgets is both
understandable and expected.
If an organization does not measure input costs and has no direct measure of outputs,
much less outcomes, it cannot say how much money leads to a certain level of readiness. Lu
(1998) suggests that without a complete performance management system (with unknown
outcomes, weakly measured inputs and their costs, and using proxies for outputs), information
that may not be used, and incentive and bureaucratic issues, the Navy cannot hope to achieve a
performance budgeting system that works. Properly constructed incentives for managers and
budgeters must be aligned with performance information (Grizzle G. A., 1987). Sub-optimal
behavior can result from mismanaging both actions and resources according to separate
performance indicators, and sub-optimal behavior may occur at different levels of an
organization. Managers may not want to be held accountable for outcome measures that have
elements beyond their control. Another possibility is that “readiness” is a theoretical concept –
until the ship is actually tested under mission conditions, it is possible that readiness will not lead
to the desired outcome, or the theory about the linkage between activities and desired outcomes
is not correct.
Organizational practices create incentives to manage performance, but disincentives to be
accountable through the budget process – showing efficiencies currently takes funds away from
efficient organizations (“use-it-or-lose-it” (Niskanen, 1971)) whether they are effective or not.
As McNab and Melese (McNab, 2003, p. 77) note, “a control budget’s primary function is to
insure accountability to taxpayers, this function may be subverted by the focus on expending
current resources and maintaining the current level of appropriations. “ As Schick so accurately
comments (Schick A. , 2008, p. 8)
“The “agency” problem is especially acute on matters of performance, because adverse results can prejudice an entity’s budget. A resourceful manager once explained his behavior: ‘P[erformance] B[udgeting] requires me to load the gun that will be pointed at my head; as a manager, it is not hard for me to disarm the gun.’”
We will show that the SWE decisions are still largely dominated by the incentives in their
encumberance-based accounting systems, fiduciary responsibilities, and longstanding cultural
norms. Those norms have not been displaced by the relatively new use of performance
information.
3. Navy surface forces and performance management
The Navy, like all the military departments, provides assets ready to deploy in defense of
the country. It provides personnel and trains and equips these resources, having them ready to
support military operations conducted by the unified commanders (e.g., U.S. Central Command).
Many organizations within the military services use performance management systems and
attempt to inform the budget process using them; this paper focuses on performance of a part of
the shore component of the Navy, the one responsible for supporting assets afloat. The shore
component is organized into three “type commands” responsible for the military readiness of
aircraft, surface ships, and submarines. We focused our research on the surface force
(SURFOR), which currently supports 162 surface ships of the U.S. Pacific and Atlantic Fleets
based in San Diego; Pearl Harbor; Norfolk; Mayport, Fl.; Ingleside, Texas; Everett and
Bremerton, Wash.; Bahrain; Yokosuka, and Sasebo, Japan. (Navy Times, 2008).
Under the command of a three-star admiral, in 2005 SURFOR established the Surface
Warfare Enterprise (SWE), an operational construct of portions of the shore establishment that
work together to achieve “readiness” of the navy’s surface forces. Management of naval surface
forces under the SWE seeks to optimize warfighting readiness of the surface fleet. To increase
readiness, the SWE uses key measures as defined by PESTO. Navy leaders use PESTO to assess
ships, support and maintenance commands, and commands around the globe necessary to
coordinate the manning, training, equipping, and sustaining the fighting forces. Navy leaders
believe continuous process improvements (technical efficiency) will support the core areas of
maintenance, modernization, logistics, manning and training, will create budget slack so the
Navy can buy more ships, ammunition, and fuel (allocative efficiency).
Matrix organization
The SWE resulted in a reorganization of the SURFOR headquarters as a matrix with
product line managers held responsible for all PESTO areas for a given ship type. Called class
squadrons (CLASSRONs) and led by a commodore, these managers are responsible for the
overall readiness of four types of ship: frigate, destroyer, cruiser and amphibious. Different
ships within a product line have different systems, requirements and capabilities. SURFOR must
prepare individual ships according to the ship’s technology and expected mission requirements.
To meet the navy’s goal to project power anytime, anywhere, navy ships must be ready to
function independently, complemented by advanced technological reach including other assets.
In other words, navy ships should be evaluated for mission readiness independently, which is the
SWE’s proxy for output. The ship will be evaluated again by the combatant commander at some
point within the group of assets with which it deploys, but this evaluation is outside the scope of
the SWE’s initial responsibility to provide a ready ship. The belief inherent in the system is that a
properly trained and assessed individual ship will be capable of successfully integrating with
others.
In addition to product line (ship type) managers, SURFOR assigns functional managers
who oversee each of the PESTO areas across all ship types. There is a senior officer in charge of
personnel, another in charge of equipment maintenance, and so on, who manage those matters
for the entire force. Functional managers support the product line managers to ensure each of
their ships are ready to perform each of the various missions they may be assigned.
The reorganization into a matrix gives navy leaders and those on the deck plates a new
view: Rather than looking only at air, surface or submarines, they now look horizontally and
from the top down toward the individual units represented by the CLASSRONS. (We note here
that CLASSRONs are a SWE construct, used to prepare ships for deployment, and do not replace
[image:12.612.199.449.406.655.2]the operational construct or chain of command when deployed.)
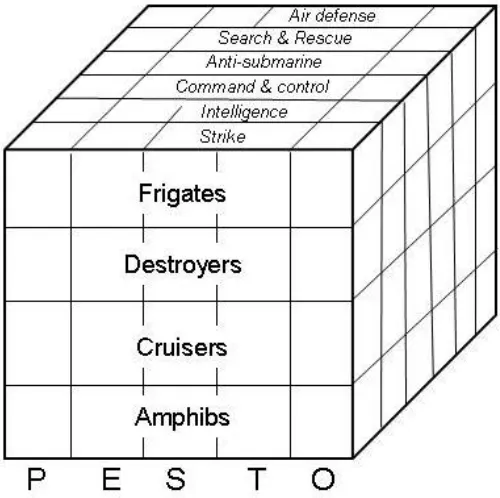
Figure 1. Missions, ship type, and readiness indicators
Missions
In addition to organization by type of ship and functional area, SWE performance is
assessed by potential mission3. The navy’s overarching goal is to be able to quickly deploy
properly trained, manned and equipped forces to troubled areas to help stabilize and protect US
interests around the globe. Ships regularly deploy to the Arabian Gulf and the Western Pacific,
and also routinely conduct counter-narcotic operations in the war on drugs – an increasingly
important part of funding the global war on terror. Their missions may be search and rescue,
strike, anti-submarine, intelligence, and many more. Thus, not only are the PESTO elements
important, they must be measured based on potential mission type. Figure 1, Missions, ship type
and readiness indicators, sums up the organization of the performance management system
employed by the SWE.
In Figure 1, the functional lines, PESTO, intersect the CLASSRONs, or product lines, by
mission. For example, a ship preparing for an anti-submarine mission will have five
performance indicators (PESTO) corresponding to its readiness to assume that mission. It will
have managers overseeing each of the PESTO measures for SURFOR as a whole, and it will
have a CLASSRON manager overseeing readiness of the particular type of ship.
The SWE’s Performance Management Framework
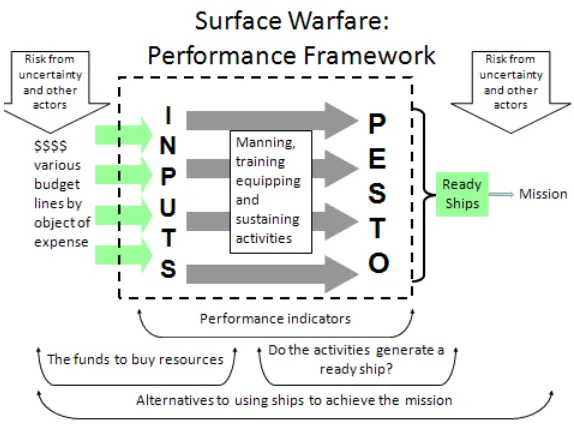
Figure 2: SWE Performance Framework shows the relationships among budget authority
(appropriation or line item), inputs, outputs and outcomes. Budget authority from different
appropriations buys inputs related to PESTO. The inside of the figure, shown by a dotted line,
represents the performance management system, where managers concentrate on efficiencies
measured by the PESTO indicators. On the right side of Figure 2, “outputs” are ships ready for
tasking for different missions. Ready ships are an input to a combatant commander, who
ultimately decides what assets to employ and whether the mission was effective. SWE personnel
regularly call “ship readiness” the outcome. (Indeed, an argument can be made that it is an
intermediate outcome to the larger defense mission.) In this study, we correlate PESTO
indicators to five proxy levels, each corresponding to the quality of activities taken to measure
ship readiness. Taken together and with human interpretation, they provide an overall picture of
[image:14.612.161.448.242.463.2]a particular ship’s availability to conduct a certain mission.
Figure 2: SWE Performance Framework
Several problems with the SWE’s performance management system emerged from our
construction and understanding of this figure. PESTO indicators cannot be aggregated into a
single meaningful measure of overall ship readiness; thus there is no direct output or outcome
measure that can help inform budgeting processes. We observed navy leaders using budget
authority as the measure of costs of inputs; it measures neither costs nor inputs well for reasons
we discuss below. Some resources used in producing PESTO come from outside the SWE and
are in other organizations’ budgets. Taken together these problems result in a situation where
SWE managers cannot measure the efficiency of the full production function to get a ship ready.
After some examination of the culture in and methods employed by the SWE, we find that the
SWE’s good intentions are hampered by inadequate accounting systems, a lack of understanding
of cost accounting methods, a lack of clarity in terminology and longstanding institutional
attitudes. In the next section, we discuss the SWE’s specific PESTO algorithms and attempts to
perform cost analyses.
4. PESTO performance measures and costs
Measuring an individual ship’s readiness using the PESTO indicators
On the inside of Figure 2, PESTO algorithms attempt to capture the relationships among
the inputs, activities or processes and outputs. Replacing the “metric mania” (where the sheer
number and disorganization of metrics makes evaluating, comprehension and accountability
problematic (Casey, 2008), at the TYCOM level, PESTO attempts to simplify performance
measurement. Generated PESTO indicators are proxies, standardized along a 0-100 scale, and
assigned “green,” “blue,” “yellow” and “red” by scores of 90-100, 80-90, 70-80 and below 70,
respectively. Each indicator proxies whether the ship can perform a certain type of mission,
relative to the indicator (personnel, equipment, etc.) and is an output measure agreed upon by
SWE personnel. The maintenance performance indicator, for example, comes from an algorithm
that assigns different values to different repair tasks weighted according to their impact on
mission accomplishment. The personnel indicator captures both the quantity of sailors and their
individual training and qualifications. Similarly, the training performance indicator derives from
an algorithm that calculates the “right” training for the unit as a whole. Of the five performance
algorithms, personnel, training, and maintenance are the most mature. To illustrate the
complexity of tracking inputs to “outputs,” we next describe the relationship between the
personnel and training pillars.
The personnel (P) and training (T) pillars of the PESTO framework are closely related.
Management of personnel primarily focuses on the inputs, processes and outcomes related to
ensuring a sailor with the requisite skills fills a particular job. Managers use measures of “fit and
fill” to assess performance; fill measures the number of sailors assigned to a ship and fit
measures the professional characteristics of those sailors. If, for example, a ship requires four
navigators, one each possessing a certain skill, four navigators are in the crew but collectively
are certified as competent in only three of the skills, the ship is 75% fit, but 100% full. This
deficiency can be corrected by training one of the sailors in the requisite skill or, in the course of
the routine rotation of sailors to and from shipboard duty, identifying a sailor with the requisite
skills to be the next assigned. Hence, one can see the interrelationship between the personnel
management and training management pillars.
Training is made up of two components: individual and ship-level training. Individual
training may occur prior to a sailor’s arrival to the ship or it may occur once the sailor is part of
the crew. The former is normally preferred because it increases the amount of time during which
the ship is fully ready to complete the various missions that sailor supports. If a sailor must leave
the ship for training to become qualified in an area, her absence may reduce readiness in another
area because each sailor supports multiple mission areas. Those who manage personnel and
training readiness monitor the continuous process of sailor assignments, initial qualifications,
gaps between current and desired states, and training events.
It is not enough to populate a ship with sailors with requisite skills: the sailors must
demonstrate the capability to work together, employing the ship’s technology, in a fashion that
assures the ability to meet mission requirements. Thus, ship level training is measured in terms
of the percentage of mission areas a ship has been certified as able to perform, the time it takes a
ship to complete the certification process, and the cost associated with the certification events.
Taken together, these two pillars provide other useful management information. For
instance, navy leaders determined that a 90-95% fit measure is a reasonable level to expect given
the system complexities of recruiting, training, assigning and retaining sailors, but ships can
generally perform well if they are manned at 103% fill. The few extra people adequately
compensate for the missing skills. The system, however, is far from comprehensive: The training
management system, for instance, is not adequately linked to the maintenance management
system. Many maintenance events are event-driven (e.g., each time a gun is fired, several
preventive maintenance tasks must be performed) but those maintenance costs are not part of the
training cost computation.
Measuring readiness and outcomes for the SWE as an organization
Despite their usefulness at the margin, we found that managers cannot aggregate the
PESTO performance indicators to a single measure of readiness. It is not reasonable to
aggregate stoplight scores. In some instances a “good” indicator (green or blue) does not insure
a ship can perform a certain type of mission. For example, a ship tasked to perform a search and
rescue mission could be “green” for training, equipment, ordnance and maintenance, and could
have nearly all personnel ready to go, but could be missing the one requisite swimmer needed to
perform the rescue. Despite appearing “green,” the ship cannot perform the mission and is not
ready. The one missing item can cause the entire readiness indicator to be “redlined,” or dropped
from a readiness status. Contrarily, a ship might be at a lower-than-green level due to minor
problems that cause the algorithms to drop its scores, but still be able to perform the mission. In
another case, the commanding officer might feel ready to perform a certain type of mission
because of an innovative work-around, and thus might be “ready” in spite of the readiness
indicators.
The scores are individually useful for directing action at the functional and product line
management levels and for aggregating resources to be used at the margin (e.g., funding the
highest priority maintenance repair – perhaps from a redlined ship – or sending a sailor to a
training course). Separate performance indicators can result in sub-optimal behavior. The
indicators defining a plane of the cube can meaningfully drive actions, but aggregation across the
third dimension is problematic.
To get a clear understanding of overall “effectiveness” at the SWE level (readiness)
requires leaders to interpret the scores, reading written documentation supporting the scores and
asking questions when necessary. A clear understanding of effectiveness at the mission level –
the effectiveness of the ship in performing the mission, is out of the scope of the SWE’s
measurement system. However, leaders receive information that can be fed back into their
system about strengths and weaknesses in their preparation of a specific ship for combat
operations. This represents an area for future work in improving SWE efforts.
Costs and Budgets
Most organizations struggle to accurately capture costs of inputs and relate them to
outputs and outcomes. Even more difficult is integrating performance information into the
budget process (Havens H. , 1983); the SWE is no exception. As Schick (2008, p. 5) notes, “to
operate a true performance-based budget, government needs capacity to allocate costs among the
units of outputs or outcomes produced.” The SWE has yet to make the leap from its longstanding
encumbrance-based budgeting and accounting systems to a system of cost accounting that will
provide adequate performance-based cost information. Their leaders’ attempts illustrate the
difficulty of adapting performance-based budgeting to a government organization.
Historically, the surface force’s primary financial concerns were to estimate the scope of
appropriations needed to operate and maintain the fleet and to control that budget authority to
maximize readiness and remain within legal bounds. Navy leaders felt pressure to obtain more
financial resources to provide more service and modified annual budgets incrementally. To this
day, “cost” is used synonymously with the terms, “obligation” and “spending.” The prevailing
belief has been that the more one spent, the more something cost; such beliefs drive analysis and
information gathering today.
The SWE – the navy at large, even – does not have a cost accounting system of the type
managerial accountants in the private sector might expect to find in a large organization. The
systems that exist support the appropriation-based fiduciary responsibility of managers, and data
are largely limited to obligations on objects of expense by organizational units within fiscal
years. The navy does not well link data to processes or outputs, and although other information
systems exist to support processes that consume financial resources, the systems were designed
for other purposes. For example, maintenance systems manage repair tasks, but only loosely
identify the costs of those tasks. The cost of repair parts may be linked, but the cost of labor,
indirect materials, and allocated overhead are not. Training systems monitor accomplishments
and plans for training events, but not the costs of those events. Thus, “cost” data for analysis
consist of obligations of appropriations, (which frequently precede the consumption of that item
if there is an extended procurement lead time or shelf time) that can reasonably be tied to a
particular process; they are gathered from disparate systems with full recognition that the data
are incomplete and often inaccurate.
Cost analysis in practice in the SWE falls into five types. In the first type, analysts mine
data to determine what is being purchased and to assess whether those purchases could be
reduced. Such studies have shown that grey paint is the single most frequently purchased item
and has led the SWE to examine lower-cost alternatives to traditional paint. The frequency of
purchase of particular repair parts is shared with the engineering support command to see if
re-engineering the component is cost-effective. These analyses support idiosyncratic technical
efficiency efforts, but do not support attempts to allocate efficiently.
Second, spending by ships of the same class (frigates, cruisers) is compared based on
homeport, or whether they are assigned to the Atlantic or Pacific force. Such comparisons may
yield information about differing regional maintenance or training practices, which can be
helpful management information. Often, however, such comparisons often lead to less
productive discussions of fairness and equity in the distribution of resources.
In the third type of cost analysis, the SWE has built a system of “bridgeplots” in navy
parlance, or what might be called “dashboards.” Analysts chart cumulative year-to-date spending
against rolling averages of performance. The mismatched time scales are difficult to interpret and
spending starts at zero at the change of fiscal year. Managers who have historically cared more
about managing appropriations than cost understand the spending plot; however, it is literally
impossible to see the relationship between spending and performance variables from this
depiction.
In the fourth type of cost analysis, the SWE uses the stoplight coding schema for
readiness indicators and attempts to compute the cost to move a ship from one (stoplight) status
to the next. SWE leaders intend to allocate funds to gain maximum benefit in terms of readiness.
Two problems exist with this analysis. First, given the limitations of the accounting systems and
knowledge of causal relationships, leaders have little confidence in the amount needed to move a
ship from one level to the next. Second, even if analysts well understand costs, the stoplight
system encourages suboptimal decision-making as resources tend to flow to the ships just below
a threshold to give the appearance of progress, even if there are more important problems on
other ships.
Finally, and most relevant to our case study, analysts assign spending to missions in an
attempt to understand or manage the cost of the missions. This is an admirable attempt to link
cost to readiness, but there are problems with the method. For instance, the mobility mission (the
ability of the ship to simply move from one location to another) accounts for nearly half of the
funds spent. Mobility missions include things such as propulsion and electricity generation,
fundamental to all other missions. Thus, it should be viewed not as a “product center,” but a
“cost center,” providing basic services to other missions whose cost should be allocated to those
other missions on some logical basis. As noted previously, the system assigns a cost when
something is requisitioned, not consumed. Two significant factors affecting readiness, capital
improvements to ships and the salaries of the sailors on the ships, are not included in the SWE’s
cost assignments because the surface force does not control those funding lines. As is often the
case in the public sector, control of financial resources is a significant source of institutional
power and managers share information reluctantly (Salancik, 2003). Finally, the ability to link
“cost” to an activity is greatly hampered, especially when processes are continuous but analysts
view the SWEs costs on a fiscal quarter or year basis.
5. Implementation issues and recommendations
As our case study describes, the PESTO pillars are interdependent and cannot be
aggregated, and SWE analysts have difficulty measuring their costs. Navy leaders are currently
struggling with how to better manage their resources, but are only beginning to associate the true
costs of inputs with readiness in a PESTO category. They have better success in using the
measures to make marginal decisions about the allocation of resources – where to spend the next
$100,000 on maintenance actions, for example.
Where navy personnel must next focus their efforts is better tying costs of inputs used to
readiness. Navy leaders must have a clear understanding of the difference between budget
authority and the cost of inputs, and must drive personnel to discover better data. The Navy
Enterprise’s Resource Planning (ERP) system, under development, will contain and coordinate
resources, information and activities needed for organization processes. The ERP will include
activity based costing (ABC) where appropriate, allowing the SWE to better track multiple
budget categories that fund inputs used in the production of multiple “outputs.” SURFOR and
SWE leaders would do well to help the ERP process move forward quickly, as it will help them
more accurately track their processes, use of resources and their costs, and provide efficiency
measures. Using the ERP system will also allow the SWE to capture the costs of inputs not
contained in their own budgets; those items that are now considered “free.”
Having tangible information on unit costs and the ability to track expenditures by output
will allow navy leaders to test and understand their assumption that an increase in spending
equates to an increase in output. Without robust accounting systems, SWE leaders cannot assess
whether increased output came from a change in the prices of inputs, substitution of inputs,
improvements in technology, better training or other productivity effects. In addition, using
budget authority data provides insight on the relationship among inputs and outputs only in the
unusual case where budget authority lines up with inputs purchased and consumed to produce the
outputs.
We also note that an improvement in efficiency does not, as navy leaders want to believe,
necessarily lead to improved effectiveness. Factors beyond ship readiness affect the ultimate
outcome of the mission assigned to a naval warship. Even if SWE leaders have the ability to
move funds from efficient organizations to processes or organizations that need additional
resources, there is no guarantee that improved readiness increases mission effectiveness. Again,
without data showing connections from input costs to outputs, SWE leaders will have difficulty
knowing where efficiencies are, much less reallocating funds to generate greater readiness. Well
managing the processes that produce outputs does not ensure the attainment or improvement of
outcomes.
In sum, output indicators generated by PESTO certainly indicate some part of
performance, or the necessary stage of ship readiness before deployment. As such, they are
extremely useful to the internal management team of the SWE. However, without being able to
assign costs to outputs, the navy has no possibility, except at the most rudimentary, macro level,
to connect costs to outcomes. Senior defense leaders must change their expectations about the
system limits. They must understand that the system can only help inform performance
managers, and cannot directly drive budgeting decisions in the Pentagon.
Budgeting for Readiness
Given Schick’s (2007, p. 16) belief that “[p]ublic organizations would do well to deploy
performance budgeting as an analytic tool because few have the capacity to ground budget
decisions on it,” we recommend SWE leaders think about how to provide information to help
budgeters use their performance information. To answer the question, “how much ship readiness
does a certain amount of funding provide?” budgeters need aggregated cost data, representing all
actions taken across the entire cube in Figure 1. Without robust accounting systems, SWE
leaders cannot hope to calculate something approximating total costs of readiness. Further,
disparate activities are considered jointly in the defense budget, which lists “mission and ship
operations” as one budget line, described by objects of expense (e.g., travel, supplies, and
salaries). Even if the performance management system could provide cost figures for each of the
PESTO indicators, PESTO readiness indicators are proxy measures and cannot meaningfully be
aggregated and tied to budget authority. Thus, PESTO data provided to headquarters cannot
fully inform complex decisions on budget trade-offs.
Further complicating the connection between budgets and performance is that budgeting
operates on a strict timeline while program performance tends to be continual or occurs in cycles
distinct from the budget. Defense budgeting is unusually complex. At any moment four or more
cycles occur simultaneously: one budget is being executed as the next is being enacted, a third is
being formulated, and the requirements for a fourth are under study. Meanwhile, the activities of
outfitting, deploying, maintaining, and training occur throughout the navy. Even with robust
accounting systems, establishing the link between the readiness of the ships (or simply the
consumption of inputs to prepare the ship) and a specific year’s budget is empirically complex.
What expenditures lead to a particular ship being ready for a particular mission? The spare parts
in the ship’s storeroom may have been purchased days or years ago. The training of the sailors
may have occurred weeks or months ago. The collective experience of the captain and crew, not
to mention the ship itself, may be two decades old. To which budget cycle or to which fiscal
year’s level of funding does one ascribe a requirement for funds to purchase a set of inputs that
will be used immediately, later, or perhaps never? That is a cost allocation problem that has not
been considered by the SWE given the quality of data and lack of accounting skill among ship
captains.
Proximity of analysts and lack of commonality in purpose make the performance
management to performance budgeting link even more problematic. The broader Department of
the Navy budget is formulated in the Pentagon, away from the surface force, by analysts and
budgeters who do not and cannot process the detailed information contained in the performance
management system. Budgeters and program managers use different data to support decisions
made for different purposes (Havens H. , 1983). Program analysts who determine desired future
budget levels and types of activities take a more strategic view of the SWE than current
operators. If program analysts foresee a future different from the past then even optimal data
provided by the fleet may not help determine future budgeting requirements.
Budgeters also focus on appropriation structure and categories of expense defined by the
legislature to serve political and oversight goals, not navy management goals. If budgeters
weigh the need for submarines and aircraft against the need for surface ships, no common basis
for comparison exists. Thus, the best performance management system with robust accounting
systems cannot drive budgets because the responsibility and accountability for determining the
amount of budget authority is conceptually distinct and organizationally disjointed from the
performance management system.
Conclusions
From our analysis of the SWE’s attempts to link cost to performance, we find a good
conceptual framework, organizational enthusiasm, and reasonable attempts to link disparate
information systems into a coherent whole. The good intentions are retarded by inadequate
accounting systems, a lack of understanding of cost accounting methods, weak use of
terminology and longstanding institutional attitudes. In the end, most of the cost analysis simply
justifies the budget number in an inherently political process, which, for the short term, may be
good enough to buy the organization time to improve their practices. We commend the SWE for
attempting to inform the political process with analysis of the costs of their processes and
products such that they might be better stewards and can eventually achieve more “bang for the
buck.” Given the absence of even rudimentary cost accounting systems, they unfortunately
expose themselves to the risk that incomplete and inaccurate data will result in suboptimal
decisions. The extent of that risk, we believe, is not well understood by the SWE. The transaction
costs associated with managing the current system are also not captured so some may question
the wisdom of their actions. In our view, the incremental shift in attitudes and beliefs are perhaps
more valuable than anything at this stage. As consciousness rises regarding the cost implications
of their actions, and as senior managers and their staffs become more fluent in the concepts of
and more adept at cost accounting, better stewardship and decisions should result. As the desire
to have better data increases, we hope pressure will mount to improve the underlying accounting
systems such that they will eventually generate those data, reduce the risk and improve decision
making.
References
Brown, R. M. (1999). Activity-basec costing in government: Possibilities and pifalls. Public Budgeting & Finance 19(2) , 3-21.
Casey, W. P. (2008). Are we driving strategic results or metric mania? Evaluating performance in the public sector. International Public Managmenet Review, 9(2) , 90-106.
Congressional Budget Office. (1993). Using performance measures in the federal budget process. Washington, DC: Government Printing Office.
Euske, K. J. (1999). Applying activity-based performance measures to service processees: Process relationship maps and process analysis. Inetrnational Journal of Strategic Cost Management , 3-16.
Frumpkin, P. &. (2004). Institutional Isomorphism and Public Sector Organizations. Journal of Public Administration Research and Theory , 14 (3), 283-307.
Grizzle, G. A. (1987). Linking Performance to Funding Decisions: What is the Budgeter's Role? Public Productivity and Management Review , 41, 33-44.
Hackbart, M. M. (1999). Performance Budgeting and Performance Funding in the States: A States Assessment. Public Budgeting & Finance , 19 (1), 68-88.
Hatry, H. (2001). What types of performance information should be tracked? In D. Forsythe, Quicker, Better, Cheaper?: managing performance in American government (pp. 17-34). Albany, NY: Rockefeller Institute.
Havens, H. (1983). A public accounting: Integrating evaluation and budgeting. Public Budgeting & Finance , 102-113.
HM Treasury. (2001). Choosing the right fabrice: A framework for performance information. London: HM Treasury.
Joyce, P. G. (2003). Linking Performance and Budgeting: Opportunities in the Federal Budget Process. Washington, DC: IBM Center for the Business of Government.
Joyce, P. (1993). Using performance measures in the federal budget process: Proposals and prospects. Public Budgeting & Finance 13(4) , 3-17.
Keeney, R. &. (2005). Selecting Attributes to Measure the Achievement of Objectives. Operations Research, 53(1) , 1-11.
Lu, H. (1998). Performance budgeting resuscitated: why is it still inviable? Journal of Public Budgeting, Accounting & financial Management, 10(2) , 151-172.
McCaffery, L. J. (2002). Assessing Options fo Changing the Federal Government Budget Process. Public Finance and Management , 2 (3), 436-469.
McNab, R. &. (2003). Implementing the GPRA: Examining the prospects for performance budgeting in the federal government. Public Budgeting and Finance , 73-95. Mullins, D. &. (1999). Is Activity-Based Costing up to the challeng when it comes to
privaization of local government services? Public Budgeting & Finance 19(2) , 37-58. Niskanen, W. A. (1971). Bureaucracy and Representative Government. Chicago:
Aldine-Atherton.
Robinson, M. (2007). Performance Budgeting Models and Mechanisms. In M. E. Robinson, & M. Robinson (Ed.), Performance Budgeting: Linking Funding and Results (pp. 1-21). New York: International Monetary Fund.
Salancik, J. P. (2003). The External Control of Organizations: A Resource Dependence Perspective. Stanford, CA: Stanford University Press.
Schick, A. (2001). Does budgeting have a future? OECD Public Management Service , 3-10.
Schick, A. (2008). Getting Performance Budgeting to Perform. Retrieved January 2008, 8, from World Bank:
http://siteresources.worldbank.org/MEXICOEXTN/Resources/ConceptPaperAllenSchick Final.pdf
Schick, A. (2007). Performance Budgeting and Accrual Budgeting: Decision Rules or Analytic Tools? OECD Journal on Budgeting, 7(2) , 109-138.
Williams, C. &. (1999). Is ABCM destined for success or failure in the federal government? Public Budgeting & Finance , 22-36.
Willoughby, J. M. (1998). The State of the States: Performance-Based Budgeting Requirements in 47 Out of 50. Public Administration Review , 58 (1), 66-73.
28
1
We use “efficiency” and “effectiveness” as the public administration literature does. (See, for example, (HM Treasury, 2001).)
2 Senior managers within the SWE would argue they do have a single measure – warships ready for
tasking. We argue that is not a measure so much as it is a value judgment based on the information in the PESTO measures. “Warships ready for tasking” also serves the SWE as an organizing mission statement.
3