An Effective Approach of Negative Selection Algorithm
with Canny Algorithm for Detection of Edges
Manpreet Kaur
CSE, Chandigarh University, Gharuan(Mohali)
Spardha
CSE, Chandigarh University, Gharuan(Mohali)
ABSTRACT
Edge detection plays inevitable role in vision processing. The main issues are to discover edges in an image, so the initial step is to procedure of view reproduction. It has been shown in many papers that the most of the existing techniques has neglected the use of colours while detecting the edges but in many applications a region can be categorized based upon the colour. This paper has shown the result of different colour based edge detectors i.e. hue, PCA and integrated Hue and PCA based methods. I have used NSA technique with canny edge detection which gives far better results than the existing technique.
General Terms
Edge detection, PCA, Hue, Morphological operations, NSA, Canny edge detection.
1.
INTRODUCTION
The issue is to discover edges in the image, as an initial phase at the present time scene remaking. The edges might be utilized subsequently for division of the picture into items. The most basic edge identification is possible by utilizing edges: pixels with ash level over some limit are considered to be in one gathering and the various pixels in the second. The edges ought to show up when you cross the fringe between the gatherings. This system works in exceptionally basic spaces, yet in no way, shape or form can serve as an edge finder in this present reality. Image Segmentations used to split the regions into small set of pixels[1][2][3].
An edge in an image is a limit or shape at which a huge change happens in some physical part of aimage. Changes in physical angles show themselves in a mixture of ways, incorporating changes in power, color, and surface, distinguishing edges is exceptionally helpful in a no of settings.. In digital image processing edge detection is the most common technique and it is used very rapidly [3].
2.
PROPOSED ALGORITHM
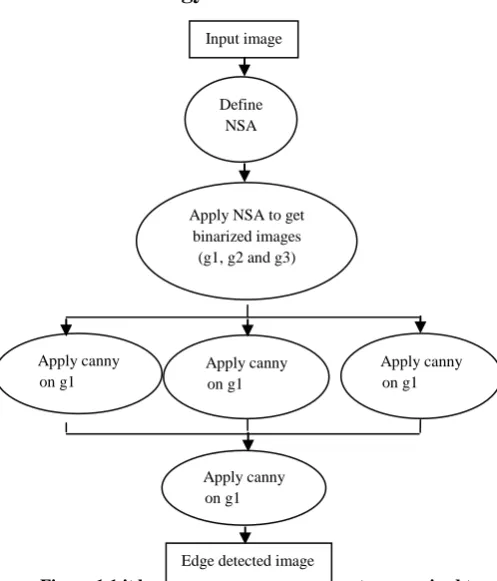
In the proposed algorithm, i have used NSA and canny edge detection algorithm for the detection of the edges. In the methodology it involves several steps.
Step 1: Input the image.
Step 2: Select the pixels from the image with NSA which are major for the edge detection.
Ste 3: Apply Canny edge detection on the detected pixels to get the better results.
[image:1.595.298.547.183.474.2]2.1
Methodology
Figure 1.1 it has been shown the various steps required to accomplish this research work
2.2
Negative Selection Algorithm
My work is based on the first method which is Negative Immune System (NSA), the processing of the NSA is aligned on the negative selection mechanism. In the negative selection mechanism it protects the body against self-reactive lymphocytes, which means it detects unknown antigens without reacting to its own cells. This method is most popular model nowadays from the other methods of AIS for the development. The calculation creates a set of detectors by evacuating any identifier candidate that match components from a group of self-samples [4].
NSA characterize self as a typical pattern of action or stable conduct of a framework/process
2.2.1
A gathering of intelligently split segments (equal-size) of pattern grouping.2.2.2
Represent the gathering as a multiset S of strings of length l over a limited letter set.2.2.3
Generate a set R of detectors.With these steps main pixels can be collected for the further processing.
Input image
Define NSA
Apply NSA to get binarized images (g1, g2 and g3)
Apply canny on g1
Apply canny on g1
Apply canny on g1
Apply canny on g1
3.
CANNY EDGE DETECTION
ALGORITHM
The Canny edge discovery algorithm is referred to a lot of people as the ideal edge detector. Canny's expectations were to improve the numerous edge detectors effectively out at the time he began his work. In this algorithm following arrangement of criteria is used to enhance current routines for edge location [5].
[image:2.595.54.254.364.429.2]Step 1:- so as to implement the canny edge detector algorithm, an arrangement of steps must be followed. The principal step is to channel out any noise in the original image before attempting to place and discover any edges. Also on the grounds that the Gaussian channel could be processed utilizing a straightforward mask, it is utilized only as a part of the Canny algorithm. When a suitable mask has been computed, the Gaussian smoothing might be performed utilizing standard convolution routines. A convolution mask is generally much more diminutive than the real image. Subsequently, the mask is slid over the image, controlling a square of pixels at once. The bigger the width of the Gaussian mask, the lower is the detector's affectability to noise. The confinement error in the caught edges additionally expands somewhat as the Gaussian width is expanded [6]. The Gaussian mask utilized within my implementation is appeared. Figure 1.2 shows the approximation to the Gaussian function.
Figure 1.2 Discrete Approximation to Gaussian function with σ=1.4
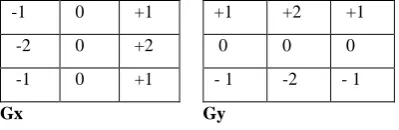
[image:2.595.93.223.570.664.2]Step 2:- In the wake of smoothing the image and disposing of the noise, the next step is to discover the edge quality by taking the gradient of the image. The Sobel operator performs a 2-D spatial gradient estimation on an image. At that point, the approximate absolute gradient magnitude (edge quality) at each one point might be found. The Sobel operator utilizes a couple of 3x3 convolution masks which is shown in the Figure 1.3 one evaluating the gradient in the x-direction (segments) and the other assessing the gradient in the y-direction (rows).
Figure 1.3 Comparison of couple matrix
The magnitude, or edge strength, of the gradient is then approximated by using the following formula which is equation 1.1
|G| = |Gx| + |Gy| ………(1.1)
Step 3:- The direction of the edge is figured utilizing the gradient as a part of the x and y directions. Be that as it may, an error will be generated when sum x is equivalent to zero.
So in the code there must be a limitation set at whatever point this takes place. At whatever point the gradient in the x direction is equivalent to zero, the edge direction must be equivalent to 90 degrees or 0 degrees, contingent upon what the estimation of the gradient in the y-direction is equivalent to. In the event that GY has an estimation of zero, the edge direction will square with 0 degrees. Overall the edge direction will rise to 90 degrees. The formula for discovering the edge direction is just which is written as equation 1.2.
ϴ= invtan (Gy/ Gx) ……….….(1.2)
Step 4:- Once the edge direction is known, the next step is to relate the edge direction to a direction that could be followed in an image.
Step 5:- After the edge directions are known, nonmaximum concealment now must be connected. Nonmaximum concealment is utilized to follow along the edge in the edge direction and smother any pixel worth (sets it equivalent to 0) that is not considered to be an edge. This will give a meager line in the yield image [6].
Step 6:- Finally, hysteresis is utilized as a method for wiping out streaking. Streaking is the separating of an edge shape created by the operator yield fluctuating above and below the threshold. On the off chance that a solitary threshold, T1 is connected to an image, and an edge has a normal quality equivalent to T1, then because of noise, there will be examples where the edge dips below the threshold. Equally it will additionally extend over the threshold making an edge resemble a dashed line. To evade this, hysteresis utilizes 2 thresholds, a high and a low. Any pixel in the image that has a quality more prominent than T1 is attempted to be an edge pixel, and is checked accordingly immediately. At that point, any pixels that is associated with this edge pixel and that have a worth more prominent than T2 are likewise chosen as edge pixels. On the off chance that you consider following an edge, you require a gradient of T2 to begin yet you don't stop till you hit a gradient below T1 [6].
4.
SIMULATIONS REULTS AND
STORIES
The hue, PCA, integrated PCA and hue and the negative selection based edge detectors has been designed and implemented using MATLAB. Different images are taken for experimental purpose the results has shown that the negative selection based edge detectors has more efficient results over the available techniques. Subsequent section contains the result of designed and implemented algorithms. My work includes some parameters to calculate the performance[7][8][9]. There are four main parameters which is used for this process. These parameters are defined as of the followings one by one[10][11]. These parameters are:
Pratt Figure Of Merit (PFOM)
Mean Square Error (MSE)
Peak Signal to Noise Ratio (PSNR)
Root Mean Square Error (RMS)
These are defined as of the followings with the results.
4.1
Performance Analysis with PFOM
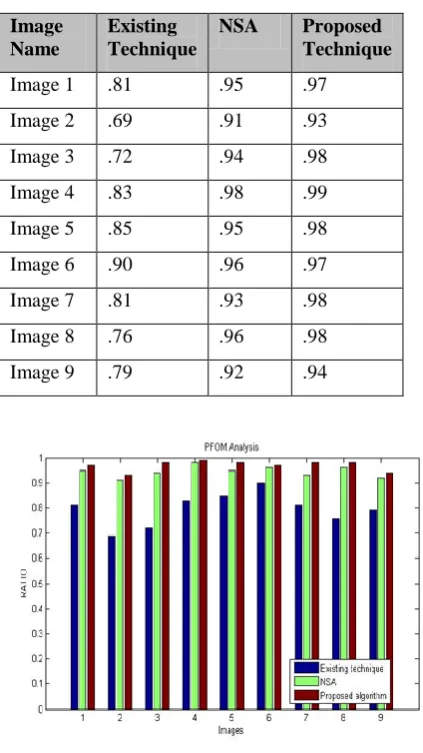
Table 1.1 has shown the result of PFOM of the existing and the proposed technique. It has been clearly shown that the PFOM of the proposed technique is better in every situation. In this manner the proposed algorithm has demonstrated
-1 0 +1
-2 0 +2
-1 0 +1
Gx
+1 +2 +1
0 0 0
- 1 -2 - 1
Gy
1/115*
2 4 5 4 2
4 9 12 9 4
5 12 15 12 5
4 9 12 9 4
noteworthy change over the accessible procedures. Figure 1.4 has shown the result of PFOM of the existing and the proposed technique. It has been clearly shown that the PFOM of the proposed technique is better in every case.
Table 1.1 PFOM comparative analysis
Figure 1.4 PFOM comparative analysis
4.2 Mean Square Error Evaluation
Table 1.2 is indicating the quantized analysis of the mean square error. As mean square error need to be decreased in this manner the proposed algorithm is indicating the preferred comes about over the accessible routines as mean square error is less in every case. Figure 1.5 has demonstrated the quantized analysis of the mean square error of distinctive images. It is very clear from the plot that there is lessening in MSE estimation of images with the utilization of proposed system over different techniques. In the following table appropriate values are collected and calculated in terms of mean square error evaluation. Further the graph shows the MSE analysis and shows the variations of all the selected values. These experiments are done on the different ten images which gave some results with variation. These give results that NSA performs very good results than the other existing traditional techniques. Further other terms are also calculated on these different images. These are as of the following:
[image:3.595.315.547.87.513.2]\
[image:3.595.49.261.140.517.2]Table 1.2 Mean Square Error Evaluation
Figure 1.5 Mean Square Error Evaluation
4.3 Peak Signal to Noise Ratio Evaluation
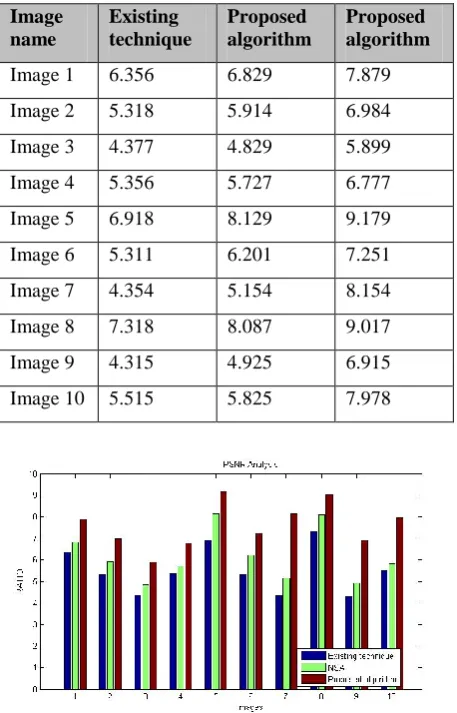
Table 1.3 is indicating the near analysis of the Peak Signal to Noise Ratio (PSNR). As PSNR need to be maximized; so the principle objective is to build the PSNR however much as could be expected [12][13]. Table 1.3 has clearly demonstrated that the PSNR is maximum on account of the proposed algorithm along these lines proposed algorithm is giving preferred comes about over the accessible systems. Figure 1.6 has demonstrated the quantized analysis of the crest signal to noise ratio of diverse images utilizing proposed and existing edge location method. It is very clear from the plot that there is built in PSNR estimation of images with the utilization of proposed system over different techniques. In this peak signal to noise ratio evaluation is calculated which is in the decimal form. The results are calculated in the following table which shows the variation in the different images. Further, the graph represents the analysis of PSNR as of the below with the following results with the variations in existing, NSA and proposed technique on the same images for the results.
Image Name
Existing Technique
NSA Proposed Technique
Image 1 .81 .95 .97
Image 2 .69 .91 .93
Image 3 .72 .94 .98
Image 4 .83 .98 .99
Image 5 .85 .95 .98
Image 6 .90 .96 .97
Image 7 .81 .93 .98
Image 8 .76 .96 .98
Image 9 .79 .92 .94
Image name
Existing technique
NSA Proposed
algorithm
Image 1 16356 16056 15056
Image 2 12318 12118 11118
Image 3 13317 12217 11217
Image 4 14356 13356 12356
Image 5 16318 15319 14319
Image 6 15311 14314 11314
Image 7 14354 13344 11344
Image 8 12318 12018 11018
Image 9 11315 11225 10225
Table 1.3 Peak Signal to Noise Ratio Evaluation
Image name
Existing technique
Proposed algorithm
Proposed algorithm
Image 1 6.356 6.829 7.879
Image 2 5.318 5.914 6.984
Image 3 4.377 4.829 5.899
Image 4 5.356 5.727 6.777
Image 5 6.918 8.129 9.179
Image 6 5.311 6.201 7.251
Image 7 4.354 5.154 8.154
Image 8 7.318 8.087 9.017
Image 9 4.315 4.925 6.915
[image:4.595.313.543.87.456.2]Image 10 5.515 5.825 7.978
Figure 1.6 Peak Signal to Noise Ratio Evaluation
4.4 Bit error rate
[image:4.595.49.278.88.445.2]Table 1.4 is demonstrating the quantized analysis of the bit error rate. As bit error rate need to be decreased thusly the proposed algorithm is demonstrating the preferable comes about over the accessible routines as mean square error is less in every case. Figure 1.7 has indicated the quantized analysis of the bit error rate of distinctive images. It is very clear from the plot that there is lessening in bit error rate estimation of images with the utilization of proposed system over different systems. In this bit error rate technique is used on the different images and the results are in very small numbers. With this parameter the graph shows huge variation than the other techniques as shown in the Figure 1.7 .The BER analysis shows that the result shows much difference on the second and on the seventh image as clearly shown in the graph. This is the third parameter in parameter analysis of the coding. Proposed algorithm shows much better results in some cases in this parameter as clearly defined in the table and in the figure. In the graph the blue one shows the results of existing technique, the green one shows the values of NSA and the last one brown shows the proposed work results.
Table 1.4 Bit error rate Evaluation
Image name
Existing technique
NSA Proposed algorithm
Image 1 .0656 .0156 .0106
Image 2 .2318 .1318 .1118
Image 3 .1317 .1017 .1001
Image 4 .1356 .1126 .1121
Image 5 .1318 .1018 .0011
Image 6 .1511 .1091 .0191
Image 7 .0054 .0014 .0011
Image 8 .0345 .0101 .0087
Image 9 .0478 .0278 .0188
Image 10 .1120 .0020 .0011
Figure 1.7 Bit error rate Evaluation
[image:4.595.47.278.89.450.2]Figure 1.5 Input Image
Figure 1.6 Hue Image
Figure 1.7 Hue edge image
Figure 1.8 PCA image
Figure 1.9 PCA edge image
Figure 1.10 Base paper image
In these figures the result of the initial techniques are used. In Figure 1.5 the input image is shown, in Figure 1.6 Hue technique is applied to the
input image and then edged detected image is shown in the Figure 1.7. Further PCA technique is used on the inputted image and the result is shown in Figure 1.8. After this edges are detected through PCA technique which is shown in the Figure 1.9. With the fusion of these techniques my base paper results are shown.
Figure 1.11 NSA based edge
Figure 1.12 Final edge
These figures shows the result of my proposed work. In Figure 1.11 result of Negative Selection Algorithm (NSA) is shown and with the fusion of canny algorithm final edge is detected which is shown in Figure 1.12.
Figure 1.13 Base paper final image
Figure 1.14 Final edge
5.
CONCLUSION AND FUTURE WORK
In my research work I have gone through some papers and then I have done my work. During my work I have concluded some points which are as of the following:
6.
CONCLUSION
In this paper the problem is to discover and locate edges in the image, which is the first step in the process of scene reconstruction. This paper has evaluated the performance of different color based edge detection techniques.
This paper has shown the result of different color based edge detectors i.e. hue, PCA and integrated Hue and PCA based. This work has proved that when edge detection is done by using negative selection gives about more accurate results and it outperforms over the available techniques. Negative Selection algorithm detects all the useful pixels which can used to detect the exact edges of the image. This method is best for the edge detection technique with canny edge detection method, which is applied on the pixels which are detected by the negative selection algorithm. The gist of the content is that these both techniques give best results from the traditional techniques. Because of its speed this technique has been neglected from the researchers. This uses the process of human immune system so this technique is easy to understand.
7.
FUTURE WORK
As the Artificial Immune System has been neglected from the researchers from long time. There are some techniques which are based on the AIS. These techniques has been neglected by the researchers because this algorithm is little bit slower than the present other techniques, which will be reduced in the future time. The other technique comes under artificial immune system and this type of Human Visual System. The name of technique is SITO. The existing technique is little bit slower so this disadvantage can be removed by this technique. By the SITO techniques edges can be shown much clearer than the other techniques. Social Impact Theory Optimization (SITO) is an artificial natural theory which can be applied easily to the images and edges can be shown clearer and more visible. In future if the negative selection algorithm has to be replaced, it can be replaced by the SITO technique which is also a natural technique of Artificial Immune System. By the process of SITO some research has been done, which give better results.
8.
REFERENCES
[1] Orlando J. Tobias and RuiSeara, “Image Segmentation by Histogram Thresholding Using Fuzzy Sets”, IEEE Transactions on Image Processing, Vol.11, No. 12, 2002, PP. 1475-1465.
[2] M. Abdulghafour, “Image Segmentation using Fuzzy Logic and genetic algorithms:,Journal of WSCG, vol. 11, No. 1, 2003.
[3] N. Senthikumaran and R. Rajesh, “Edge Detection Techniques for Image Segmentation – A Survey”, Proceedings of the International Conference on Managing Next Generation Software Applications (MMGSA-08), 2008, pp. 749-760.
[4] Forrest, S.; Perelson, A.S.; Allen, L.; Cherukuri, R. (1994). "Proceedings of the Symposium on Research in Security and Privacy," Los Alamitos, CA. Page(s): 202– 212, IEEE (1994).
[5] Canny, J., “A Computational Approach to Edge Detection,” IEEE Trans. Pattern Analysis and Machine Intelligence, 8(6):679-698, 1986.
[6] R. Deriche, “Using Canny's criteria to derive a recursively implemented optimal edge detector, Int. J. Computer Vision,” Vol. 1, Page(s): 167–187, April 1987.
[7] I. E. Abdou and W. Pratt, “Quantitative design and evaluation of enhancement/thresholding edge detectors,” in Proceedings of the IEEE, vol. 67, no. 5, 1979, Page(s): 753–766.
[8] Lehmann, E. L.; Casella, George (1998). “Theory of Point Estimation,” (2nd ed.). New York: Springer. ISBN 0-387-98502-6. MR 1639875.
[9] Huynh-Thu, Q.; Ghanbari, M. (2008). "Scope of validity of PSNR in image/video quality assessment," Electronics Letters 44 (13): 800. doi:10.1049/el:20080522.
[10] Hyndman, Rob J. Koehler, Anne B. (2006). "Another look at measures of forecast accuracy," International Journal of Forecasting 22 (4), Page(s): 679– 688. doi:10.1016/j.ijforecast.2006.03.001
[11]H. Talbi, M. Batouche and A. Draa, “A Quantum - Inspired Evolutionary Algorithm for Multiobjective Image Segmentation,” International Journal of Mathematical, Physical and Engineering Sciences, Vol.1 No.2, Page(s): 109-114, 2007.
[12]Edge Detection,” IEEE Transactions on Consumer Electronics, vol. 45, 1999.