Munich Personal RePEc Archive
Germany’s Wind Energy: The Potential
for Fossil Capacity Replacement and
Cost Saving
Weigt, Hannes
September 2008
E
lectricity Markets Working Papers
WP-EM-29
Germany’s Wind Energy:
The Potential for Fossil Capacity Replacement
and Cost Saving
Hannes Weigt
September 2008
Dresden University of Technology Chair for Energy Economics and
Germany’s Wind Energy: The Potential for Fossil Capacity
Replacement and Cost Saving
Hannes Weigt
Corresponding author:
Hannes Weigt
Dresden University of Technology
Faculty of Business and Economics
Chair of Energy Economics and Public Sector Management
01069 Dresden, Germany
Phone: +49-(0)351-463-39764
Fax: +49-(0)351-463-39763
Abstract:
Wind energy has become the major renewable energy source in Germany with an installed capacity of
more than 20 GW and an annual output of about 40 TWh in 2007. In this paper we analyze the extent
to which wind energy can replace fossil capacities based on wind injection and demand data for 2006
through June 2008. The results indicate that the wind potential in Germany will not allow a significant
reduction of fossil capacities. We also assess the potential savings due to wind energy. The German
market is modeled with and without wind input to estimate the net savings of fossil fuels in the
observation period. We find that the cost-saving potential for electricity production is quite significant
in the study period and exceeds the subsidies.
Key words: electricity, wind energy, reserve, cost saving, Germany
1
Introduction
The fostering of renewable energy sources in electricity markets has led to significant utilization of
wind energy. In Europe about 56 GW of wind was installed by the end of 2007, doubling the capacity
within the last 5 years (EWEA, 2008). Germany in particular has seen a sharp rise in the use of wind.
However, the European grid, which was never designed to cope with large-scale fluctuations in
generation, now requires extensive upgrading, e.g., major investments in transmission (see Dena,
2005).
Germany’s Transmission System Operators (TSOs) are obligated to publish hourly projected wind
generation. Therefore, since late 2005 an adequate database exists that allows researchers to conduct
empirical analyses of recent developments. Since wind energy is “free”, each MWh that replaces fossil
energy saves on fuel costs. Yet obstacles exist that limit wind’s utilization with respect to reserve
capacity, operational back-up, wind speed forecasts, planning/siting offshore parks, network
extensions, voltage and reactive power support, and impacts upon emissions and market prices. This
paper focuses on reserve capacity and wind’s impact upon generation costs and market prices.
The issue of reserve capacity can be divided into short- and long-term analyses.
In the short-term actual dispatch and management of fluctuating output in a given market environment
is studied, including network and generation issues. Østergaard (2002) analyzes the impact of
renewable energy production for Denmark’s transmission grid in 2020. He shows that unless a
geographically scattered balancing mechanism is applied, the network needs reinforcement to cope
with transmission demand. Lund and Münster (2003) analyze the management of surplus energy from
fluctuating sources in Denmark, and conclude that additional network investments can be avoided by
adapting the generation side and building a more flexible energy system including heat pumps,
storage, and the regulation of CHP plants. Lund (2005) extends the analysis by looking at integrating
large-scale wind energy outputs into different energy and regulatory systems. The systems include
large CHP shares, electrified road transport, and fuel cell technologies. Luickx et al. (2008) take up the
question of operational backup for wind integration. They apply an MILP model to test two methods
for providing backup: a 100% provision of additional spinning reserves and balancing wind with all
other units by the TSO. Whereas both methods show a cost increase due to increased wind power,
none has a clear advantage once the underlying parameters (wind profile, load profile, and installed
capacity) are changed.
In the long-term the impact of wind energy on the optimal power plant mix is analyzed. Since wind
speeds fluctuate over time, installed capacity and actual output can vary quite drastically. Thus a
one-to-one replacement of conventional power plants by wind turbines is improbable. However, it may be
possible that with increased installed capacities in a sufficiently large geographic area, either a
minimum wind output or a secured peak load reduction can be achieved. This gain in capacity
reduction due to additional wind energy is often termed capacity credit. Strbac et al. (2007) analyze
be able to accommodate large increases of wind generation, the actual capacity credit is rather low. To
secure the same level of supply security, large, conventional backup capacities are needed that only
have low load factors, but will likely drive market prices. Further, they note that wind’s capacity
credit drops with the level of penetration. Oswald et al. (2008) analyze whether wind conditions in the
UK provide enough reliable supply. Based on a model of distributed wind generation in the UK they
conclude that the geographically aggregated output flattens the output of wind energy but still retains
significant levels of volatility. Wind output in the hours of peak load can be low and the same is true
for the inclusion of neighboring countries. Power swings may increase the need for conventional
plants to undergo frequent load shifts. Østergaard (2008) analyzes the aggregation of wind turbines in
different regions of Denmark. He concludes that it reduces the need for operational reserve capacity.
However, the same is not true for the maximum capacity reserve needed in the modeled area because
there are times with zero wind output in all regions. Giebel (2005) provides a summary of studies on
wind’s capacity credit. All of the included studies state that wind power indeed has a capacity credit,
but that it strongly depends on the underlying electric system and wind’s load factors and penetration
level. In general, systems with little wind penetration show a higher credit around the mean wind
power output, while for large penetrations the credit drops to 10-15%.
Questions about social costs, cost saving, and external costs also merit attention especially because
most wind energy is subsidized. Two effects of wind energy have an impact on market prices: first, the
replacement of fossil power plant output by wind capacities shifts the demand level to the left and thus
lowers the market prices and the needed generation costs; second, the reduced output of fossil plants
lowers overall emissions and may also lower the allowance price that in turn has a decreasing impact
on market prices. De Miera et al. (2008) analyze the impact of increased wind energy on wholesale
market prices for Spain. By applying a simulation analysis of the dispatch in the Spanish market they
show a negative correlation between wind electricity promotion and wholesale market prices. In their
observation period from 2005 until 2007 average price reductions of 9-25% can be achieved. Bode
(2006) conducts a numerical analysis of the impact of wind generation on German market prices. By
applying different demand curve assumptions as well as different feed-in tariffs he concludes that
wind’s net benefit may be positive or negative. A further analysis of the price-reducing effect of wind
energy has been issued by the German Federal Environment Ministry (Sensfuß et al., 2008). By
applying a detailed market model the authors conclude that the merit order effect of wind generation
led to a price reduction of about 8 €/MWh and total costs saving of about 5 billion € in 2006.
Rathmann (2007) analyzes the impact of wind energy on emission allowance prices and its feedback
on market prices, concluding that in the presence of an emission trading scheme additional wind
generation can reduce allowance prices (and thus electricity prices). For the first trading period
between 2005 and 2007 he estimates a reduction of electricity prices by 6.4 €/MWh for Germany
solely by reduced emission prices not taking into account price impacts due to a changed dispatch.
Compared to the increase in electricity prices of 3.8 €/MWh from the feed-in tariffs, a net benefit of
wind generation is obtained. Rosen et al. (2007) apply long- and short-term models to estimate the
effects of large-scale wind generation in Germany. They show that wind energy substitutes for mainly
base-load capacities like coal and nuclear whereas gas-fired plants are needed to cope with the
fluctuation of wind output. Boccard (2008) estimates the social costs of wind power for countries
including Germany, Denmark, Spain, and Ireland by analyzing their electric systems in a standardized
setting with and without wind input.
The objective of this paper is to analyze the available information regarding wind energy output in
Germany from 2006 until June2008. Given the hourly wind input data two questions are asked.
First, how much fossil capacity can be replaced by the installed wind turbines? Given the high
fluctuation in wind speeds, wind capacities are not dispatchable like conventional power plants.
However, if a large area is covered by wind parks, differences in local wind availability may partly
“flatten” the fluctuation and therefore decrease the need for fossil backup. The question is answered by
analyzing wind and load profiles and assessing the potential for capacity replacement.
Second, how much has the injected wind energy saved in terms of fossil fuel costs? On one hand, wind
energy reduces the load levels of operating plants, saving fuel costs, lowering the demand levels, and
bringing down market prices. On the other, the fluctuating wind input can also increase plant ramp
ups/downs and thus raise generation costs. This question is analyzed using a market model to compare
prices and generation costs of the actual wind and demand levels in the observation period with a
“wind free” case.
The remainder of the paper is structured as follows: Section 2 presents the dataset and the analysis
methodology. Section 3 presents the results for the capacity and cost analysis. Section 4 concludes.
2
Dataset and analysis methodology
2.1 Wind energy output in Germany
To test the availability of wind energy within Germany the hourly wind feed-in during the period from
2006 till summer 2008 is obtained from the four German TSOs. The total output of wind parks was
about 30 TWh in 2006, about 40 TWh in 2007, and about 22 TWh in the first half of 2008. Compared
to the total demand for electricity in Germany of more than 600 TWh wind energy still plays only a
minor role. However, installed wind capacities comprise a large share of the available generation
capacity. During the observation period the installed capacity increased from 18.5 GW to 23.4 GW
putting it on a level playing field with nuclear and coal. To obtain an hourly input in relation to the
available wind capacity the half yearly capacity values published by DEWI are linearly interpolated.
The geographic area covered by wind facilities extends from the North Sea coastline to sites in the
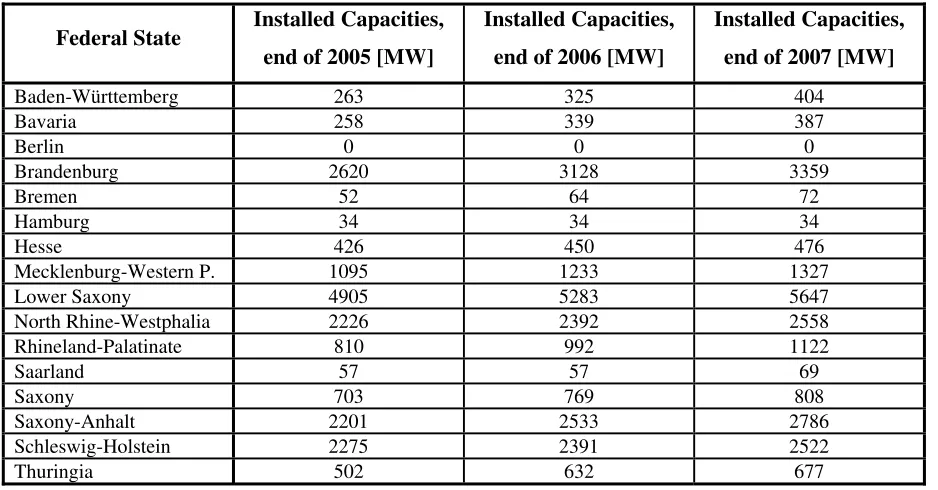
South. Table 1 gives a summary of the installed wind capacities in each federal state. One can observe
The dataset is divided in time-of-day subsets: base (0am-12pm), off-peak (8pm-8am), mid load
[image:7.595.78.547.118.363.2](8am-8pm), noon (11am-1pm), and evening (5pm-7pm).
Table 1: Installed wind capacities in Germany
Federal State Installed Capacities, end of 2005 [MW]
Installed Capacities,
end of 2006 [MW]
Installed Capacities,
end of 2007 [MW]
Baden-Württemberg 263 325 404
Bavaria 258 339 387
Berlin 0 0 0
Brandenburg 2620 3128 3359
Bremen 52 64 72
Hamburg 34 34 34
Hesse 426 450 476
Mecklenburg-Western P. 1095 1233 1327
Lower Saxony 4905 5283 5647
North Rhine-Westphalia 2226 2392 2558
Rhineland-Palatinate 810 992 1122
Saarland 57 57 69
Saxony 703 769 808
Saxony-Anhalt 2201 2533 2786
Schleswig-Holstein 2275 2391 2522
Thuringia 502 632 677
Source: DEWI (2006, 2007, 2008)
2.2 Estimating the capacity credit
Basically, wind energy can reduce the need for fossil capacity within an electricity market in two
ways. First, the geographical and meteorological differences within the market area can lead to a
steady minimum wind energy level similar to a base load plant. In order to test this effect for different
plant types the hourly input data is divided into subsets and wind profiles are conducted, ordering the
input from the highest to the lowest value. First the off-peak segment and thus potential replacement
of base load plants (i.e. nuclear or coal) is tested. Second, potential replacement of mid-load plants is
estimated. Finally the peak segment is analyzed.
Second, is by shifting the load curve which in turn reduces peak load. Whereas the fluctuating nature
of wind may lead to zero/almost no wind input in some hours of a year, the demand reduction may be
achieved with a higher probability. Necessary peak capacity is defined by a few hours in the year and
already a low wind output can bring those values down. To test this effect the load duration curve for
Germany is compared to an adjusted duration curve reduced by the hourly wind input. The difference
of the peak value represents the potential for capacity reduction. The analysis is carried out for
different time segments.
The capacity reduction analysis is based on the available information in the observation period (this
paper neglects model tests or extrapolation to future scenarios) and the results only give a historical
1 By the end of 2007 about 18.3 GW were installed in the Northern states and only 3.9 GW in the Southern states. This
divergence will increase with the projected extension of offshore capacities.
review. Nevertheless, given the sample size of more than 20,000 hours, the data is assumed to provide
reasonable estimates.
2.3 Market model for cost analysis
Based on the wind output data a market model is constructed to estimate the differences in production
costs and market prices caused by wind penetration. The model is designed to minimize costs,
including unit commitment and start-up costs:
(
)
∑
∑
+
=
p t t p p t t p tp
g
startup
c
, ,
costs
min
objective (1)max min p t p t p p t
p
g
g
on
g
on
≤
≤
capacity constraint (2)∑
=
p t p tg
d
energy balance (3)The market is characterized by a set of plants p with constant marginal costs cp and it is assumed to be
perfectly competitive. Demand d is externally given (equation 3) and the objective is to satisfy this
demand in a least-cost manner (equation 1). The plants are subject to capacity constraints (equation 2)
giving an upper bound on generation gmax and a lower bound gmin when the plant is online (onp=1). The
plant commitment includes constraints on the start-up time and the associated start-up costs. Pumped
storage plants are included to allow for more flexible dispatch.2 The model is solved for a set of hours t covering the entire observation period.
The dataset for the power plant park is based on VGE (2005, 2006) and includes all conventional
facilities in Germany with more than 100 MW generation capacity by plant and fuel types. Seasonal
availability factors are taken from Hoster (1996). An efficiency value for each plant is estimated based
on the construction year following Schröter (2004). The efficiency value is also used to obtain
plant-specific CO2 emissions (Gampe, 2004). Fuel prices for oil, gas, and coal are taken from the Federal
Office of Economics and Export Control (BAFA) and vary for each month. Emission Allowance
(EUA) prices are taken from the EEX and, like fuel prices, are averaged for each month.
The model is calculated for two different demand sets. First, the demand values published by the
UCTE are run. They represent the benchmark case with no wind input. In a second run the demand
values are reduced by the hourly wind input values, lowering the demand conventional plants have to
satisfy. The difference between both model runs can be seen as the savings from wind energy.
Although the model is a detailed representation of the German market, model assumptions and
simplifications bias the results. The model is static with respect to the underlying parameters.
Excluding wind energy in the market would increase the output of conventional plants which in turn
prices regarding the replacement of German generation by foreign imports is neglected. In addition
imports and exports alter the demand level; since Germany is on average an exporting country, the
demand level is on average too low. The model does not consider small-scale generation by solar,
biomass, and other distributed generators which in turn leads to an overestimation of the demand level
on average and may offset the export error. Nevertheless, the obtained cost and price values give a
more sophisticated approximation than pure average cost calculations or simple, stylized market
models.
3
Results and discussion
3.1 Capacity credit
First, the potential for capacity replacement is analyzed. Given the wind output curves for each load
segment it is clear that nearly all wind capacity must be backed up (see Figure 3 in the Appendix). The
aggregated output of all wind turbines in Germany dropped below 10% of the installed capacity in
about 40% of the observed hours independent of the time-of-day segment. The actual guaranteed
feed-in durfeed-ing the observation period was less than 0.5%. We conclude that Germany appears to provide a
rather limited wind divergence with respect to the current locales of wind turbines.
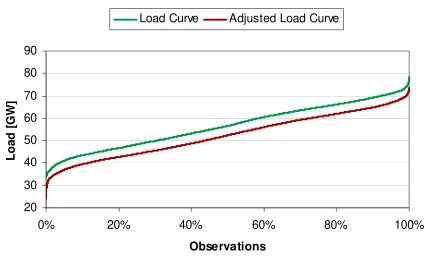
Second, wind’s impact on the load profile is estimated. Figure 1 shows the full load duration curve
during the observation period. We observe a parallel shift of the overall load level by about 5 GW due
to wind output.3 During the night there is a saving in peak capacity requirements of 3.5 GW, during the day 4.6 GW, and during the noon peak the saving even reaches 5.7 GW. Thus within the
observation period about 3 GW of base- load capacity and additionally 1 GW of mid- or peak-load
plants could have been replaced by the 20 GW of wind turbines due to load reduction. This number
resembles the 10-15% capacity credit for large systems given in Giebel (2005). However, due to the
stochastic nature of wind speeds the observed numbers do not represent guaranteed values. Looking at
the distribution of wind energy output during peak hours in the winter months shows that the observed
values can not be taken for granted in the future because in each hour the wind input dropped below
1% of installed capacity (Table 2).4
The available data for Germany does not encourage drawing the conclusion that the installed wind
capacities allow a significant reduction of installed conventional capacities. In order to guarantee a
secure supply of electricity in all possible load cases nearly the full wind capacity must be backed up.
However, the reserve capacities will face a largely reduced running time. Additional measures such as
demand side management combined with locational prices, active wind park management, extension
of cross- border capacities, and promoting European electricity trading may increase the benefits from
2 A more detailed description of the model is provided in Weigt and Hirschhausen (2008). 3 The two duration curves are ordered separately from the lowest to the highest value.
4 The selected hours are most likely to define the yearly peak load and thus the necessary generation capacity.
large-scale wind integration. Too, the capacity credit of wind energy may increase if the geographic
[image:10.595.99.526.118.386.2]scope is extended beyond Germany (see Østergaard, 2008).
Figure 1: Load duration curve with and without wind energy, 2006 until June 2008
20 30 40 50 60 70 80 90
0% 20% 40% 60% 80% 100%
Observations
Loa
d [
G
W
]
[image:10.595.79.547.420.494.2]Load Curve Adjusted Load Curve
Table 2: Availability of wind energy (in % of installed capacity)
Hour: 11am 12am 1pm 5pm 6pm 7pm
Max 84.7% 83.1% 81.7% 84.2% 83.5% 82.0%
Min 0.6% 0.7% 0.7% 0.6% 0.7% 0.7%
Mean 27.5% 28.0% 28.6% 28.0% 27.8% 27.9%
Median 23.4% 23.6% 24.8% 22.6% 22.5% 22.7%
3.2 Cost saving
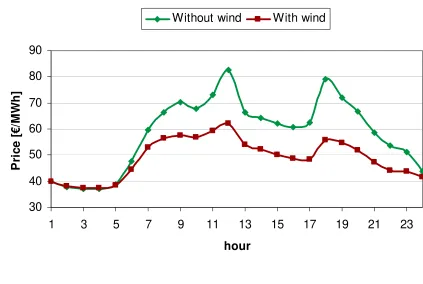
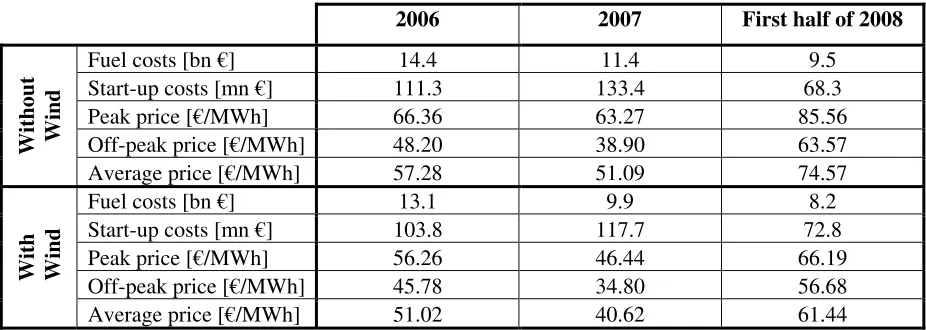
Table 3 summarizes the obtained results for each year from analyzing cost saving.5 As expected wind generation has a decreasing impact on both prices and generation costs. On average a price reduction
of about 10 €/MWh is obtained during the observation period. However, the impact varies for different
hours (and different load levels). Whereas during off-peak hours the impact of increased wind
generation is rather small there is a significant reduction during peak hours (Figure 2). This can be
explained by the impact of wind generation on the merit curve of electricity markets. Electricity
markets typically face a relatively flat supply curve in the beginning and a rapid slope increase in peak
load levels. Given that wind has no fuel costs it is added at the left side of the merit order curve,
shifting the whole curve to the right. During off-peak times this shift has little price impact due to the
flat gradient. However, during peak times even a small shift can cause significant price differences.
As expected the overall generation costs decrease with increased wind generation as more costly fossil
production is replaced by free wind energy. During the observation period a total saving of 4.1 billion
€ is obtained (1.3 bn in 2006, 1.5 bn in 2007, and 1.3 bn in the first half of 2008). The significant
increase in 2008 can be explained by the re-increase of the emission allowance prices for 2008.
Although those prices dropped to nearly zero during 2007, they are levelized at about 20 €/EUA in
2008. Start-up cost also decreased with wind generation by about 20 million € in the observation
period. However, this result appears to depend on the actual wind feed-in pattern since there are
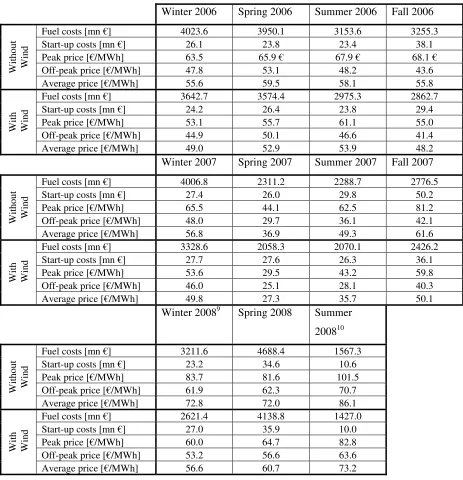
seasons with increased start-up costs and seasons with decreases (see Table 4 in the Appendix).
Further, the model is a deterministic optimization and thus the wind feed-in is known when
determining the unit commitment, leading to an optimal allocation that is not obtainable in real
markets. Ramping constrictions and the impact of partial load on plant efficiencies is not part of the
model and so the resulting impact on start-up costs is likely to be underestimated.
Comparing the gains of wind energy with the additional expenses consumers assume due to the
feed-in tariffs still shows a small net benefit. The total reimbursement for wfeed-ind energy feed-in 2007 is 3.5 billion
€ (BMU, 2008). Given an electricity demand in Germany of about 500 TWh this leads to a price
increase of 7 €/MWh.6 This puts the savings from reduced market prices in roughly the same range as the additional expenses due to the feed-in tariffs. Adding the possible savings from the reduction in
emission allowance prices (see Rathmann, 2007) indicates that the overall impact of wind energy on
consumer prices is positive.7 Beside the pure market price effect, there is the saving in fuel costs of more than 1 billion € per year (given the current fuel prices), another benefit of wind energy that
[image:11.595.94.517.441.725.2]improves its overall balance.
Figure 2: Average market prices in Germany, 2006 until June2008
30 40 50 60 70 80 90
1 3 5 7 9 11 13 15 17 19 21 23
hour
P
ri
ce [
€
/M
Wh
]
Without wind With wind
6 The numbers for 2006 are lower because less wind energy has been injected. Numbers for 2008 are not yet available but are
assumed to be slightly higher given the additional installed wind capacity.
Table 3: Model results
2006 2007 First half of 2008
Fuel costs [bn €] 14.4 11.4 9.5
Start-up costs [mn €] 111.3 133.4 68.3 Peak price [€/MWh] 66.36 63.27 85.56 Off-peak price [€/MWh] 48.20 38.90 63.57
Without Wind
Average price [€/MWh] 57.28 51.09 74.57
Fuel costs [bn €] 13.1 9.9 8.2
Start-up costs [mn €] 103.8 117.7 72.8 Peak price [€/MWh] 56.26 46.44 66.19 Off-peak price [€/MWh] 45.78 34.80 56.68
With Wind
Average price [€/MWh] 51.02 40.62 61.44
4
Conclusion
In this paper the available hourly wind generation data for 2006 until June2008 published by the four
German TSOs is empirically analysed to assess the potential of wind energy to replace installed
conventional generation capacities and to reduce generation costs. The existing data does not provide
evidence for a significant capacity credit of wind energy in Germany. Although during the observation
period a reduction of peak load levels of about 4 GW is observed the variance of wind input does not
guarantee this reduction. An aggregation of the geographic area including Denmark, the Benelux, and
Poland may increase the potential of wind generation to replace installed conventional capacity.
The cost saving potential of wind energy is quite significant in the observation period. On average the
generation costs decreased by more than 1 bn € per year due to the availability of wind energy. Wind
generation also leads to a significantly lower market price particularly during peak periods. The
average electricity price is about 10 €/MWh lower in Germany in the observation period. Compared to
the increase of consumer prices from the renewable support mechanism of 7 €/MWh there still is a net
benefit of wind energy of 3 €/MWh, not accounting for possible additional gains of reduced emission
allowance prices.
References
Boccard, Nicolas (2008): The Social Cost of Wind Power. Presented at: Conference on “The
Economics of Energy Markets”, Toulouse, France, June 20-21, 2008.
Bode, Sven (2006): On the impact of renewable energy support schemes on power prices. Hamburg,
Hamburg Institute of International Economics (HWWI), HWWI Research Programme
International Climate Policy, 4-7.
7 However, one should acknowledge the shortcoming of the model and thus a possible result bias. The short-term nature does
BMU (2008): Beschaffungsmehrkosten für Stromlieferanten durch das Erneuerbare-Energien-Gesetz
im Jahr 2007 (Differenzkosten nach § 15 EEG). Report for the German Federal Environment
Ministry.
DENA (2005): dena-Netzstudie, Energiewirtschaftliche Planung für die Netzintegration von
Windenergie in Deutschland an Land und Offshore bis zum Jahr 2020. Deutsche
Energie-Agentur.
DEWI (2006): Status 31.12.2005, German Wind Energy Institute (DEWI).
DEWI (2007): Status 31.12.2006, German Wind Energy Institute (DEWI).
DEWI (2008): Status 31.12.2007, German Wind Energy Institute (DEWI).
Gampe, Uwe (2004): Umweltaspekte von Energieanlagen. Institut für Energietechnik, Technische
Universität Dresden, Vorlesungsunterlagen.
Giebel, Gregor (2005): Wind Power has a Capacity Credit A Catalogue of 50+ Supporting Studies.
Risø National Laboratory, Report.
Hoogwijk, Monique, Detlef Van Vuuren, et al. (2007): Exploring the impact on cost and electricity
production of high penetration levels of intermittent electricity in OECD Europe and the USA,
results for wind energy. In: Energy, Vol.32, No.8, pp. 1381-1402.
Hoster, Frank (1996): Auswirkungen des europäischen Binnenmarktes für Energie auf die deutsche
Elektrizitätswirtschaft. Oldenbourg, München.
Luickx, Patrick J., Erik D. Delarue, and William D. D’haeseleer (2008): Considerations on the backup
of wind power: Operational backup. In: Applied Energy, Vol.85, No.9, pp. 787-799.
Lund, Henrik, and E. Münster (2003): Management of surplus electricity-production from a
fluctuating renewable-energy source. In: Applied Energy, Vol.76, No.1-3, pp. 65-74.
Lund, Henrik (2005): Large-scale integration of wind power into different energy systems. In: Energy,
Vol.30, No.13, pp. 2402-2412.
Miera, Gonzalo Sáenz De, Pablo Del Río González, and Ignacio Vizcaíno (2008): Analysing the
impact of renewable electricity support schemes on power prices: The case of wind electricity in
Spain. In: Energy Policy, Vol.36, No.9, pp. 3345-3359.
Østergaard, Poul Alberg (2003): Transmission-grid requirements with scattered and fluctuating
renewable electricity-sources. In: Applied Energy, Vol.76, No.1-3, pp. 247-255.
Østergaard, Poul Alberg (2008): Geographic aggregation and wind power output variance in Denmark.
In: Energy, Vol.33, No.9, pp. 1453-1460.
Oswald, James, Mike Raine, and Hezlin Ashraf-Ball (2008): Will British weather provide reliable
electricity? In: Energy Policy, Vol.36, No.8, pp. 3212-3225.
Rathmann, M. (2007): Do support systems for RES-E reduce EU-ETS-driven electricity prices? In:
Energy Policy, Vol.35, No.1, pp. 342-349.
Rosen, Johannes, Ingela Tietze-Stöckinger, and Otto Rentz (2007): Model-based analysis of effects
from large-scale wind power production. In: Energy, Vol.32, No.4, pp. 575-583.
Schröter, Jochen (2004): Auswirkungen des europäischen Emissionshandelssystems auf den
Kraftwerkseinsatz in Deutschland. Diplomarbeit, Berlin University of Technology, Institute of
Power Engineering.
Sensfuß Frank, Mario Ragwitz, and Massimo Genoese (2007): The merit-order effect: A detailed
analysis of the price effect of renewable electricity generation on spot market prices in Germany. In:
Energy Policy, Vol. 36, No. 8, pp 3086-3094.
Strbac, Goran, Anser Shakoor, Mary Black, et al. (2007): Impact of wind generation on the operation
and development of the UK electricity systems. In: Electric Power Systems Research, Vol.77,
No.9, pp. 1214-1277.
UCTE (2008): http://www.ucte.org/services/onlinedatabase/consumption/, retrieved 18.08.2008. VGE (2005): Yearbook of the European Energy and Raw Materials Industry 2005. Essen,Verlag
Glückauf GmbH.
VGE (2006): Yearbook of the European Energy and Raw Materials Industry 2006. Essen,Verlag
Glückauf GmbH.
Weigt, Hannes, and Christian von Hirschhausen (2007): Price Formation and Market Power in the
German Wholesale Electricity Market in 2006. In: Energy Policy (forthcoming).
[image:14.595.102.519.432.691.2]Annex
Figure 3: Wind output curves for Germany, 2006 until June2008
0% 10% 20% 30% 40% 50% 60% 70% 80% 90% 100%
0% 20% 40% 60% 80% 100%
Observations
O
ut
put
[
%
of
C
a
pa
c
it
y
]
Table 4: Cost analysis and overview of results8
Winter 2006 Spring 2006 Summer 2006 Fall 2006
Fuel costs [mn €] 4023.6 3950.1 3153.6 3255.3
Start-up costs [mn €] 26.1 23.8 23.4 38.1
Peak price [€/MWh] 63.5 65.9 € 67.9 € 68.1 €
Off-peak price [€/MWh] 47.8 53.1 48.2 43.6
With
ou
t
Win
d
Average price [€/MWh] 55.6 59.5 58.1 55.8
Fuel costs [mn €] 3642.7 3574.4 2975.3 2862.7
Start-up costs [mn €] 24.2 26.4 23.8 29.4
Peak price [€/MWh] 53.1 55.7 61.1 55.0
Off-peak price [€/MWh] 44.9 50.1 46.6 41.4
With Win
d
Average price [€/MWh] 49.0 52.9 53.9 48.2
Winter 2007 Spring 2007 Summer 2007 Fall 2007
Fuel costs [mn €] 4006.8 2311.2 2288.7 2776.5
Start-up costs [mn €] 27.4 26.0 29.8 50.2
Peak price [€/MWh] 65.5 44.1 62.5 81.2
Off-peak price [€/MWh] 48.0 29.7 36.1 42.1
With
ou
t
Win
d
Average price [€/MWh] 56.8 36.9 49.3 61.6
Fuel costs [mn €] 3328.6 2058.3 2070.1 2426.2
Start-up costs [mn €] 27.7 27.6 26.3 36.1
Peak price [€/MWh] 53.6 29.5 43.2 59.8
Off-peak price [€/MWh] 46.0 25.1 28.1 40.3
With Win
d
Average price [€/MWh] 49.8 27.3 35.7 50.1
Winter 20089 Spring 2008 Summer 200810
Fuel costs [mn €] 3211.6 4688.4 1567.3 Start-up costs [mn €] 23.2 34.6 10.6 Peak price [€/MWh] 83.7 81.6 101.5 Off-peak price [€/MWh] 61.9 62.3 70.7
With
ou
t
Win
d
Average price [€/MWh] 72.8 72.0 86.1 Fuel costs [mn €] 2621.4 4138.8 1427.0 Start-up costs [mn €] 27.0 35.9 10.0
Peak price [€/MWh] 60.0 64.7 82.8
Off-peak price [€/MWh] 53.2 56.6 63.6
With Win
d
Average price [€/MWh] 56.6 60.7 73.2
8 Winter is defined as January, February, and December; Spring as March, April, and May, Summer as June, July, and
August; Fall as September, October, November.
9 Winter 2008 only consists of January and February. 10 Summer 2008 only consists of June.