PROCESS OF
ESTIMATING THE MATERIAL
PROPERTIES OF HUMAN HEEL PAD
SUB-LAYERS USING INVERSE FINITE ELEMENT
ANALYSIS AND SOME MODEL APPLICATIONS
NAFISEH AHANCHIAN
School of Health Sciences
University of Salford, Salford, UK
ii
Table of Contents
List of Tables ... vi
List of Figures ... viii
List of Charts ... xv
Acknowledgements ... xvi
Abstract ... xvii
1. Chapter One: INTRODUCTION ... 1
2. Chapter Two: LITERATURE REVIEW ... 6
2.1 THE HUMAN HEEL PAD ... 7
2.1.1 The Structure ... 8
2.1.2 The Mechanical Properties ... 11
2.1.3 The Function ... 15
2.1.4 Mechanism of Injuries ... 16
2.2 DIFFERENT METHODS TO OBTAIN THE HEEL PAD MATERIAL PROPERTIES… ... 18
2.3 USE OF INVERSE FEA IN DETERMINATION OF THE HUMAN HEEL PAD MATERIAL PROPERTIES ... 32
2.3.1 Introduction to FEA ... 32
2.3.2 Using Inverse FEA to Study the Biomechanical Properties of the Human Heel Pad……. ... 35
2.4 APPLICATIONS OF FEA IN FOOTWEAR DESIGN ... 51
2.5 AIMS AND OBJECTIVES ... 58
3. Chapter Three: DEVELOPMENT OF THE HEEL REGION GEOMETRY ... 61
3.1 INTRODUCTION ... 62
3.2 METHODS ... 63
3.2.1 Data Acquisition: Magnetic Resonance Imaging (MRI) ... 63
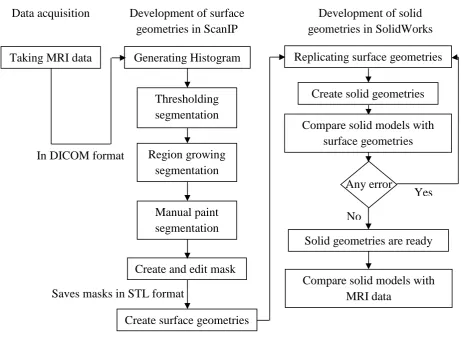
3.2.2 Development of the Surface Geometries ... 66
3.2.2.1 Pre-processing of MRI Data ... 67
3.2.2.2 Segmentation ... 69
3.2.2.3 Repeatability of the Segmentation Procedure of the MRI Scans ... 82
3.2.3 Development of the Solid Geometries... 84
3.2.3.1 The Solid Model of the Heel Region as a Single Layer Structure ... 85
3.2.3.2 Development of Solid Geometries of Different Tissue Layers in the Heel Region…. ... 89
iii
3.4 CONCLUSIONS ... 99
4. Chapter Four: INITIAL DEVELOPMENT OF THE FE MODEL OF THE HEEL REGION ... 101
4.1 INTRODUCTION ... 102
4.2 DEVELOPMENT OF THE FE MODEL ... 102
4.2.1 CAD Geometry and Mesh Generation ... 102
4.2.2 Loading and Boundary Conditions of the Finite Element Model ... 112
4.2.3 Material Properties of the Finite Element Model ... 114
4.2.3.1 Linear Elastic Material Models for Muscle and Plantar Fascia ... 114
4.2.3.2 Nonlinear Material Model for Macro-chamber, Micro-chamber and Skin ... 117
4.3 PARAMETRIC STUDIES ... 120
4.3.1 Effect of Varying the Stiffness of the Muscle Tissue ... 121
4.3.2 Effect of Varying the Stiffness of the Plantar Fascia ... 123
4.3.3 Effect of Varying the Angle of Rotation of the Heel Model ... 124
4.4 CONCLUSIONS ... 126
5. Chapter Five: EXPERIMENTAL ACQUISITION OF FORCE AND TISSUE DISPLACEMENT DATA ... 129
5.1 INTRODUCTION ... 130
5.2 METHODS ... 131
5.2.1 Experimental Device ... 131
5.2.2 Foot Positioning ... 133
5.2.3 Subjects Characteristics ... 134
5.2.4 Loading Protocol ... 134
5.2.5 Ultrasound Data Processing ... 139
5.3 RESULTS AND DISCUSSION ... 140
5.3.1 Slow Compression Tests ... 141
5.3.1.1 Selection of the Appropriate Low Displacement Rate ... 141
5.3.1.2 Slow Compression Tests at 5mm/s to Determine the Hyperelastic Material Properties ... 142
5.3.2 Rapid Compression Tests ... 146
5.3.2.1 Rapid Compression Test at 225mm/s ... 146
5.3.2.2 Rapid Compression Test at 141mm/s ... 149
5.3.2.3 Rapid Compression Test under Sinusoidal Loading ... 151
iv
6. Chapter Six: INVERSE FINITE ELEMENT ANALYSIS ... 154
6.1 INTRODUCTION ... 155
6.2 METHODS ... 156
6.2.1 Hyperelastic Material Properties ... 156
6.2.1.1 Determination of the Hyperelastic Material Properties of the Macro-chamber Layer….. ... 159
6.2.1.2 Determination of the Hyperelastic Material Properties of the Micro-chamber Layer….. ... 161
6.2.1.3 Determination of the Final Hyperelastic Material Properties of the Macro-chamber, Micro-chamber and Skin Layers... 163
6.2.2 Validation of the Hyperelastic FE Model ... 165
6.2.3 Viscoelastic Material Properties ... 168
6.2.3.1 Determination of the Viscoelastic Material Properties of the Macro-chamber Layer….. ... 169
6.2.3.2 Determination of the Viscoelastic Material Properties of the Micro-chamber Layer….. ... 171
6.2.3.3 Determination of the Final Viscoelastic Material Properties of the Macro-chamber, Micro-chamber and Skin Layers... 172
6.2.4 Validation of the Viscoelastic FE Model ... 174
6.2.5 Parametric Studies ... 175
6.3 RESULTS AND DISCUSSION ... 175
6.3.1 Hyperelastic Material Properties of the Heel Pad Sub-layers ... 175
6.3.1.1 Initial Hyperelastic Material Properties of the Macro-chamber Layer ... 176
6.3.1.2 Initial Hyperelastic Material Properties of the Micro-chamber Layer... 177
6.3.1.3 Final Hyperelastic Material Properties of the Macro-chamber, Micro-chamber and Skin Layers ... 179
6.3.2 Validation of the Hyperelastic FE Model ... 184
6.3.3 Viscoelastic Material Properties of the Heel Pad Sub-layers ... 186
6.3.3.1 Initial Viscoelastic Material Properties of the Macro-chamber Layer... 186
6.3.3.2 Initial Viscoelastic Material Properties of the Micro-chamber Layer ... 188
6.3.3.3 Final Viscoelastic Material Properties of the Macro-chamber, Micro-chamber and Skin Layers ... 190
6.3.4 Validation of the Viscoelastic FE Model ... 193
6.3.5 Parametric Studies ... 199
v
7. Chapter Seven: MODEL APPLICATIONS ... 206
7.1 INTRODUCTION ... 207
7.2 APPLICATIONS OF THE MODEL IN STUDYING THE BIOMECHANICAL ASPECTS OF THE HEEL PAD ... 208
7.2.1 Effects of In-vivo Conditions (Case Study 1) ... 209
7.2.1.1 Effects of Experimental Setup Conditions ... 209
7.2.1.2 Effects of Heel Geometry ... 217
7.2.2 Capability of the Developed FE Model in Determination of the Material Properties for another Heel Pad (Case Study 2) ... 222
7.2.2.1 Slow Compression Test Performed on the Heel Pad of Subject 2 ... 223
7.2.2.2 Determination of the Hyperelastic Material Properties of the Heel Pad Sub-layers of Subject 2 ... 226
7.3 THE APPLICATIONS OF THE MODEL IN FOOTWEAR DESIGN RESEARCH STUDY ... 236
7.4 CONCLUSIONS ... 247
8. Chapter Eight: CONCLUSIONS AND FUTURE WORK ... 251
APPENDIX A ... 259
vi
List of Tables
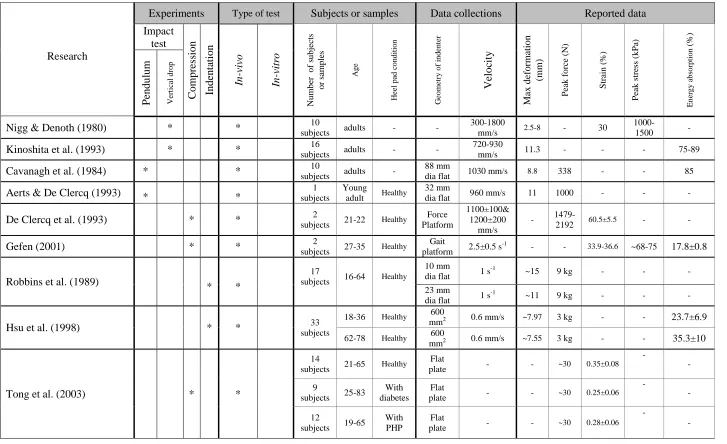
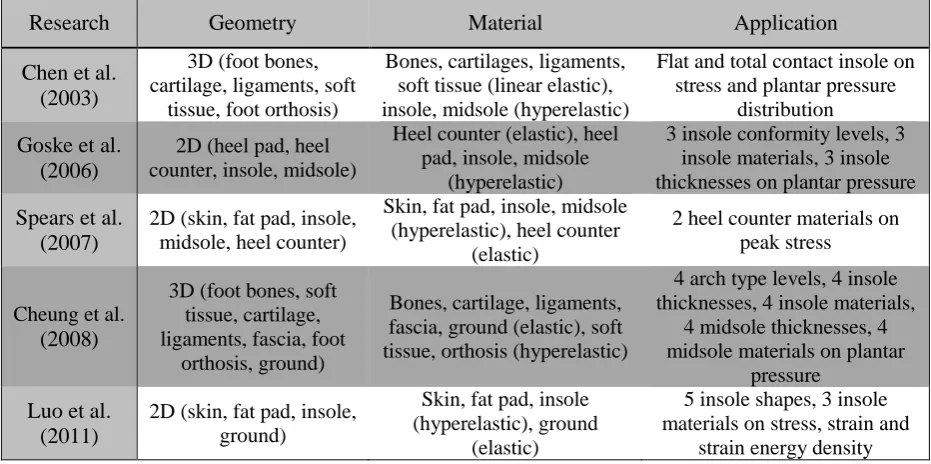
Table 2.1: Review of the studies carried out to characterise the biomechanical behavior of the
human heel pad. ... 28
Table 2.2: The parameters of the hyper-elastic material model obtained for the plantar soft tissue. ... 36
Table 2.3: Hyperelastic and viscoelastic material properties for the fat pad and the skin ... 41
Table 2.4: Hyperelastic material properties for the fat pad and the skin ... 42
Table 2.5: Hyperelastic material properties obtained for the fat pad and the skin ... 44
Table 2.6: Specifications of the reviewed FE models ... 48
Table 2.7: Summery of FE models used for footwear design ... 57
Table 3.1: Repeatability analysis of the segmentation ... 84
Table 4.1: Numbers of elements of the FE model parts ... 108
Table 4.2: Material properties of each component in the FE model ... 120
Table 4.3: Difference between force-strain curves obtained for the model with different muscle tissue stiffness. ... 122
Table 4.4: Difference between the force-strain curves obtained for the model with the reference angle of rotation and the models with different angle of rotations. ... 126
Table 5.1: Difference between force-strain curves resulted for compression tests at 5mm/s and other rates. ... 141
Table 5.2: Mechanical information of the heel pad, macro-chamber, micro-chamber and skin layers under compression at 5mm/s... 145
Table 5.3: Mechanical information of the heel pad, macro-chamber, micro-chamber and skin layers during loading period at 225mm/s. ... 148
Table 6.1: Initial estimates for the hyperelastic material properties of the macro-chamber layer determined from one-layer FE model. ... 176
Table 6.2: The hyperelastic material properties of the micro-chamber and macro-chamber layers determined from two-layer model... 177
Table 6.3: Optimised final hyperelastic material properties for the macro-chamber, micro-chamber and skin layers ... 180
Table 6.4: Difference between loaded heel pad thicknesses measured from the loaded MRI data and predicted by the FE model. ... 185
Table 6.5: The viscoelastic material properties of the macro-chamber layer determined from one-layer model. Values in parenthesis indicate the percentage of the error over maximum force. ... 187
Table 6.6: The viscoelastic material properties of the micro-chamber and macro-chamber layers determined from the two-layer model. Values in parenthesis indicate the percentage of the error over the maximum force. ... 188
Table 6.7: The viscoelastic material properties of the heel pad sub-layers determined from three-layer complete model. Values in parenthesis indicate the percentage of the error over the maximum force. ... 190
vii
Table 6.9: Errors measured between the predicted results and the experimental data obtained at sinusoidal loading for different five trials with different maximum strains. Values in
parenthesis indicate the percentage of the error over the maximum force. ... 196
Table 6.10: The errors measured between the predicted results and the experimental data for different 4 trials with different maximum strains. Values in parenthesis indicate the percentage of the error over the maximum force. ... 198
Table 6.11: Difference between heel pad responses with different muscle tissue stiffness. ... 199
Table 6.12: Difference between the force-strain responses of the heel pad at reference angle (17.6º) and different positions. ... 201
Table 7.1: Body characteristics and heel geometries of Subjects 1 and 2 ... 223
Table 7.2: Mechanical information of the heel pad, macro-chamber, micro-chamber and skin layers under compression at 5mm/s (Subject 2). ... 225
Table 7.3: The hyperelastic material properties of the macro-chamber layer of Subject 2 determined from one-layer model. ... 229
Table 7.4: The hyperelastic material properties of the micro-chamber and macro-chamber layers of Subject 2 determined from two-layer model. ... 230
Table 7.5: Optimised final hyperelastic material properties for macro-chamber, micro-chamber and skin layers of Subject 2. ... 232
Table 7.6: The orthogonal arrayof L4(23) ... 237
Table 7.7: Design factors and their levels ... 238
Table 7.8: Insole and midsole material parameters ... 239
Table 7.9: L9 orthogonal array table and the FE predicted results. Numbers under design factors indicate the levels of each design factor (Table 7.7). ... 241
Table 7.10: Response table of different factor levels ... 241
viii
List of Figures
Figure 2.1: Sagittal view of the human heel area ... 8
Figure 2.2: Structure of the heel pad. Derived from (22). ... 9
Figure 2.3: The structure of the macro-chamber and micro-chamber layers: (A) Schematic representation of the heel pad from coronal view; (B) Microscopic picture of micro-chamber layer; (C) Microscopic picture of macro-chamber layer (original magnification×100). Derived from (2, 3). ... 10
Figure 2.4: Histology of the skin of the sole of the foot (original magnification×40). Derived from (25). ... 10
Figure 2.5: Viscoelastic features: (A) stress-relaxation; (B) creep; (C) Hysteresis. ... 12
Figure 2.6: Changes of the heel pad under compression: (A) Unloaded; (B) Loaded. Derived from (22). ... 16
Figure 2.7: The impact test on the heel pad: (A) The impact tester; (B) Force-deformation responses of the heel pad for 2 adults. Derived from (52). ... 19
Figure 2.8: Heel pad impact test: (A) Impact test using ballistic pendulum; (B) The effects of changing velocity on the heel pad impact hysteresis curve. Derived from (50). ... 20
Figure 2.9: Mechanical characterisation of two subjects heel pad: (A) Experimental setup; (B) The stress-strain relation. Derived from (31). ... 22
Figure 2.10: Deformation characteristics of the heel pad: (A) Different age groups, (B) Different indenter size, (C) Indentation of the heel pad. Derived from (59). ... 23
Figure 2.11: The ultrasound indentation test on the heel pad. Derived from (36). ... 23
Figure 2.12: Indentation of the heel pad: (A) Test rig, (B) Force-strain data for three subject groups. Derived from (32). ... 25
Figure 2.13: The human heel pad under compression: (A) Experimental arrangement for the heel pad compression test; (B) A typical load-displacement record. Derived from (60). ... 26
Figure 2.14: Pre-processing steps of FEA. ... 34
Figure 2.15: Visualization of FEA results in the post-processing stage. ... 35
Figure 2.16: An axisymmetric 2D model of the heel area and midsole. Derived from (9). ... 37
Figure 2.17: Inverse finite element analysis: (A) Force-controlled ultrasound device for indentation of the heel; (B) Finite element model of the heel under indentation. Derived from (5). ... 38
Figure 2.18: A 2D plane strain model of the heel pad used for measuring the plantar pressure. Derived from (5). ... 39
Figure 2.19: A heel pad model. Derived from (10). ... 40
Figure 2.20: A FE model of the heel pad based on MRI data. Derived from (11). ... 41
Figure 2.21: A comparison of predicted plantar pressures in the homogenous and composite models with experimental data. Derived from (11). ... 43
Figure 2.22: A 3D finite element model of the hind foot. Derived from (7). ... 43
Figure 2.23: Finite element analysis of the heel pad: (A) A meshed FE model of the heel pad; (B) Measurement of the mechanical properties of the fat pad tissue. Derived from (77). ... 45
ix
Figure 2.25: A 3D FE model of the foot and the insole: (A) The complete foot model of the
bone and the soft tissue; (B) The insole model. Derived from (87). ... 53
Figure 2.26: A footwear model interacting with the heel pad. Derived from (88). ... 53
Figure 2.27: A 2D model of the combination of the heel pad and the footwear. Derived from (11). ... 54
Figure 2.28: A 3D finite element model of the foot and the footwear. Derived from (74). ... 55
Figure 2.29: : A FE model of the heel pad interacting with different insoles: (A) Meshed model of the heel pad; (B) Flat insole with conical relief at bottom; (C) Custom contoured insole with conical relief at top. Derived from (77). ... 56
Figure 3.1: The process of development of solid geometries ... 62
Figure 3.2: Dimensions of MRI scans ... 64
Figure 3.3: The way MRI works: (A) Hydrogen protons, (B) Hydrogen protons exposed to magnetic field, (C) Hitting proton by radio wave, (D) Proton returning to its original orientation after stopping the radio wave. Derived from (90). ... 65
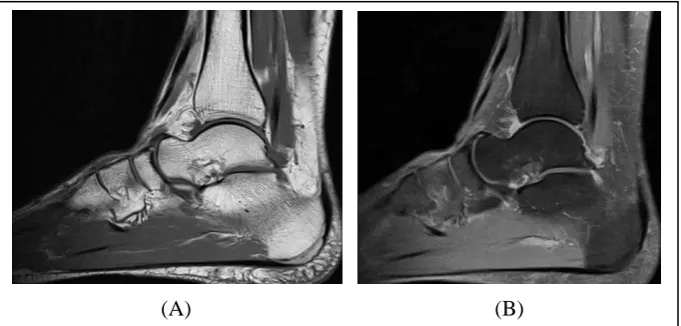
Figure 3.4: Difference between T1 and T2 weighted MR images: (A) T1 weighted; (B) T2 weighted. ... 65
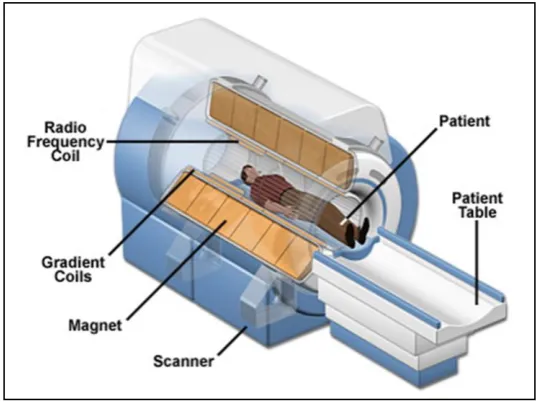
Figure 3.5: MRI scanner. Derived from (92)... 66
Figure 3.6: Using histogram to control the greyscale level, reduce the noise and increase the contrast between different tissues: (A) Using the full greyscale level to see the MR series of images; (B) Changing the level of greyscale to default level to better distinguish different tissues. ... 68
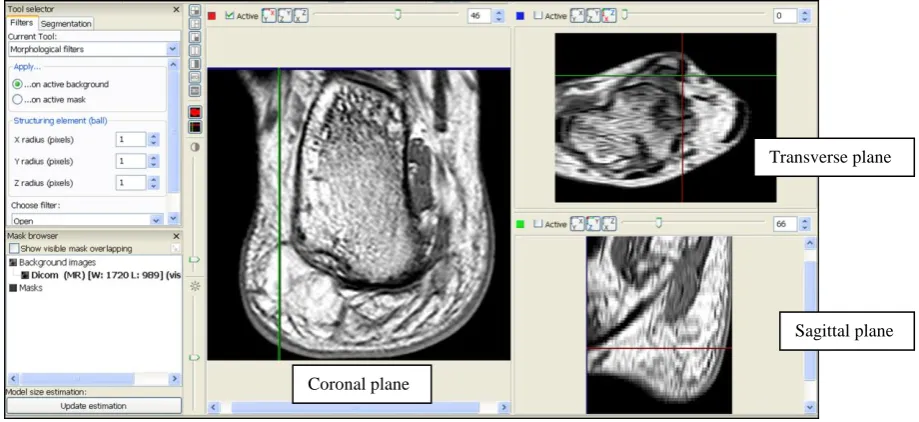
Figure 3.7: The MRI data in three views. ... 68
Figure 3.8: Threshold based segmentation of the skin layer with lower threshold value of 27 and upper threshold value of 76. ... 70
Figure 3.9: Segmentation using confidence connected region growing algorithm: (A) Pixels with three different greyscale intensity values; (B) Selecting seed points; (C) Growing segmentation; (D) Finishing segmentation. ... 71
Figure 3.10: Confidence connected region growing based segmentation: (A) Partly skin layer pixel selection; (B) Full skin layer pixel selection. ... 72
Figure 3.11: Segmentation using floodfill algorithm: (A) Unselected area surrounded by segmented region; (B) Selecting seed point; (C) Growing segmentation. ... 72
Figure 3.12: Using floodfill tool to fill the cavities in the skin layer. ... 73
Figure 3.13: Manually refining MR images using the paint segmentation tool. ... 73
Figure 3.14: The 3D surface model of the skin layer. ... 74
Figure 3.15: The stiff tissue in three different views. ... 74
Figure 3.16: Threshold based segmentation of the stiff tissue. The disconnected boundary of the stiff tissue and selected pixels belong to the skin layer can be seen in the image. ... 75
Figure 3.17: Using different algorithm for the stiff tissue segmentation: (A) Confidence connected region growing based segmentation; (B) Using floodfill tool to fill the cavities; (C) Using the Paint tool to refine the MR image. ... 76
Figure 3.18: The 3D model of the stiff tissue in the heel area. ... 76
x
Figure 3.20: Segmentation of plantar fascia: (A) Using Confidence connected region growing to select the pixels corresponding to plantar fascia; (B) Using Paint tool to refine the
automatic segmentation; (C) The calcaneus and plantar fascia ... 78
Figure 3.21: The 3D model of the plantar fascia. ... 78
Figure 3.22: Segmentation of the muscle tissue. ... 79
Figure 3.23: The 3D surface model of the muscle tissue. ... 80
Figure 3.24: The segmentation process and the 3D surface model of the micro-chamber layer. ... 81
Figure 3.25: The macro-chamber layer mask: (A) The creation of macro-chamber layer mask by including all remaining pixels in the new mask; (B) The 3D surface model of the macro-chamber layer. ... 82
Figure 3.26: Repeatability test of the segmentation. ... 84
Figure 3.27: Surface geometry of the skin layer imported into SolidWorks. ... 85
Figure 3.28: Creation of a geometry using loft feature: (A) Profiles and guide curve; (B) Insertion of surfaces between first and second profiles; (C) Continuing of inserting of surfaces between second and third profiles; (D) Using the guide curve as a path to follow for controlling the shape of the model. ... 86
Figure 3.29: Sketching of profiles and guide curves. ... 87
Figure 3.30: First lofted model of the whole heel region and its difference with the surface model. ... 88
Figure 3.31: Second lofted model of the whole heel region and its difference with the surface model. ... 89
Figure 3.32: The 3D solid model of the heel region as a single layer structure. ... 89
Figure 3.33: Creation of the lofted surface representing the inner boundary of the skin layer: (A) The process of sketching profiles; (B) Splitting lofted surface. ... 90
Figure 3.34: Separation of the solid model of the skin layer from the heel region model. ... 91
Figure 3.35: The complete solid model of the heel region. ... 92
Figure 3.36: A comparison between the dimension of the final 3D model and the subject’s foot: (A) Measurement of the MW at 9.25cm from the back of the foot in the model; (B) The procedure of measuring the MW of the real foot. ... 93
Figure 3.37: Creation of the skin mask in +CAD software from the solid geometry of the skin layer. ... 94
Figure 3.38: Superimposing the skin mask on to the MRI data. The laying of the mask over the MR images can be seen in coronal, sagittal and transverse views. ... 94
Figure 3.39: The skin mask and the segmented region of the skin layer are represented by yellow pixels and red pixels respectively in the MR images. The position of coronal, sagittal and transverse planes at 34mm from the back of the foot, 27mm from the medial side of the heel and 30mm from the bottom of the foot are shown in the MR images. ... 95
Figure 3.40: Maximum difference between the skin mask and segmented region of skin layer: (A) Maximum difference in coronal plane; (B) Maximum difference in transverse plane; (C) Maximum difference in sagittal plane. ... 96
xi
Figure 4.1: Pilot study to identify the required size for the 3D model in the anterior direction; (A) schematic image showing the location of the tuberosity,(B) schematic image showing the process of placing the ultrasound probe under the foot at different locations anterior to the tuberosity, (C) placing the ultrasound probe under the foot at different locations with cm
space between them. ... 104
Figure 4.2: Pilot study to identify the minimum size of the FE model in the inferior-superior direction. ... 104
Figure 4.3: The size of the CAD geometry. ... 105
Figure 4.4: Effect of mesh density of macro-chamber layer on increase in computation time and decrease in variation in peak forces. ... 108
Figure 4.5: Finite Element meshes of the skin layer: (A) Coarse; (B) Intermediate; (C) Fine mesh. ... 109
Figure 4.6: The model of the indenter and the load cell. ... 110
Figure 4.7: The angle of rotation of the heel in the test rig ... 111
Figure 4.8: The complete meshed model of the heel region ... 112
Figure 4.9: The boundary conditions applied to the FE model ... 113
Figure 4.10: Stress-strain response of an elastic material under static loading: (A) Linear elastic material; (B) Nonlinear elastic material. ... 117
Figure 4.11: Generalised Maxwell viscoelastic model. ... 119
Figure 4.12: Effect of varying the stiffness of the muscle tissue. ... 122
Figure 4.13: Effect of varying the stiffness of the plantar fascia. ... 123
Figure 4.14: Effect of varying the angle of rotation of the FE model for ±1 . ... 125
Figure 4.15: Effect of varying the angle of rotation of the FE modelfor ±5 ... 125
Figure 4.16: Effect of varying the angle of rotation of the FE modelfor ±10 ... 126
Figure 5.1: STRIDE: (A) Isometric view of STRIDE; (B) Section view of STRIDE ... 132
Figure 5.2: Foot positioning: (A) The subject standing in the test rig; (B) The frontal view of the foot brace ... 134
Figure 5.3: Ultrasound image recorded for different compression tests: (A) Ultrasound image recorded at lower frequency and higher beam penetration for compression test at 0.25mm/s; (B) Ultrasound image recorded at higher frequency and lower beam penetration for compression test at 5mm/s. ... 136
Figure 5.4: Slow compression test profile at displacement rate of 5mm/s ... 136
Figure 5.5: Rapid compression test profile at displacement rate of 225mm/s ... 137
Figure 5.6: Rapid compression test profile at displacement rate of 141mm/s ... 138
Figure 5.7: The sinusoidal loading profile with maximum velocity of 300mm/s ... 139
Figure 5.8: Ultrasound images for the frontal view at the location of calcaneus tuberosity: (A) Unloaded heel pad; (B) Loaded heel pad. ... 140
Figure 5.9: The average force-strain results for the heel pad at different displacement rates. ... 141
Figure 5.10: The heel pad behaviour at 5mm/s………...143
Figure 5.11: The macro-chamber behaviour at 5mm/s... 143
Figure 5.12: The micro-chamber behaviour at 5mm/s ……….…..143
Figure 5.13: The skin behaviour at 5mm/s ... 143
xii
Figure 5.15: The averages of the force-strain responses of the heel pad and its sub-layers at
5mm/s. ... 144
Figure 5.16: The heel pad behaviour at 225mm/s………..….147
Figure 5.17: The macro-chamber behaviour at 225mm/s... 147
Figure 5.18: The micro-chamber behaviour at 225mm/s………147
Figure 5.19: The skin behaviour at 225 mm/s ... 147
Figure 5.20: The behaviour of the total macro-chamber and micro-chamber at 225mm/s .... 147
Figure 5.21: Force-strain relation of the heel pad for loading-hold-unloading periods at 141mm/s. ... 150
Figure 5.22: Force-deformation data for the heel pad at different loading rate obtained by Spears et al (10). ... 151
Figure 5.23: Force-strain relation of the heel pad under sinusoidal loading. ... 152
Figure 6.1: The procedure of the inverse FEA ... 156
Figure 6.2: The process of estimation of the material properties of the macro-chamber, micro-chamber and skin layers. ... 158
Figure 6.3: Determination of the macro-chamber hyperelastic material properties. ... 159
Figure 6.4: Determination of the micro-chamber hyperelastic material properties ... 162
Figure 6.5: Determination of the hyperelastic material properties of the heel pad sub-layers ... 164
Figure 6.6: The heel pad loading device. The foot support kept the foot at angle of 17.6 degree to reproduce the position of the foot inside the test rig during experimentation and compressed the heel by pulling the loose ends of side straps... 166
Figure 6.7: The heel region pressure distribution under loading measured by Pedar system 168 Figure 6.8: Force-strain relation of the macro-chamber layer predicted by the one-layer FE model. ... 176
Figure 6.9: Force-strain relation of the macro-chamber layer predicted by the two-layer FE model. ... 178
Figure 6.10: Force-strain relation of the two-layer FE model. ... 178
Figure 6.11: Force-strain relation of the macro-chamber layer predicted by the three-layer FE model. ... 180
Figure 6.12: Force-strain relation of the micro-chamber layer predicted by the three-layer FE model. ... 181
Figure 6.13: Force-strain relation of the three-layer FE model. ... 181
Figure 6.14: The loaded thickness of the heel pad subjected to a compressive load of 315.14N: (A) Loaded MR image of the heel pad; (B) FE model of the loaded heel pad... 185
Figure 6.15: Plantar pressure distribution of the heel with rotation angle of 17.6º under 315N: (A) Pedar pressure insole measurement; (B) FE model prediction. ... 186
Figure 6.16: Force-strain relation of the macro-chamber layer predicted by the one-layer FE model. ... 187
Figure 6.17: Force-strain relation of the macro-chamber layer predicted by the two-layer FE model. ... 189
Figure 6.18: Force-strain relation of the two-layer FE model at 225mm/s. ... 189
xiii
Figure 6.20: Force-strain relation of the micro-chamber layer predicted by the three-layer FE
model. ... 191
Figure 6.21: Force-strain relation of the three-layer FE model at 225mm/s. ... 192
Figure 6.22: Heel pad behaviour at 141mm/s (T1)……….194
Figure 6.23: Heel pad behaviour at 141mm/s (T2) ... 194
Figure 6.24: Heel pad behaviour at 141mm/s (T3)………...195
Figure 6.25: Heel pad behaviour at 141mm/s (T4) ... 195
Figure 6.26: Heel pad behaviour at 141mm/s (T5) ... 195
Figure 6.27: Heel pad behaviour under sinusoidal loading (T1)………196
Figure 6.28: Heel pad behaviour under sinusoidal (T2) ... 196
Figure 6.29: Heel pad behaviour under sinusoidal loading (T3) ……….197
Figure 6.30: Heel pad behaviour under sinusoidal (T4) ... 197
Figure 6.31: Heel pad behaviour under sinusoidal loading (T5) ... 197
Figure 6.32: Effect of changing the stiffness of the muscle tissue ... 199
Figure 6.33: Effect of changing the stiffness of the plantar fascia ... 200
Figure 6.34: Effect of varying the angle of rotation of the FE model for ±1º ... 201
Figure 6.35: Effect of varying the angle of rotation of the FE model for ±5º ... 202
Figure 6.36: Effect of varying the angle of rotation of the FE model for ±10º ... 202
Figure 7.1: The flat and spherical indenter. ... 210
Figure 7.2: The force-displacement response of the heel pad compressed by small and large flat indenters. ... 212
Figure 7.3: The force-displacement response of the heel pad compressed by small and large spherical indenters. ... 212
Figure 7.4: Compressive stress results for 6 mm deformation of the heel pad: (A) Indentation using the 40mm diameter sphere indenter; (B) Indentation using 40mm diameter flat indenter. ... 214
Figure 7.5: Von Mises stress results for 6 mm deformation of the heel pad: (A) Indentation using the 30mm diameter sphere indenter; (B) Indentation using 30mm diameter flat indenter. ... 214
Figure 7.6: The effects of the position of the small (30mm) and large (60mm) indenters on the force-deformation response of the heel pad. ... 215
Figure 7.7: Force-strain response of the heel pad at different velocities. ... 216
Figure 7.8: The effects of the heel pad thickness on the force-displacement response of the heel pad. ... 219
Figure 7.9: The effects of the heel pad thickness on the force-strain response of the heel pad. ... 219
Figure 7.10: The effects of the heel width on the force-displacement response of the heel pad. ... 220
Figure 7.11: Contact pressure under the heel for inducing 6mm deformation to the FE models with different thickness and width. ... 220
xiv
Figure 7.13: Compressive stress under the heel for inducing 6mm deformation: (A) FE model with the maximum heel width of 42.5mm, (B) Original FE model with heel width of 52.5mm,
(C) FE model with the maximum heel width of 62.5mm. ... 221
Figure 7.14: The heel pad behaviour at 5mm/s………...224
Figure 7.15: The macro-chamber behaviour at 5mm/s... 224
Figure 7.16: The micro-chamber behaviour at 5mm/s………....224
Figure 7.17: The skin behaviour at 5mm/s ... 224
Figure 7.18: Behaviour of the total macro-chamber and micro-chamber at 5mm/s ... 224
Figure 7.19: Force-strain relations of the heel pad obtained Subjects 1 and 2 ... 226
Figure 7.20: measuring loaded thickness of the heel pad under specific load: (A) Applying compression load under the heel pad using the loading device; (B) Measuring the compressive load using the Pedar pressure insole; (C) Measuring the loaded thickness of the heel pad using the ultrasound modality. ... 229
Figure 7.21: Force-strain relation of the macro-chamber layer of Subject 2 predicted by one-layer FE model. ... 230
Figure 7.22: Force-strain relation of the macro-chamber layer of Subject 2 predicted by the two-layer FE model. ... 231
Figure 7.23: Force-strain relation of the two-layer FE model for Subject 2. ... 231
Figure 7.24: Force-strain relation of the macro-chamber layer of Subject 2 predicted by three-layer FE model. ... 233
Figure 7.25: Force-strain relation of the micro-chamber layer of Subject 2 predicted by three-layer FE model. ... 233
Figure 7.26: Force-strain relation of the three-layer FE model of Subject 2... 234
Figure 7.27: FE model of the heel pad at different conditions: (A) Barefoot condition; (B) Condition with insole, midsole and ground support. ... 240
Figure 7.28: Response graph of design factors (Mean analysis) ... 242
Figure 7.29: Difference between peak plantar pressure and maximum internal compressive stress for bare foot and optimum conditions. Values are in MPa. ... 243
Figure 7.30: Distribution of compressive stress: (A) Bare foot condition; (B) optimum condition. Values are in MPa. ... 245
Figure 7.31: Von-Misses stress: (A) Bare foot condition; (B) Optimum condition. Values are in MPa. ... 245
Figure 7.32: Displacement in inferior-superior direction: (A) Bare foot condition; (B) Optimum condition. Values are in MPa. ... 245
Figure A.1: Creation of the lofted surface representing the inner boundary of the micro-chamber layer: (A) Sketching a profile; (B) Splitting lofted surface. ... 260
Figure A.2: Separation of the solid geometry of the micro-chamber from the heel region model. ... 260
Figure A.3: Creation of the lofted surface representing the outer boundary of the stiff tissue: (A) Sketching the profiles; (B) Splitting lofted surface. ... 261
xv
Figure A.6: Separation of the solid geometry of the muscle tissue from the remaining part of the heel region model. ... 263 Figure A.7: Creation of the lofted surface representing interface between the plantar fascia and the macro-chamber layer: (A) Sketching profiles; (B) Sketching guide curves; (C) Splitting lofted surface. ... 264 Figure A.8: Separation of the solid geometry of the plantar fascia from the macro-chamber layer. ... 264
List of Charts
xvi
Acknowledgements
I would like to express my sincere gratitude towards my supervisory team, Professor Christopher Nester, Professor David Howard and Dr Lei Ren, for their continuous support, advice and suggestions during my research and writing up.
Also, my kind regards go to Dr Daniel Parker who generously helped me in data collection from compression tests.
Finally, my thanks and appreciations go to my husband, son and parents who supported me kindly and patiently during the course of my study.
xvii
Abstract
The human heel pad is subject to repetitive loading and plays an important role in absorbing shocks which may cause injuries. The heel pad has a composite biological structure consisting of the fat pad and the skin. The fat pad tissue is organised into a superficial micro-chamber layer and a deep macro-chamber layer.
The heel pad sub-layers have different structures and properties. Hence, to understand the contribution of each layer to the heel problem, it is essential to develop a model with discrete structure. Currently, only plantar pressure measurements are used for diagnosis and treatment of the heel problems, whereas it has been shown that high internal tissue stress is an important factor. Because of complex geometry, discrete structure and nonlinear material behaviour of the heel pad, the external force applied to the heel may result in inhomogeneous internal stress condition. Therefore, the relationship between the plantar pressure and internal stress does not seem to be simple. Since there is no equipment to allow measurement of internal stress, a detailed multi-layered FE model of the heel pad can be used as a solution to predict the internal stress.
The main objective of this work was to obtain the hyperelastic and viscoelastic material properties of the subject-specific heel pad sub-layers in-vivo. For this purpose, a combined methodology of finite element modeling and experimentation was developed.
An anatomically detailed 3D FE model of the human heel area was developed using MR images of the right foot of a female subject. A combined ultrasound and indentation system was used to apply series of slow and rapid compression tests on the same foot. The force-strain responses of the heel pad and its sub-layers were used as input to the FE model to estimate properties of the heel pad sub-layers using inverse FEA.
The hyperelastic and viscoelastic FE models were then implemented to investigate the effects of experimental and geometrical factors on the heel pad responses. The model was also used to assess the robustness of the hyperelastic FE model when predicting the behaviour of other heels with different geometries. Finally, this model was used with Taguchi method to evaluate the effect of footwear design factors on the compressive stress in the heel pad tissue.
xviii
1
1.
Chapter One:
2
The human heel pad plays an important role as a shock absorber reducing impact forces
generated during gait and in weight bearing. It deforms under loading and distributes contact
loads. The human heel pad is characterised by viscoelastic mechanical behaviour like many
other biological soft tissues (1). Viscoelastic materials involving both elastic and viscous
components exhibit an interesting time-dependent behaviour. Viscoelastic materials show
hysteresis and energy dissipation under loading and unloading cycle.
The human heel pad has a composite biological structure with a honeycomb configuration
consisting of the fat pad and the skin (2). The fat pad tissue, located between the skin and the
calcaneal perichondrium, is organised into superficial micro-chamber layer and a deep
macro-chamber layer (3, 4). Pathological changes, aging and overloading may affect the heel pad
stiffness and its biomechanical behaviour and are potentially important factors in the
development of heel pain or other foot problems.
An improved understanding of the biomechanical characteristics of each component of the
heel pad can contribute to the understanding of the mechanical functionality of the foot. It
may also assist research into the interaction between the foot and the surrounding surfaces,
such as footwear. Detailed information about the mechanical behaviour of the heel pad
constituents also contributes to the development of models simulating the biomechanical
behaviour of the heel pad under compression. These models provide an opportunity to test the
effects of external factors, such as choice of insole or footwear materials, on the stress
experienced by heel tissues. This may reduce the need for slow and expensive experimental
tests on real subjects and models could be one part of decision making process in insole and
footwear design. Developing pathology (disease) or even person (patient) specific models will
be critical to ensure that outcomes are relevant for clinical practice and that predicted product
3
The study of the mechanical behaviour of the human heel pad can be achieved through
combined experimental and numerical methods. Experimental approaches often employ
ultrasound imaging to generate data about the mechanical responses and deformation of the
heel pad. Different loading conditions are applied and deformations of the heel pad sub-layers
are simultaneously tracked using ultrasound, generating force-deformation/strain data of the
heel pad sub-layers. These data can be used as inputs for the development of numerical
models.
Several studies have been conducted to obtain force-displacement/strain data required for
modelling. With the use of Finite Element Analysis (FEA), researchers have developed
numerical models and studied the mechanical behaviour of the heel pad under loading. In
most cases hyperelastic material models were used to simulate nonlinear behaviour of the heel
pad. However, this ignored the time-dependent behaviour of the heel pad (5-7). Besides, the
heel pad was mostly modeled as a homogeneous single layer material which is in contrast to
the inhomogeneous nature of the heel pad (5, 8, 9). In a few cases the heel pad was modeled
as a composite structure with two layers, the skin and the fat pad. However, in these models
the composite structure of the fat pad was ignored (7, 10, 11). In most studies the heel pad
tissue was tested in an in-vitro state under controlled loading and boundary conditions (10, 12,
13). However, in-vivo and in-vitro mechanical examinations of the heel pad identify different
properties (14, 15).
The main goal of this research was to first develop an anatomically detailed three-dimensional
(3D) Finite Element (FE) model of the human heel area with a composite structure for the heel pad consisting of three layers of, ‘skin’, ‘micro-chamber’, and ‘macro-chamber’. The
next goal was to perform a series of slow and rapid compression tests in-vivo on the same heel
using a combined the ultrasound and compression system to obtain the force-strain responses
4
inverse FEA to estimate the hyperelastic and viscoelastic material properties of the
macro-chamber, micro-chamber and skin layers using the FE model. The final purpose of this project
was to show applications of the hyperelastic and viscoelastic FE models in investigation of
effects of the footwear design factors on the heel stress and how experimental and heel
geometrical factors affect tissue responses. The robustness of the hyperelastic FE model in
prediction of the behaviour of other heels with different geometries was also assessed. This
PhD thesis is divided into 5 main parts described below.
1. Chapter Two: Literature Review
The aim of this chapter was to critically appraise previous research into the material
properties of the human heel pad and its sub-layers, with a specific focus on studies which
have used numerical methods. The chapter starts with an introduction to the human heel pad
followed by an investigation of the methods used to obtain mechanical properties of the
human heel pad. Several numerical models developed to investigate the material properties of
the heel pad or study the biomechanical behaviour of the heel pad under compression are
appraised. Prior research that has used FE models of the heel to investigate footwear design
issues was also reviewed. By summarising the literature at the end of this chapter, possible
ways to improve numerical models and the accuracy of experimental data are outlined and
specific aims and objectives for the remainder of the project established.
2. Chapter Three and Four: Development of the FE Model of the Heel Region
The aim of Chapter 3 was to generate an anatomically detailed 3D geometry of the human
heel area incorporating macro-chamber, micro-chamber and skin layers based on MRI scan
data of the right foot of a female subject. Chapter 4 details how the 3D geometry is converted
to an FE model by meshing the solid geometries of the heel pad structures into discrete
5
conditions to the all geometries. The FE model of the heel region is used in the subsequent
chapters to estimate the material properties of the heel pad sub-layers.
3. Chapter Five: Experimental Acquisition of Force and Tissue Displacement Data
The main objective of this chapter was to perform an in-vivo series of slow and rapid
compression tests on the heel used to develop the FE model. This enabled the force-strain
responses of the heel pad and its sub-layers at different loading conditions to be measured.
The experimental data were used in the following chapter to determine the material properties
of the heel pad sub-layers.
4. Chapter Six: Inverse Finite Element Analysis
In this chapter, the experimental data (obtained in Chapter 5) were used as inputs to inverse
FEA to estimate the hyperelastic and viscoelastic material properties of the macro-chamber,
micro-chamber and skin layers using the FE model (generated in Chapter 3 and 4). Data from
MRI experiments was used to validate the hyperelastic FE model. Moreover, the experimental
responses of the heel pad under different rapid loading conditions were used to validate the
viscoelastic FE model.
5. Chapter Seven: Model Applications
This chapter shows applications of the hyperelastic and viscoelastic FE models. The FE
models were used to investigate the effects of the experimental setup and heel geometrical
conditions on the heel pad responses. Furthermore, the ability of the hyperelastic FE model to
estimate the material properties of other heel pads sub-layers with different geometries was
studied. Finally, the effects of footwear design factors on the heel pad compressive stress
6
2.
Chapter Two:
7
The aim of this literature review is to understand the current knowledge of human heel pad
biomechanics and identify the gaps in knowledge that should be addressed to offer further
innovations. In addition, to appraise various research approaches such that subsequent
research can adopt the most suitable methodology and address technical failings of prior
research. The literature review chapter is divided into five sections. This chapter starts with a
brief introduction to the human heel pad from histological and biomechanical perspectives.
Then, the methods used to obtain the material properties of the heel pad are explored. The
major studies, which have used the FEA (Finite Element Analysis) method to determine the
material properties of the human heel pad, are then critically appraised. By reviewing these
studies, the limitations of the existing FE models are identified. Prior research using FE
models of the heel in the foot and footwear research are then reviewed. The aim of this latter
part of the review is to find out how an FE model can be employed to answer questions
regarding foot and footwear research instead of using relatively slow to complete and
expensive in-vivo experiments on human participants. In the last section, the aims and
objectives of this PhD research project are defined, such that the subsequent work might
address important issues and limitations highlighted in the literature review.
2.1
THE HUMAN HEEL PAD
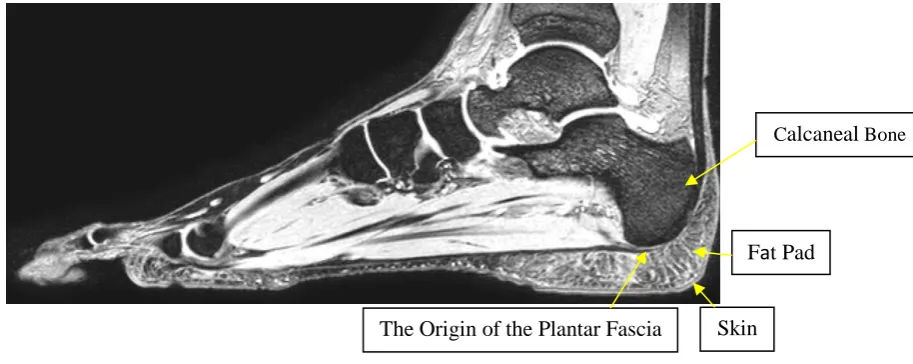
Typically, the soft tissue consisting of the skin and the fat pad layer beneath the calcaneal
bone is called the “heel pad” (Figure 2.1). The heel area actually consists of the heel pad, the
origin of the plantar fascia, insertion of various plantar intrinsic muscles, and the calcaneal
8
Figure 2.1: Sagittal view of the human heel area 2.1.1 The Structure
The human heel pad comprises the fat pad and the skin layers. The unloaded heel pad
thickness varies between 12 to 19mm in healthy adults. Rome et al. reported the heel pad
thickness of 12.5mm (SD 4.2) using in-vivo ultrasonic measurements on healthy volunteers
(16). They measured heel pad thickness of 11 females and 4 males in the mid-section of the
plantar surface of the calcaneum from the calcaneal tuberosity to the skin without
compression of the soft tissue. Others have reported values of 14.3mm (SD 1.9) (17) and
16.6mm (SD 0.3) (18) for the heel pad thickness using the same technique. Levy et al. used
MRI (Magnetic Resonance Imaging) to measure heel pad thickness on 5 healthy subjects.
Mean pad thickness was 18.0mm (SD 4.6) (19). Steinback and Russle measured the heel pad
thickness for 17.8mm (SD 2.0) using in-vivo radiography on normal subjects and patients with
acromegaly (20). Greene also used the same technique on 8 subjects for the heel pad thickness
measurement. He reported mean value of 19.0mm (SD 2.2) (21).
Using ultrasound for the heel pad thickness measurement has advantages over MRI and
radiography (16). Ultrasound is a quick, non-invasive and reliable technique whereas MRI is
expensive and its general availability is low. On the other hand, x-ray has its own difficulties
CalcanealBone
Skin Fat Pad
9
including accuracy issues, interpretation of the films and the health issues regarding ionizing
radiation (16, 20).
The Fat Pad Layer
The fat pad layer lying between the calcaneal bone and the skin has a unique honeycomb
configuration. This structure consists of fibrous septa around fat cells, which is organised into
chambers (Figure 2.2). The fibrous septa are arranged in U-shaped or comma-shaped
columns. They are arranged in a vertical orientation in the central portions of the heel pad and
in a transverse orientation in the lateral and posterior regions (22, 23). The size of the fat
columns varies in different areas of the pad depending on the local loading conditions (3). For
example, the largest fat columns have been found where greatest loadings are experienced by
the heel pad (3).
Figure 2.2: Structure of the heel pad.Derived from (22).
The fat pad layer is anatomically divided into two layers, the superficial micro-chamber
layer with small chambers of fat, and the deep macro-chamber layer with larger fat filled
chambers (Figure 2.3) (3, 23, 24). Hsu et al. used ultrasound to measure the unloaded and
loaded thickness of the separate micro-chamber and macro-chamber layers of the heel pad of
six healthy volunteers aged around 25 years old. They concluded that the unloaded thickness
of the micro-chamber layer is approximately 30% of the unloaded macro-chamber layer
thickness (4).
Fat chambers
10
Figure 2.3: The structure of the macro-chamber and micro-chamber layers: (A) Schematic representation of the heel pad from coronal view; (B) Microscopic picture of micro-chamber layer; (C) Microscopic picture of macro-chamber layer (original magnification×100). Derived from (2, 3).
The Skin Layer
The skin of the sole of the foot is thick and hairless. It is composed of an outer thinner
epidermal layer and an inner thicker dermal layer (25). These two main layers are shown in
Figure 2.4.
Figure 2.4: Histology of the skin of the sole of the foot (original magnification×40). Derived from (25).
The epidermis layer consists of densely packed keratinocytes and plays an important role as a
barrier to physical wear and tear (26). The dermis consists of layers of collagen and elastic
fibres, provides mechanical strength and elasticity (26). The thicknesses of these two layers
(A) (B) (C)
Micro-chamber layer Macro-chamber layer
Skin layer
Epide
rm
is
D
er
m
11
are different among people. The average thickness of the epidermal layer of the sole of the
foot in healthy people is about 0.66 mm (27).
2.1.2 The Mechanical Properties
There is an increasing interest in studying the mechanical properties of the heel pad. Specific
knowledge of heel pad mechanical properties contributes to our understanding of heel pad
functionality and its role in reducing the impact forces associated with weight bearing and
locomotion. The results of these researches are useful in diagnosis and treatment of foot
pathologies and for footwear design.
Similar to the other biological tissues, the heel pad shows nonlinear elastic behaviour under
loading. The heel pad deforms very easily and has low stiffness when initially loaded (22).
Under high deformation, the collagen septa comes under tension and prevents a further
change of the heel pad soft tissues, showing stiffer behaviour (22). It is accepted that the heel
pad soft tissue exhibits viscoelastic behaviour under compression. The
force-deformation/strain responses of these time-dependent materials depend on the velocity at
which they are loaded (28). When they are suddenly deformed and deformation is kept
constant, the related loads decrease with the time. This feature is called stress relaxation (28).
If the viscoelastic materials are subjected to loading and then load is constant, these tissues
continue to deform in time. This phenomenon is called creep (28). Moreover, under cyclic
loading, the force-deformation/strain relationship in loading is different from that in
unloading. This is called hysteresis (28). The area between loading and unloading curves
12
Figure 2.5: Viscoelastic features: (A) stress-relaxation; (B) creep; (C) Hysteresis.
The biomechanical properties of the heel pad vary from one person to another, and depend on
whether measured in-vivo or in-vitro (14, 15). Aerts et al. showed that the in-vivo stiffness of
the human heel pad is almost six times lower and the energy dissipation ratio is about three
times higher than the in-vitro values (15). One possible explanation could be that the lower
leg was being involved in the in-vivo heel pad testing and its presence had influence on the
test measurements (15). It has been also shown that the geometry factors such as the heel pad
thickness and the shape of the calcaneus can affect the heel pad behaviour (2, 10, 17).
Although there are several studies about in-vitro investigation of the biomechanical behaviour
of the heel pad, there are only a number of research studies about the biomechanical
properties of live tissues (29-32).
When studying the mechanical properties of the heel pad, it is commonly assumed to be a
homogeneous material and separate contributions of the heel pad sub-layers on the heel pad
biomechanical response have not been widely reported (5, 9, 31, 32). Hsu et al. showed that
biomechanical behaviours of the micro-chamber and macro-chamber layers are different
under loading in 6 healthy persons aged about 25 years old (4). The thickness of the
micro-chamber layer was reduced from ~3.5mm to ~3.3mm, almost 5.7% strain, under compressive
loading with velocity of approximately 5mm/s up to maximum stress of 158kPa. By
comparison, the macro-chamber layer changed from ~10mm to ~5.5mm, almost 45% strain,
under the same loading conditions. This finding highlights the low stiffness and large Deformation
L
oad
Loading
Unloading
C Time
D
ef
or
m
at
ion
B Time
L
oad
13
deformation behaviour of the macro-chamber layer compared to the micro-chamber layer.
They concluded that the stiffness of the micro-chamber was circa 10 times greater than that of
the macro-chamber layer for healthy young adults. The macro-chamber layer responds to
loading with a larger contribution to tissue deformation, 96.1%, compared to the
micro-chamber contribution of 3.9% (4).
In the other study on 16 healthy participants with average 55 years old, Hsu et al. showed that
the stiffness of the micro-chamber layer is about 6 times of the macro-chamber layer. The
6.9% deformation contribution of the micro-chamber was very low compared to 93.1% for the
chamber layer (33). The difference between the mechanical properties of
macro-chamber and micro-macro-chamber layers creates contrasting functional roles. The macro-macro-chamber
layer, with lower stiffness and large deformation, is important in the heel pad resiliency (the
ability of the heel pad to recover its shape after compression is removed). It is also responsible
for the cushioning feature of the heel pad during gait. The micro-chamber layer, with higher
stiffness, plays an important role as a constraint, preventing the macro-chamber layer from
excessive deformation and maintaining critical amount of macro-chamber layer beneath the
calcaneus (4). Sufficient knowledge about these layers might help better understanding the
functionality of the heel pad.
Some studies have shown that age and pathological changes create changes in tissue
biomechanics (34-36). Whilst there is no significant difference in unloaded thickness of the
heel pad of healthy and people with diabetes, there is a good evidence that the heel pad tissue
is stiffer in people with diabetes compared to those without diabetes (32, 33, 35). This might
be a result of reduction in the size of the fat chambers and thickening of the fibrous septa
separating the fat chambers (32, 37). Hsu et al. showed that the stiffness of the
macro-chamber layer is increased in diabetic patients with Young’s modulus of 239kPa compared to
14
calcaneus to skin through the stiffened macro-chamber layer (33). On the other hand, the
results of their findings indicated that the stiffness of the micro-chamber layer is decreased in
people with diabetes with Young’s modulus of 393kPa compared to 1140kPa for healthy
subjects (33). This might be a cause of reduction in the ability of the micro-chamber in
maintaining the macro-chamber tissue beneath the calcaneus and preventing the excessive
deformation of the macro-chamber layer (33). The energy dissipation ratio of the heel pad is
also significantly increased in people with diabetes, indicating that more energy is dissipated
as heat during loading and unloading cycles (38, 39). The light microscopic examination of
the diabetic heel pads revealed distorted and fragmented collagen fibres within septal walls
and atrophic fat chambers (40). Higher stiffness and reduction of the shape recovery ability
of the heel pad when the load is removed may contribute to the increased EDR in diabetic
patients. These findings may be responsible for development of shock-induced discomfort and
foot ulceration (38, 41).
In some studies, the mechanical behaviour of the human heel pad was compared between
young and older adults. The results showed that the unloaded heel pad thickness and the
energy dissipation ratio are increased in the aged group compared to the young group. Hsu et
al. measured the heel pad thickness as 17.6mm (SD 0.2) for young and 20.1mm (SD 0.24) for
older groups (36). Furthermore, they measured energy dissipation ratio of heel pad as 23.7%
(SD 6.9) and 35.3% (SD 10) for young and older adults respectively (36). Their findings
showed insignificantly higher stiffness of the heel pad in the older group. The average
stiffness was 3.97kg/cm (SD 0.67) for older adults compared to 3.76kg/cm (SD 0.46) for
young adults (36). These changes in the heel pad of older group may be explained by
anatomical changes. According to the published literature, the increased fat in the heel pad
15
chambers, which results in the loss of elasticity of the heel pad (42). Reduction in the
functional capacity of the heel pad of the older group may result in discomfort and injuries.
In summary, the heel pad shows non-linear viscoelastic under loading. It has
nonhomogeneous structure comprising of the macro-chamber, micro-chamber and skin layers
that have different mechanical properties. Some studies showed that the age and disease affect
the mechanical properties of the heel pad sub-layers and in overall the biomechanical
behaviour of the heel pad.
2.1.3 The Function
The heel pad as the most distal part of the human locomotion system is subjective to repetitive
loading associated with locomotion. Hence the heel pad plays an important role in shock
absorption, shock reduction and protecting foot against local stress (22). The honeycomb
structure of the heel pad is designed to withstand strain and pressure. The heel pad absorbs
shocks occurring at the heel strike by dissipating mechanical energy as heat when foot hits the
ground and thereby protects foot against possible injuries (22). The level of hysteresis
prevents bounce and allows grip.
The shock reduction is achieved by the heel pad deforming under loading. Deformation of the
soft tissue distributes effects of applied forces over larger areas of skin and attenuates peak
forces (43). Under compression, the volume of fat-filled chambers must remain constant.
Therefore, under any external compression the chambers expand in lateral and anterodorsal
directions dissipating applied forces (Figure 2.6). The heel pad deforms easily under low
loadings and then becomes gradually stiffer when fibrous septa stiffen and absorb energy, as
the fibres are compressed and straightened under increased loadings. The chambered structure
of the heel pad protects the heel bone by spreading the load over the whole plantar surface of
16
The macro-chamber layer with lower stiffness is responsible for the cushioning feature of the
heel pad during gait and it is important in the heel pad resiliency. The protection of the
structure of the heel pad from severe bulging and excessive deformation is guaranteed by the
micro-chamber layer with higher stiffness as a heel constrain (4).
Figure 2.6: Changes of the heel pad under compression: (A) Unloaded; (B) Loaded. Derived
from (22).
2.1.4 Mechanism of Injuries
High internal stress and strain are believed to be causes of heel pad problems and increase the
risk of soft tissue injury (45-47). The exact nature of how the forces applied to the soft tissue
are distributed depends on the material properties and geometry of the soft tissue and the
external soft tissue supports (45). While stiffer tissues create areas with high stress, softer
tissues tend to have large deformations (high strain). The results of analytical and clinical
studies have shown that stress and strain are high in deep tissues before high stress and strain
are seen in superficial tissues. Studies suggested that the applied force increases the stress and
damage initially in deep tissue and close to bony interface and prominences and then in
superficial tissues near the skin surface (45, 46, 48, 49).
Heel pain is a very common foot problem. The loss of elasticity in the heel pad, which results
in increase of internal tissue stress, might be one possible cause of plantar heel pain (32, 44).
The loss of elasticity might be either because of fat loss compared to fibrous septa or
fragmented collagen fibres with uneven distribution within septal walls of the heel pad (32).
17
The relative percentage of each component (fat globules and fibrous septa) are different in
macro-chamber and micro-chamber layers (38).
Heel ulcers are one of the most serious lower extremity ulcers which are painful and
expensive to treat and can severely limit mobility. The change of the elasticity of the heel pad
could be one of the possible explanations for heel ulcers (32, 41). Heel ulcers can clinically
appear as an open wound or tissue damage under intact skin, which is a deep tissue injury
(DTI). High stress in soft tissue layer adjacent to bony prominence is believed to be the cause
of DTI. It has been suggested that the tissue wound forms first in deep soft tissues and then
progresses to the skin surface (46). In this situation, it remains undiagnosed until breakdown
of the skin occurs. If it is detected at early stage, injured tissues may be saved using different
strategies such as unloading to reduce tissue stress.
The internal cause of heel pain and progression of heel ulcers from sub-dermal tissues to the
skin indicates how important it is to estimate the internal stress and strain in plantar soft
tissues. The heel pad is composed of three sub-layers (macro-chamber, micro-chamber and
skin) with different structures, compositions and material properties, which make it difficult
to understand the effect of the elasticity of the heel pad on heel pain and ulcer formation.
Therefore, it is important to study the material properties of the heel pad sub-layers and their
changes made by age, pathological changes and severe mechanical loading conditions to gain
a better understanding of effect of the elasticity of the heel pad on increasing the internal
stress and risk of pain and injuries in the heel. In the absence of a tool to experimentally
measure the internal tissue stress and strain, valid numerical models can predict the
distribution of stress and strain in tissue and subsequently the area where ulcers are likely to
18
2.2
DIFFERENT METHODS TO OBTAIN THE HEEL PAD MATERIAL
PROPERTIES
Several studies tried to investigate the material properties of the heel pad using different
methods. Depending upon the method used to measure material properties, different
mechanical properties were obtained for the heel pad. Thus, selection of method is critical in
terms of ensuring validity. Dynamic impact test on live tissues has been commonly used to
quantify the mechanical properties of the heel pad (50-52). Impact tests have provided the
heel pad load-displacement behaviour without showing true stress-strain response. Indentation
test has also been widely used to assess the biomechanical properties of biological tissues.
Ultrasound imaging technique has been used in some studies for obtaining information
associated with the human heel pad thickness and deformation under loading (18, 22, 53). In
some new studies ultrasonic indentation method has been used to visualise and measure the
displacements of the soft tissue with a load cell measure the applied external force
concurrently (36, 54). Different methods, used to study the biomechanical behaviour of the
heel pad and its sub-layers, are fully reviewed in this section and their limitations are
summarised at the end of the section.
In-vivo examinations
In some, the human heel pad mechanics were described based on either
load-deformation/strain or stress-load-deformation/strain relations deducted from in-vivo experiments.
Nigg & Denoth performed impact tests with controlled vertical drop of the foot of 10 seated
subjects to evaluate the stress-deformation response of the heel pad to impact. The stress
levels of 100N.cm-2 for deformation ranging from 2.5 to 8mm were reported (55). Although
the contact area under the heel is rapidly changing under loading, they used a constant value
19
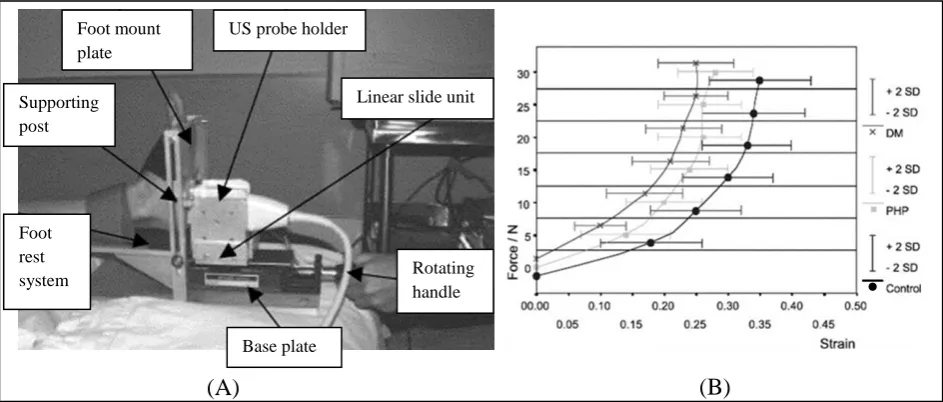
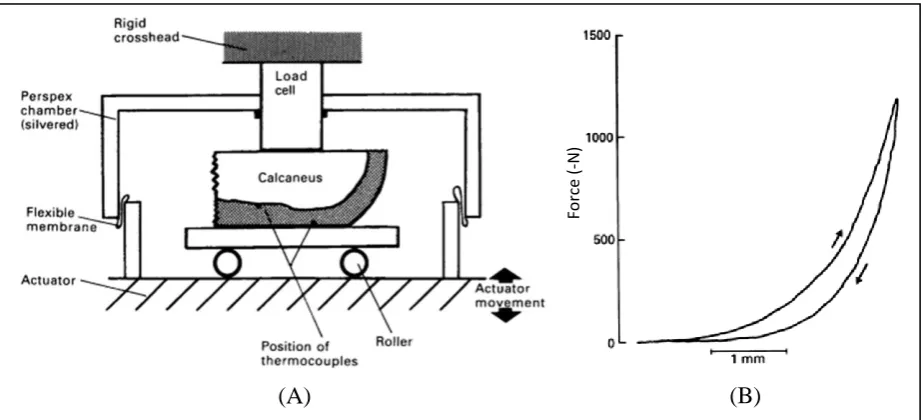
Kinoshita et al. examined the behaviour of 16 heel pads of adults and 5 children using a
drop-impact tester with weight of 5kg and 40mm diameter contact head in order to study the
shock-absorbing characteristics of the heel pad (Figure 2.7). The average peak deformations of the
heel pad were 9.5mm (SD 1.0) and 11.3mm (SD 1.0) at impact velocities of 0.72 and 0.93m/s
(representing impact velocities during actual running) for adults respectively. Results showed
that approximately 77.4% (SD 3.5) and 78.8% (SD 3.6) of energy could be absorbed by the
heel pads at lower and higher velocities respectively. The peak deformation and maximum
energy absorption of children heel pads was 8.3mm (SD 0.8) and 73.9% (SD 2.9) at 0.72m/s.
They concluded that the mechanical properties of the heel pad of children differ from those of
adults. The heel pad of children showed less deformation and less energy absorption (52).
This can be related to less unloaded thickness of the heel pad of children who have less fat
than adults do. A research study done by Jorgensen et al. showed the relationship between the
heel pad thickness and the energy loss with thinnest pads displaying lowest shock absorption
characteristics (56). This might reflect the effect of the age on the mechanical properties of
the heel pad.
Figure 2.7: The impact test on the heel pad: (A) The impact tester; (B) Force-deformation responses of the heel pad for 2 adults. Derived from (52).
Cavanagh et al. used a ballistic pendulum with mass of 1.9 to 4.0kg to characterise the
mechanical properties of the heel pad under impact conditions thought to be similar to those
during running. A flat 88mm diameter circular aluminium plate was chosen as an impact
(A) (B)