Journal of the Statistical and Social Inquiry Society of Ireland Vol. XLV
A Tale of Two Clusters: The Evolution of Ireland’s Economic Complexity
since 1995
Neave O’Clery* Harvard University
(read before the Society, 19 November 2015)
Abstract This paper characterizes the evolution of the manufacturing and industrial export structure of Ireland since 1995 within the framework of Economic Complexity and the Product Space. We observe a high level of specialisation in Ireland’s export structure, coupled with high income per capita as compared to the complexity level of its industrial activities (as captured by its Economic Complexity Index). We identify a dual structure within the economy, with domestic and foreign-owned exporters exhibiting distinct characteristics. In the latter case, we observe a recent consolidation and reduction in complexity level by the foreign-owned high tech pharmaceuticals and electronics sectors, with limited evidence of spill-overs leading to growth of domestic firms in these sectors. This contrasts with a dynamic and growing domestic food and agriculture sector, which is well positioned for continued expansion of Ireland’s indigenous activities into more complex goods. Finally, we illustrate this framework as a tool for policy-makers by identifying some potential new sectors that share many inputs with Ireland’s current domestic capability base, and could increase Ireland’s complexity level for future growth.
Keywords: manufacturing, exports, Ireland JELs: L16, L60, O14
1. WHY DO COUNTRIES GROW?
Building on classical theories which focus on the relative contributions of capital, labour and technology to economic growth123 recent work has proposed that countries grow by expanding their knowledge and capability base, enabling them to diversify into new industries and economic activities.4567 The specific capabilities and inputs available to a country determine the set of ‘nearby’ or likely new industries, and govern its diversification. While classical trade theory suggests that current industrial make-up has little to no effect on future structure, new research provides strong signals that the capabilities or skills a country has today affect its industrial path in the future.8
This work has been supported by the Irish Department of Jobs, Enterprise and Employment. It builds on the framework of
Economic Complexity proposed by Prof Ricardo Hausmann at Harvard University, and Cesar Hidalgo at MIT. It has benefitted from insightful conversations with multiple people including Adrian Devitt, Conor Hand, Eoin Gahan, Eduardo Lora, Brad Cunningham, and Luis Espinoza.
1 Flam H & Flanders MJ (1991) Heckscher-Ohlin Trade Theory. Cambridge, Mass.: MIT Press
2 Romer PM (1990) ‘Endogenous Technological Change’. Journal of Political Economy 98 (5, II): 71–102. 3 Aghion P & Howitt P (1992) ‘A Model of Growth Through Creative Destruction’. Econometrica 60 (2): 323–351.
4 Hausmann R & Klinger B (2006) Structural transformation and patterns of comparative advantage in the product space. Inter-American Development Bank.
5 Hidalgo CA, Klinger B, Barabasi AL & Hausmann R (2007) ‘The product space conditions the development of nations’.
Science, 317:482-487.
6 Hidalgo CA & Hausmann R (2009) ‘The Building Blocks of Economic Complexity’. PNAS 106 (106(26)): 10570–10575. 7 Hausmann R & Hidalgo CA (2011) ‘The network structure of economic output’. Journal of Economic Growth, 16(4):309--342.
In order to describe this process, the Economic Complexity framework employs the Product Space,4 5 6 7 a network that models the process of industrial diversification of an economy. The Product Space is based on the intuitive idea that a country that exports fabrics is more likely to next export garments than it is to export jet engines. Metrics derived from the structure of the network, such as the Economic Complexity Index (ECI), which ranks countries by the knowledge accumulated via production in their economies, have been shown to rival alternative predictors for industrial growth such as education and quality of institutions.7
This paper characterizes the evolution of the manufacturing and industrial export structure of Ireland since 1995 within the framework of Economic Complexity and the Product Space. We observe a high level of specialisation in Ireland’s export structure, coupled with high income per capita as compared to the complexity level of its industrial activities (as captured by its Economic Complexity Index). We identify a dual structure within the economy, with domestic and foreign-owned exporters exhibiting distinct characteristics. In the latter case, we observe a recent consolidation and reduction in complexity level by the foreign-owned high tech pharmaceuticals and electronics sectors, with limited evidence of spill-overs leading to growth of domestic firms in these sectors. This contrasts with a dynamic and growing domestic food and agriculture sector, which is well positioned for continued expansion of Ireland’s indigenous activities into more complex goods. Finally, we illustrate this framework as a tool for policy-makers by identifying some potential new sectors that share many inputs with Ireland’s current domestic capability base, and could increase Ireland’s complexity level for future growth.
2. CONTEXT: AN ECONOMIC RECOVERY DEPENDANT ON EXPORTS
Ireland is a country in recovery. A domestic housing and construction bubble, fuelled by cheap credit and lax banking oversight, led Ireland to the edge of the abyss in 2008. As the world suffered a global financial crisis, Ireland’s banks buckled under massive exposure to real-estate related debt. However, strong fundamentals in terms of quality and competitiveness, coupled with public support for reforms, have enabled Ireland to embark on a successful program of economic recovery. Yet, with domestic demand lagging due to low (but improving) employment figures, Ireland’s recovery in the short term is heavily dependent on the success of its export activities.9
Ireland’s domestic economy is driven mainly by services (constituting over 60% of GDP), with manufacturing a growing component of an overall declining industrial sector. Figure 1 shows that exports of goods and services are high (and growing) as compared to other countries with a similar GDP. Goods exports have traditionally been the dominant factor, but recently services exports – dominated by financial services and IT - have caught up with (and very recently overtaken) goods exports.
A key component of its growth and industrial strategy, Ireland is a major recipient of net inflows of foreign direct investment (FDI) compared to other countries at a similar GDP per capita as seen in Figure 1 of the Supplementary Information (SI), driven by a competitive tax regime and a young, highly educated and skilled labour force. In fact, in 2011, a small number of sectors dominated by foreign-owned multinational enterprises accounted for one quarter of total economy-wide gross value added,10 and today Ireland is home to a plethora of international brand names in high tech, electronics and pharmaceuticals. In contrast, Irelands’ national producers typically focus on high quality foodstuffs and agricultural products with recent growth in medical devices.
Attracting firms to Ireland, and driving domestic growth, Ireland exhibits extraordinarily high levels of tertiary education, and high ranking in both overall competitiveness (ranked 25th in the world in 2015) and ease of doing business (ranked 15th in the world in 2014) as seen in Figure 2 of the SI. In particular, it excels in competitiveness in areas such as health, education, goods and labour market efficiency and technological readiness/innovation. This is coupled with excellent performances in financial and administrative areas related to starting and maintaining a business, including providing access to credit, setting attractive tax rates and protecting investors. Some challenges remain in practical areas such as electricity and construction permits.
Here we focus on the evolution of Ireland’s exports, both as a important component of Ireland’s growth, and as a signal of international competitiveness in particular products and industries. The composition of Ireland’s exports has evolved towards an increasing reliance on pharmaceuticals and chemicals in terms of export share since 1995, as seen in Figure 2. While we observe a decline in the share of exports from the food and agriculture sector, their total value has been increasing (see Figure 3 of the SI). Similarly, while maintaining their export value, the share of electronics and machinery exported has declined in recent years, dominated by the growing pharmaceuticals sector.
9 Byrne S & O’Brien M (2015) ‘The Changing Nature of Irish Exports: Context, Causes and Consequences’. Irish Central
Bank April Quarterly Bulletin
Ireland’s main export partners include the US, the UK and various large European economies. Figure 4 of the SI shows that export to the North America and Western Europe has been increasing since 1995, driven by the USA and Belgium, who mainly buy pharmaceutical inputs (much of Ireland’s imports and exports are subsidiary goods that serve as inputs for other products, forming part of a global supply chain). Closer to home, the UK and Germany also import a large range of products including food and agricultural products.
Figure 1: Ireland has experienced erratic GDP growth since a major fall in 2008/9. Driving the Irish economy, the proportion of services as a share of GDP has been increasing since 2000, with a corresponding decrease in size of the industrial sector. Manufacturing (a component of industry), however, has shown a recent increase, with a decline in agriculture. With domestic demand lagging, Ireland relies on exports as the underlying factor behind recent growth, including an increasing share of services exports. [Source: The World Bank’s World Development Indicators (WDI) 2012]
We note that the total value of some foreign-owned or operated industries in Ireland may be over-stated. To avail of Ireland’s low corporation tax, foreign businesses often engage in transfer pricing in order to divert their profits to Ireland,11 and may include the returns from R&D, marketing and management practices undertaken by multinationals in other countries. While it is difficult to estimate the extent of transfer pricing in Ireland due to a lack of data, productivity levels in sectors such as chemicals, electronics and printing/publishing in Irish plants are nearly 100% greater than the US, UK and EU average.12 Since the majority of the metrics introduced below are derived from international export data – transfer pricing in Ireland won't significantly affect their computation. We acknowledge, however, that there may be an effect when we look at the relative size and distribution of industries in Ireland. We ameliorate this issue by frequently considering domestic and foreign-dominated sectors separately in the analysis that follows.
11 O’Leary E (2015) Irish Economic Development: Serial Under-Achievement or High-Performing EU State. London Routledge Studies in Modern World Economy
Figure 2: While Ireland’s export basket has consistently relied on electronics, pharmaceuticals, food and agricultural produce since 1995, we observe a shift in composition derived from a huge growth in the share pharmaceuticals (and to a lesser extent medical devices), and a decline in electronics (and to a lesser extent food). [Source: The Atlas of Economic Complexity]
It must also be emphasised that much of the analysis to follow does not include traditional services industries such as personal services (e.g. hairdressing) and accounting, or newer services industries that are important for Ireland such as computer software. While the omission of service exports might have limited implication for the analysis of under-developed countries (given their industrial structure), it has significant implications for high-tech economies heavily reliant on services such as Ireland. Nevertheless, since exports are a primary driver of growth for Ireland, important insights may still be derived from examining the nature and dynamics of goods exports within the Economic Complexity framework.
3. THE PRODUCT SPACE & ECONOMIC COMPLEXITY:
DOES WHAT A COUNTRY PRODUCES MATTER FOR ITS FUTURE ECONOMIC GROWTH?
Many early texts of development economics argued that externalities or spill-overs created during the process of industrialisation, as new products were introduced, lead to increased economic growth.131415 However, more recent theories focus instead on the relative contributions of core productive factors such as capital, labour, human capital and institutions1 and technological differences of Romer2, Aghion and Howitt.3
In the first case, poor countries tend to specialize in goods that rely mainly on labour and land, while richer countries focus on producing goods that use more human and physical capital and demand better institutions. Under the second technological differences theory, countries continually move into slightly more advanced products. In both cases particular products are ignored, or abstracted. But is there truly no product-specific pattern or path dependence inherent in the process of industrial diversification and growth?
13 Rosenstein-Rodan P (1943) ‘Problems of Industrialization of Eastern and South Eastern Europe’. Economic Journal 53: 202–211.
14 Hirschman A (1958) The Strategy of Economic Development. New Haven, Conn.: Yale University Press
15 Matsuyama K (1992) ‘Agricultural Productivity, Comparative Advantage, and Economic Growth’. Journal of Economic
An alternative perspective4,5,6,7 focuses on the mechanisms by which the diffusion of capabilities spurs diversification and generates growth. Under this framework, 'capabilities' are typically thought of as skills,16 know-how or tacit knowledge, but can also include physical inputs, and other localised attributes such as institutions, culture and natural amenities. It is hypothesised that countries grow as they acquire new capabilities, and learn to combine these capabilities to make increasingly sophisticated products requiring many complementary skills and inputs
Employing a simple analogy, we consider skills as letters in a game of scrabble. The more letters - or capabilities - a country has, the greater the number of words, or industries, that the country can build, and the longer and more sophisticated the words become. Critically, these new industries will be very similar to the old ones in their production needs as economies exploit existing capabilities to move into new economic activities requiring similar inputs. Hence, this perspective sees industrialisation as a path dependent process, whereby the appearance of new industries is conditional on the presence of relevant capabilities, often in the form of similar industries.
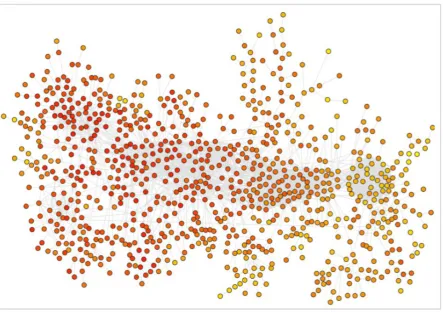
The Product Space4,5,6,7, as seen in Figure 3, is a network that models this process of industrial diversification, where nodes represent products (or industries) that are connected based on how similar their the capability requirements are. In practice, the similarity or edge weight between two nodes is estimated using a measure of co-export – i.e., a pair of products is connected by an edge if they are co-exported by a similar set of countries. The logic behind this approximation is that if a pair of products is co-exported by a large subset of countries, then these products must require a similar capability base.17 This approach is related to the classical theories of Marshall18, Porter19 and more recent work of Glaeser et al.20 who study the drivers of co-location of industries.
The Product Space network is highly heterogeneous. Some regions in the network are tightly connected, implying that neighbouring products use a similar set of capabilities. Countries exporting or producing products in these regions will find it relatively easy to diversify their export basket since they already have most of the capabilities required by many nearby products. On the other hand, countries that have products which are located in sparsely connected regions of the Product Space will find it more difficult to diversify since many new capabilities will be needed to ‘jump’ longer distances. The Product Space structure has been shown to be a successful predictor of the appearances of new industries, and the growth of existing industries, in terms of global export patterns8. This view of growth through industrial diversification remains the focal point of much debate. Traditional economic theory held that specialization is needed for efficiency reasons. For example, the Ricardian trade model suggests that countries should focus on their strengths, and engage in international trade to acquire goods for which they do not exhibit comparative advantage.21 In contrast, more recently others have argued that diversification is a much more importance source of productivity growth, protecting against shocks and terms of trade erosion due to declining commodity prices.22 There remains much debate surrounding the nature of observed diversification (or specialisation), the theoretical foundations of such dynamics, and the optimal path for developing countries.
16 Hanushek EA & Woessmann L (2008) ‘The Role of Cognitive Skills in Economic Development’. Journal of Economic
Literature, 46(3): 607-68
17 We estimate this co-location measure using international trade data (UN Comtrade data provided by CEPII) from the Harmonized Commodity Description and Coding System for 129 countries and 1240 product classes – technical details are to be found in the Appendix.
18 Marshall A (1890) Principles of Economics. London: Macmillan.
19 Porter ME (1998) ‘Clusters and the New Economics of Competition.’ Harvard Business Review, November–December: 77– 90.
20 Ellison G, Glaeser E & Kerr W (2010) ‘What Causes Industry Agglomeration? Evidence from Coagglomeration Patterns’.
American Economic Review, 100(3): 1195-1213.
21 Ricardo D (1971) On the Principles of Political Economy, and Taxation. Harmondsworth: Penguin Books
Figure 3: The Product Space is a network that describes the process of industrial diversification via the acquisition of capabilities. Nodes, or industries, are connected via edges representing the similarity between the capabilities needed to develop each industry. Research has shown that countries grow by diversifying into nearby industries requiring similar inputs in a path dependant manner. Hence, countries with existing industries in the interior of the network, represented by densely connected nodes, have increased opportunity for diversification – they have more possibilities to jump into nearby industries requiring similar capabilities. We observe that industries with similar inputs cluster together, such as the green textiles cluster seen on the far right hand size. [Source: The Atlas of Economic Complexity]
For example, Imbs and Wacziarg23 employed empirical analysis to show that countries tend to diversify, followed by a period of specialisation after a sufficient level of wealth is reached (around 9,000 1985 US dollars per capita). Others disagree, arguing that re-specialisation is difficult to conclusively identify in the data – largely due to measurement difficulty.24 The debate is more intense, however, surrounding the question of whether diversification, and subsequent re-specialisation, has a positive impact on economic growth. In the former case, there is some consensus: diversification is correlated with economic growth for developing countries22. However, on the question of specialisation economists are more divided22,23,4,5,6.
From these questions, a more nuanced theory has emerged4,5,6,7, holding that it is not the number of products which a country exports that is the key: it is the type or sophistication of those products. Highly developed countries export more complex products: those requiring rare capabilities and inputs possessed by only a handful of technologically advanced economies. The Product Complexity Index (PCI), a quantitative measure of product sophistication, is a metric derived from the structure of the Product Space. It is calculated by computing the average diversity of countries that make a specific product, and the average ubiquity of the other products that these countries make – see Supplementary Information for a technical definition.
23 Imbs J & Wacziarg R (2003) ‘Stages of Diversification’. American Economic Review, vol. 93, no. 1, pp. 63-86.
Figure 4: Ireland’s export basket has been shrinking since 1995, when it exported a wide range of products including some textiles, metals, printed materials and peat and cement. Today Ireland resides in two distinct clusters of the product space, with electronics and pharmaceuticals clustering together on the left periphery – and food and agricultural products residing in a cluster on the centre right. Note: nodes or products are coloured if Ireland exports the product with Revealed Comparative Advantage. [Source: The Atlas of Economic Complexity, with artistic and text overlays by Author]
Figure 3, and Figure 5 of the SI, shows that the least complex products (such as primary agriculture and commodities) typically inhabit the right hand side – especially the right-hand periphery - of the Product Space, while more complex products (such as chemicals and electronics) typically inhabit densely connected central regions of the left hand side of the Product Space. Less developed countries typically diversify and grow by expanding their export base from the centre/right region towards the more complex left hand side5.
We can also derive a metric for the composite sophistication or complexity level of a country’s export basket. A country is considered complex if it produces a wide range of products, including many complex products that require rare inputs that only few countries possess. The Economic Complexity Index (ECI)6 of a country is a measure of the complexity of its industrial structure, and is driven by aggregate PCI of the products it exports – see Supplementary Information for a mathematical definition.
Figure 5: We have seen that, over the last decade, Ireland has specialised. In 2012 Ireland occupied two distinct regions of the Product Space – including a cluster of high complexity mainly foreign-owned chemical, pharmaceutical (pink) and electrical products (blue) on the left-hand periphery and a separate cluster of mainly domestic food and agricultural (yellow/orange/red nodes) industries on the centre-right. The presence of domestic industries in highly connected central regions of the Product Spaces implies that Irish firms have many options for diversification in terms of the capabilities they already possess. In contrast, the peripheral nature of some of the foreign-owned industries implies that spill-overs may be limited due to their highly specialised nature - coupled with very high entry costs. [Source: The Atlas of Economic Complexity, with artistic and text overlays by Author]
4. EXPORT DIVERSITY AND COMPLEXITY IN IRELAND
Under the assumption that industrial diversification occurs via the acquisition of new capabilities, by locating the products which Ireland is able to make in the Product Space, we can examine how the productive structure of the Irish economy evolved over time. Later, we can also employ the Product Space to identify potential new industries by locating complex industries (nodes) at short distance from the Ireland’s current export basket.
We measure the ‘presence’ of products in the Product Space by determining if they are exported with Revealed Comparative Advantage (RCA). A product is exported with RCA when the relative share of a country’s exports in the product exceeds the global share of exports in that product. For example, if apples compose 10% of Irelands export basket, but just 2% of global exports, then Ireland would have an RCA factor of 5. If Ireland exports any product with RCA factor>1, we say that Ireland exports that product with RCA.
Over the past decade Ireland’s coverage of the Product Space, in terms of the number of products exported with RCA, has been shrinking. Figure 4 shows that in 1995 Ireland exported a wide range of products including some textiles, metals, printed materials and peat and cement. However, since then Ireland has specialised, exporting fewer and fewer products with RCA (a list of products exported in 2012 with RCA is provided in Tables 1-3 of the Supplementary Information). This behaviour contrasts to that typically observed for less developed countries that diversify in the Product Space as they grow, and more developed countries which tend to be highly diversified25 . The observed consolidation and specialisation for Ireland is supported by analysis by other authors9, and in contrast to a global trend.
Figure 5 shows that today Ireland occupies two distinct clusters in the Product Space – one including mainly complex but peripheral industries such as high tech/electronics and chemicals/pharmaceuticals, and a second cluster in the densely connected, but slightly less complex, central region of the Product Space including foodstuffs, animals and agriculture. We note that the former cluster includes mainly high-tech industries that are the product of a very successful campaign to attract foreign investment (FDI) to Ireland, whereas the latter is composed of mainly domestically-owned and operated industries (noting that certain sectors of the food industry such as baby food and concentrates are foreign-owned, see Figure 15).
We will come back to this point later, but for now we note that Ireland’s position in highly connected central regions of the Product Space – with particular reference to the domestic cluster - implies it has many options for future diversification in terms of the capabilities it already possesses. Specifically, if Ireland wants to capture more of the value-added in sophisticated sectors, domestic producers will have to expand into more complex products typically located in the left-hand side of the Product Space.
We can quantitatively estimate Ireland’s relative level of specialisation via its diversity – in this context measured via the number of products it exports with RCA. Figure 6 illustrates that Ireland’s diversity has been decreasing – its level of specialisation increasing - and today is very high within the context of similar nations, approaching that of oil-rich Norway.
We can also compare Ireland’s export basket in 1995 to that in 2012 (via correlation of the industry-specific RCA values in those years – shown in Figure 6 of the Supplementary Information). We observe a low correlation value within the context of other Northern European countries suggesting that Ireland has not only specialised, but also radically changed its export mix relative to its neighbours during this period.
Figure 6: We can measure Ireland’s level of specialisation via its diversity - the number of products it exports with RCA. For its level of GDP, Ireland has low diversity – or high specialisation, close to that of oil-rich Norway and only exceeding that of high-tech Israel. Ireland’s diversity has been decreasing – its specialisation increasing – since 1995, and today is very low within the context of similar comparator nations. [Source: Author’s calculations using CEPII COMTRADE dataset, and UN World Development Indicators]
We can visually compare Ireland’s export structure, as represented by the Product Space, to other countries. The distribution of products with RCA is shown in Figure 7 of the Supplementary Information for Sweden, Denmark, Hong Kong and Singapore. We find, somewhat surprisingly, that the current Product Space of Ireland appears to be most similar to those of highly specialised high-tech Asian economies such as Singapore and Hong Kong. Indeed, previous analysis has compared Ireland to other small open economies such as Taiwan26.
In order to systematically study the similarity of Ireland’s export structure to other countries, we consider Ireland’s position in the Country Space – an analogue of the Product Space where edges represent similarity in product exports. In a similar manner to the Product Space, high levels of co-exported products between pairs of countries capture an underlying similarity in capability base.
As expected, the Country Space for 2012, shown in Figure 7, exhibits significant geographical clustering. For example, Northern European countries are tightly clustered on the periphery of the network with the exception of a small number of countries heavily affected by the 2008 financial crisis such as Greece, Spain, Portugal and Italy. We also observe distinct clusters of oil-producing states, and continental blocs such as African and South American states.
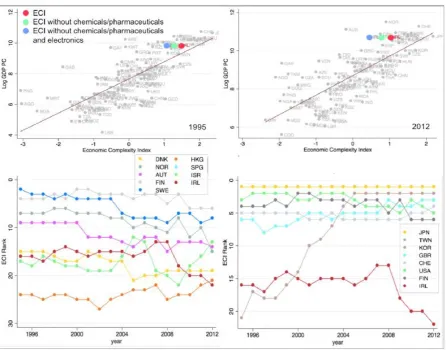
Figure 7: Analogous to the Product Space, we can derive a Country Space for which nodes, or countries, are connected via edges that represent the similarity in underlying capability structure. As with the Product Space, we estimate this similarity by measuring the extent to which pairs co-export the same products. Here we show the Country Space in 1995 (top) and 2012 (bottom) with nodes sized by GDP per capita, and coloured by geographical region. We observe heavy geographical clustering – for example, Northern European countries are tightly clustered on the periphery of the network with the exception of a small number of countries heavily affected by the 2008 financial crisis such as Greece, Spain, Portugal and Italy which are disconnected from the main Northern European bloc. In 1995, Ireland was positioned between the Scandinavian nations and Canada, and the Eastern European bloc. However, in 2012 Ireland had migrated to be more similar to countries reliant on high tech exports such as Japan, Singapore and South Korea. [Source: Author’s calculations using CEPII 2012 COMTRADE data, and WDI 2012]
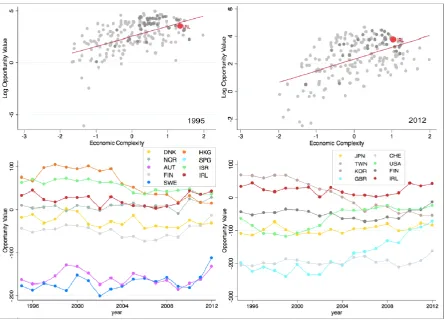
Finally, we consider Ireland’s overall complexity level within the context of its wealth, and dual Product Space structure observed above. Figure 8 shows that Ireland’s GDP per capita relative to other countries with comparable ECI is high in both 1995 and 2012, suggesting limited growth potential at the current complexity level - or possibly even predicts a contraction5.
Given that a cluster of industries, namely chemicals, pharmaceuticals and electronics are mainly foreign-owned, and hence are not fully integrated into Ireland’s capability base (this point is discussed and explored extensively below), we also show the ECI excluding these products from the complexity calculation. In this case, we observe an increasing negative residual, further confirming that Ireland exhibits high wealth compared to its observable capability base, and diversity, as captured by exports. We also note that this result is robust when using GNP rather than GDP (see Figure 8 of the Supplementary Information). As GDP is heavily influenced by foreign earnings from Irish output, GNP is often cited as a more reliable measure of the income of residents.
However, it is prudent to note again that services – particularly tradable services which tend to perform better in terms of growth potential27 - are not included in this analysis, and which may be a source of increased complexity unseen here.
Relative to similar countries (bottom left of Figure 8) and the most complex countries (bottom right of Figure 8), Ireland exhibits declining complexity rank (we consider ranks rather than levels when comparing complexity across time). This indicates that Ireland either is losing high complexity products, or it is gaining low complexity products - or a combination of these factors.
We have seen that Ireland has exhibited intense export specialisation, and a decline in aggregate complexity level, over the past two decades, cumulating in a dual structure in the Product Space most similar to a handful of high tech Asian economies in terms of export basket. We will explore these dynamics further when we look at the evolution of product exports and complexity over time below.
5. INDUSTRY APPEARANCES AND DISAPPEARANCES
:
WHAT HAS BEEN DRIVING THEOBSERVED RECENT DECREASE IN COMPLEXITY FOR IRELAND?
We have previously observed that Ireland has experienced a period of intense specialisation over the past two decades. Globally, however, we observe that most highly complex countries are highly diversified. In fact, while complex countries tend to make a range of products including rare products, less complex countries tend to make ubiquitous products, i.e., those made by a wide range of countries. Has Ireland, in some sense, over-specialised leading to an increased exposure to external risks, and limitations in future growth due to a contracting capability base? By considering the past evolution and future potential of Ireland, in terms of both complexity level and position in the Product Space, we can begin to address this question.
We have seen that Ireland has been experiencing a decline in the number of industries it participates in with a Revealed Comparative Advantage, and overall or aggregate complexity level. We first group products into sectors at Harmonized System (HS) 2-digit sector level, and analyse product presences, appearances and disappearances since 1995.
Figure 9: Here we consider the evolution of sectors (ordered in terms of mean product complexity) in terms of the number of products exported with RCA. We observe that the most complex sectors, such as chemicals and electrical products, have been declining since 1995 in both the number of products exported with RCA, and the share of products in the sector exported with RCA. On the other hand, lower complexity sectors such as foodstuffs, animals and agriculture have shown an increase in the number of products exported with RCA since 2005. [Source: Author’s calculations using CEPII COMTRADE dataset]
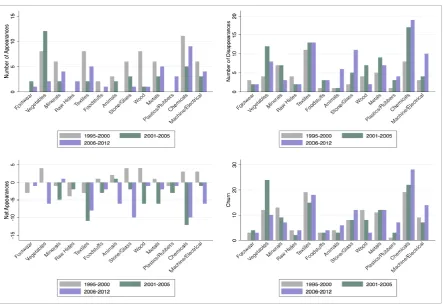
Figure 10: Most sectors have seen a declining number of appearances over time, with vegetables showing a significant increase during the period 2001-2005. Conversely, most sectors have seen an increase in disappearances over time, particularly in the chemical and electrical industries, with the exception of some lower complexity sectors such as vegetables and minerals. In many cases the net appearances of new industries was positive during the period 1995-2000, yet turned negative in later years. There was high entry and exit of many sectors, with increasing churn in high complexity sectors such as stone/glass, plastics, chemicals and machinery/electrical. [Source: Author’s calculations using CEPII COMTRADE 2012 data]
Figure 9 shows that most complex sectors, such as chemicals and electrical products, have been declining since 1995 in both the number of products exported with RCA, and the share of products in the sector exported with RCA. On the other hand, lower complexity sectors such as foodstuffs, animals and agriculture have shown an increase in the number of products exported with RCA since 2005. Hence, it is clear that a combination of a decrease in high complexity products, and an increase in low complexity products, has driven the decrease in overall complexity (the ECI) as previously observed.
Considering appearances and disappearances in more detail, as seen in Figure 10, we observe that:
• While most sectors have seen a declining number of appearances since 1995, vegetables, metals and minerals have seen a modest increase in recent years.
• Almost all sectors have seen an increase in the number of disappearances in recent years, in particular chemicals and electronics. Similarly, in contrast, vegetables and minerals have seen a decline in disappearances.
• We see a negative net number of appearances (i.e., net disappearances) for all sectors for the most recent time-period, with greatest net negative appearances in chemicals, stone/glass and textiles. • The churn (number of appearances and disappearances) has been high for
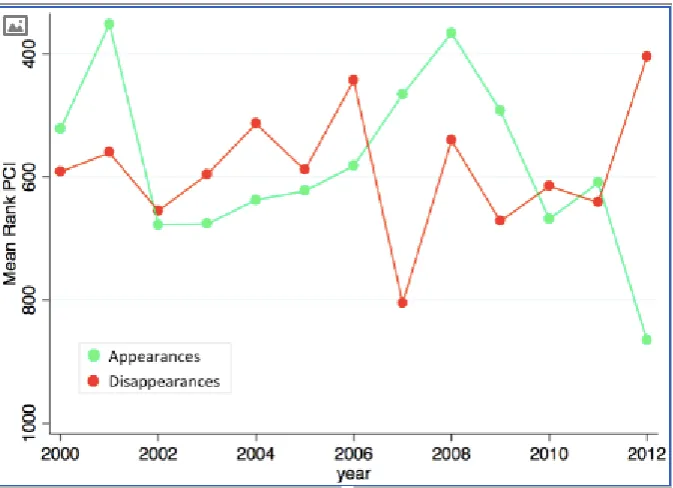
Figure 11: We observe here that, after a sustained rise in the mean complexity of product appearances between 2002 and 2008, since 2008 the complexity of new products exported with RCA has been falling. Hence, overall we observe a worrying trend: declining complexity of appearances coupled with increasing complexity of disappearances. [Source: Author’s calculations using CEPII COMTRADE 2012 data]
Hence, overall we see high churn and a recent acceleration in disappearances for chemicals/pharmaceuticals and electrical/machinery. In contrast the domestic food and animal sectors are largely stable with some increase in presences.
We can also consider more closely the mean sophistication of both appearances and disappearances, as measured by complexity index (PCI). Figure 11 shows that, after a sustained rise in the mean complexity of product appearances between 2002 and 2008, after 2008 the complexity of new products exported with RCA has been falling. Figure 9 of the Supplementary Information shows a breakdown for product groups: after an increase in complexity of both presences and appearances in high tech sectors including machinery/electrical and pharmaceuticals/chemical before 2008, we observe a dramatic decrease in complexity level. When we aggregate food and vegetable sectors, representative of Ireland’s domestic cluster, we observe a recent tentative but erratic increase in complexity of both presences and appearances, which bodes well for increasing the overall domestic complexity level in the long run.
6. AGGLOMERATION ECONOMIES
Underlying the capabilities model introduced above, the creation and growth of industries relies on the transfer of knowledge, and sharing of inputs, between firms. This perspective is closely related to models of regional and urban growth, which typically focus on effects of co-location or agglomeration for both similar and complementary industrial activities. Such models emphasise the localised nature of the drivers of growth, as firms locate in close proximity in order to reduce costs.
[image:14.595.129.466.74.318.2]The role of foreign-owned and operated firms is important within the context of the Product Space framework as the dynamics of industrial diversification, under the assumption that it is based on the percolation of capabilities within an economy which may be significantly altered by FDI as new knowledge, skills and inputs are ‘parachuted in’ leading to varied – potentially positive or negative - effects. Aside from the well-publicised risks of heavy reliance on FDI including issues such as plant relocation, patent expiry etc.28, the key implication here is that a variety of mechanisms could result in limited benefit or knowledge spillover to the local economy in terms of the appearance of similar or related domestic industry.
For example, large number of inputs and capabilities critical to foreign-owned operations – and in particular large multi-nationals operating a highly complex global supply chain – are sourced internationally (through a variety of channels). Hence, while local workforces benefit from such experience, the fact that just a subset of the highly technical inputs needed are sourced locally may mean that these newly acquired capabilities have a more limited impact in terms of the growth of similar industries. Conversely, external inputs such as FDI could have the opposite effect when injected into industries close to the current capability structure – complementing and amplifying existing strengths thus promoting and accelerating growth into nearby products.
Here we consider the evidence for such spill-overs within the Irish economy within the Economic Complexity framework, and ask if its diversification over time is well-described by the Product Space model. But first, we look for further evidence of a dual economy – composed of domestic and foreign producers exhibiting distinct characteristics as seen previously via our Product Space clusters – in firm-level data.
If we consider the set of all manufacturing firms (not restricted to exporters) captured by Ireland’s Central Statistics Office Census of Industrial Production, we observe almost complete dominance of foreign firms across the board – in terms of the number of firms, employees and annual turnover - with the exception of the food and agriculture sector. Specifically, Figure 12 shows that:
1. Chemicals/pharmaceuticals: Foreign firms are dominant in terms of number of enterprises, number of employees (by a factor of 5) and annual turnover (by a factor of 20) for the chemical and pharmaceutical sectors.
2. Electronics/computers: While Ireland has approximately twice as many domestic firms as compared to foreign-owned firms in electronics/computers, foreign firms dominate in terms of employees (by a factor of 4) and turnover (by a factor of 21).
3. Manufacturing: Similarly for ‘other manufacturing’, foreign firms dominate in terms of employees (by a factor of 15) and turnover (by a factor of 38).
4. Food: Somewhat surprisingly, while Ireland has a greater number of firms (570 Irish firms compared to 37 foreign firms) and employees, foreign firms have larger turnover than domestically-owned firms ($US 14m compared to $US 12 for Irish firms) in the food sector.
Figure 12: We observe broad-based dominance of foreign-owned manufacturing firms over Irish manufacturing firms for various key sectors (NACE 2-digit sectors) in 2012. In particular, we can see that foreign firms are dominant in terms of number of enterprises, number of employees and annual turnover for the chemical and pharmaceutical sectors. While Ireland has a significant number of firms in electronics/computers and other manufacturing, foreign firms dominate in terms of employees and turnover. Somewhat surprisingly, while Ireland has a greater number of firms and employees, foreign firms have larger turnover than domestically-owned firms in the food sector. [Source: 2012 Census Industrial Production from CSO Ireland]
Hence, foreign firms appear to dominate domestic firms in almost all key sectors, while Irish firms have only a significant foothold in the food sector.
Ireland has traditionally followed what has been termed an ‘industrialisation by invitation’ approach whereby policy-makers believed that attracting FDI in a range of high-tech clusters would both lead to economic growth and foster indigenous industrial activity11. Yet, despite concerted efforts to foster spill-overs11, evidence of the occurrence of positive externalities are mixed11 29 and this seemingly singular approach has come under criticism30.
A 2014 report by the Irish Department of Finance10 highlights the current dis-connect between domestic and foreign dominated sectors:
• Due to the high value-added nature of foreign-dominated sectors, productivity levels are higher than in Irish-owned firms. This differential holds across all sectors but is particularly pronounced in manufacturing.
• Higher productivity levels are reflected in wage levels which are nearly twice as high in foreign-owned firms as compared with indigenous ones.
29 The Lucerna Project (2010) Capabilities & Competitiveness: A Methodological Approach for Understanding Irish Economic
Transformation
30 Bailey D & Lenihan H (2015) ‘A Critical Reflection on Irish Industrial Policy: A Strategic Choice Approach’. International
[image:16.595.74.523.70.384.2]• While the presence of foreign-owned companies in the economy can benefit domestic firms, the industry output and employment multipliers in terms of indirect effects on the economy are much higher for domestic sectors than for FDI.
For example, high-tech foreign-owned businesses are typically integrated into vertical supply chains often reliant on suppliers in the owners country and distributors on mainland Europe, and often lead to little demand for Irish suppliers31 32. There is also limited evidence of labour market pooling. For example, evidence suggests that skills needed by Irish pharmaceutical industry have been acquired in third level institutions and not ‘on-the-job’33. Finally, limited evidence also exists for knowledge spill-overs with the exception of the Dublin software industry34.
Indeed, analogous to the Product Space distribution of industries observed above, a dichotomous innovation system has also been observed regarding the ways in which indigenous and foreign-owned businesses conduct innovation in Ireland11. For example, indigenous firms are more likely to interact with customers and suppliers, which both spurs innovation and leads to a higher return on that innovation35. On the other hand, foreign-owned businesses based in Ireland tend not to develop in-house R&D capacity, but rather engage with higher education institutes doing research in their respective field36. This latter approach, driven by tax incentives, has again failed to compelling spur on domestic innovation and generate high-tech start-up activity11.
Hence, both a range of data sources and previous research support our earlier observation that Ireland inhabits two distinct clusters in the Product Space. Here we complement this work by developing a data-driven approach to investigate of the pattern of Ireland’s industry appearances in the Product Space, as documented in Tables 4-7 of the SI. We would expect that over time, as clusters of products form in the Product Space and the likelihood of new neighbouring products increases due to concentration of industries, we could better predict new appearances. However, external processes such as injections of FDI may disrupt this path-dependent process and render the Product Space model less predictive of industry growth.
In order to estimate the likelihood of product appearances, and compare this estimate to actual industry appearances, we use a measure of ‘distance’ in the Product Space from a particular product to the export basket of a specific country (i.e., the industries it inhabits) – where a closer industry is more likely to appear8, see SI for a detailed derivation. Conversely, we can identify which appearances were in some sense unexpected due to their increased distance. For example, if Ireland already exports apples and pears – neighbours of plums in the Product Space – it is more likely to export plums in the future. Conversely, Ireland might be less likely to export rubber as it does not already export any of the products neighbouring rubber in the Product Space, and hence an appearance of rubber would be unexpected.
Figure 13 shows that, splitting the data into domestic and foreign-owned sectors, we observe that appearances in domestic sectors became more predictable over time suggesting that an expansion of the underlying capability base (which could be augmented by FDI into these sectors) has given rise to new products as modelled by the Product Space.
However, in the latter case we observe a decrease in the prediction power of the Product Space structure, suggesting a lack of spill-over from the high-tech foreign sector possibly due to a lack of transfer of sufficient capabilities to the indigenous workforce due to their relative distance37 (in the Product Space) from existing local capabilities, specialised input needs, very high start-up and R&D costs, and other barriers to entry such as patent protection in pharmaceuticals and electronics.
31 Gallagher L, Doyle E & O’Leary ‘E (2002) ‘Creating the Celtic Tiger and Sustaining Economic Growth: A Business Perspective’. Quarterly Economic Commentary, Economic and Social Research Institute, Dublin, Spring, 63-81.
32 Barry F, Gorg H & Strobl E (2003), Foreign Direct Investment, Agglomerations and Demonstration Effects: An Empirical Investigation’. Review of World Economics/Weltwirtschaftliches, 139, 4, 583-600.
33 Van Egeraat C (2006) ‘The Pharmaceutical Industry in Ireland: Agglomeration, Localisation or Simply Spatial Concentration?’ NIRSA Working Paper Series, 28, February, National Institute for Regional and Spatial Analysis, Maynooth. 34 Crone M (2004) ‘Celtic Tiger Cubs: Ireland’s VC-Funded Software Start-ups’. The Institute for Small Business Affairs, National Entrepreneurship and SME Development Conference, Newcastle-Gateshead.
35 Doran J & O’Leary E (2011) ‘External Interaction, Innovation and Productivity: An Application of the Innovation Value Chain’. Spatial Economic Analysis, 6(2): 199–222
36 Jordan D & O’Leary E (2008) ‘Is Irish Innovation Policy Working? Evidence from Irish High-Technology Businesses’.
Journal of the Statistical and Social Inquiry Society of Ireland, XXXVII: 1–45.
7. OPPORTUNITIES FOR GROWTH
We have seen that the structure of the Product Space enables us to estimate if past appearances and disappearances were ‘expected’ based on their ‘distance’ to Ireland’s export structure at that time. This logic can be extended to predicting or designing – via, for example, policy actions such as grants or subsidies - future industry appearances under the same logic that nearby industries require similar inputs to current capabilities, and are thus more likely to be good candidates for strategic investment.
On an international level, industrial policy has had a chequered history. Accused of promoting graft, and reducing competition via ‘picking winners’ without clear theoretical foundation, there has been much scepticism regarding a state’s ability to conduct this role fairly and effectively. However, industrial policy has recently enjoyed somewhat of a resurgence as data-driven tools such as the Product Space have become available, and governments in both the developing and developed world attempt to actively promote the growth of specific sectors in the face of emerging threats from a diverse range of sources including climate change, the proliferation of low-growth non-tradable services industries, and the success of China which has long conducted wide-ranging industrial policy38.
We have seen in the previous section that Ireland has traditionally engaged in industrial policy, attracting FDI in a range of high-tech clusters in the hope that this would generate spill-overs and foster indigenous economic activity11. Today, it is widely acknowledged that better linkages between industries, and increased opportunity for bottom-up growth, is needed for diversification and expansion of domestic sectors.11, 39
Before proceeding any further, it is important to note that we seek here to simply illustrate the potential of the Economic Complexity framework and the Product Space as a tool for industrial policy. Further in-depth analysis of market dynamics and a range of internal and external factors, which is beyond the scope of this paper, would be necessary to robustly identify in detail promising sectors for investment.
Figure 13: We observe that appearances of chemicals/pharmaceuticals and machinery/electrical have occurred at both close and further distances from the current Product Space over time, yet vegetable products and animal products have been appearing in a more predictable fashion (we find that the relationship between distance and year is statistically significant with t=-2.43 and r2=0.12) – i.e., increasingly in close proximity to the Ireland’s position in the Product Space. [Source: Author’s calculations using CEPII COMTRADE 2012 data]
38 Aghion P, Boulanger J & Cohen E (2011) Rethinking Industrial Policy. Bruegel Policy Brief
39 Irish Department of Jobs Enterprise and Innovation (2014) Ireland’s Smart Specialisation Strategy for Research and
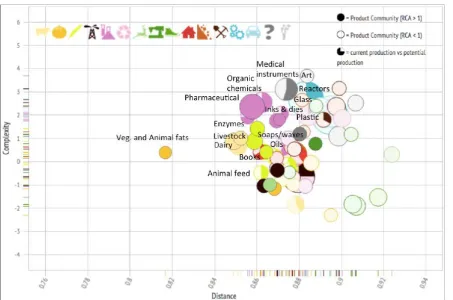
Figure 14: For developing countries, we often have the situation where complex industries are further away (i.e., the distance is greater). However, in Ireland’s case, many complex industries are close to current products. Here the sectors (HS 3-digit aggregation) are sized by world trade, and filled according to the number of sub-sectors Ireland exports with RCA. Hence, the non-filled space corresponds to the ‘opportunity’ for growth of new products within these sectors. [Source: The Atlas of Economic Complexity 2012, with artistic and text overlays by Author]
We have seen that under the Economic Complexity model, countries grow as they diversify into more complex industries in a step-wise fashion (typically moving from right to left) in the Product Space. For many developing countries, complex industries are far away in the Product Space and strategic diversification is difficult. However, in Ireland’s case, a large range of complex industries are close to current products and hence Ireland is well-positioned in the Product Space to increase its aggregate complexity level, as seen in Figure 14.
Figure 15: Ireland occupies a densely connected central cluster, and a high complexity peripheral cluster, in the Product Space leading to many nearby potential new industries and a consistently high opportunity value (see Appendix for definition). Compared to similar countries (bottom left) and the most complex countries (bottom right), Ireland exhibits a relatively high and stable opportunity value. [Source: Author’s calculations using CEPII COMTRADE 2012 data]
Individual products are chosen because they exhibit close distance to Ireland’s current export basket, have complexity greater than the current mean complexity value, and high Opportunity Gain (a metric that combines both distance and complexity analogous to the country-level aggregate measure Opportunity Value).
We wish to identify promising products that are both close the Ireland’s current export or capability structure, and have will increase overall complexity level). Potential products fulfil several criteria:
• Currently not exported with RCA>1
• Small ‘distance’ to Ireland’s current Product Space; • PCI greater than current mean PCI
• RCA in previous years such that 0.05<RCA<1 in order to eliminate products such as kiwis, for example, which may not be suited to Irelands climate (and have hence never been exported in any quantity), and industries in which Ireland previously had a comparative advantage and exited the market.
stone-working machinery. Consistent with developments on the ground, the former set of products fit well within existing growth of the medical devices sector. Agricultural machinery has also been recently independently identified as having significant export potential40.
[image:21.595.75.522.145.459.2]An extensive list of potential industries and their corresponding distance and complexity is included in the Supplementary Information, see Tables 8-13.
Figure 16: Finally, we illustrate the position of several potential industries in the Product Space. We observe that diversification into varied machinery sectors could be a stepping stone to higher complexity measurement instruments. [Source: The Atlas of Economic Complexity 2012, with artistic and text overlays by Author]
8. DISCUSSION AND CONCLUSIONS
In this paper we have explored the evolution of Ireland’s export structure and complexity in the Product Space over the past two decades within the context of an economy heavily dependent on exports, and a long-standing focus on attracting FDI as a means to foster domestic activity.
This analysis has identified several risks to Ireland. In particular, Ireland exports fewer and fewer products with RCA over time, with an acceleration in the number of high complexity products observed exiting the market since 2008. This shrinking Product Space indicates that it is specialising – yet we observe an intense level of specialisation as compared to similar countries. Furthermore, the evidence that specialisation leads to economic growth for developed countries is mixed.
Ireland’s position in the Product Space exhibits a dual structure with two disconnected clusters representing domestic and foreign-owned industries respectively. Due to this distinctive feature, Ireland is today most similar in terms of productive structure to high-tech Asian economies such as Japan, Singapore and Hong Kong. During this period of consolidation, Ireland has experienced a decline in its Economic Complexity Index driven by industry exits in high-tech sectors such as electronics, and increasing domestic exports of low complexity
agricultural and food goods. As a result, Ireland has a very high level of GDP per capita as compared to other countries at a similar complexity or capability level.
Most of Ireland’s high-value foreign-owned exporters, brought to Ireland by a very successful campaign to attract FDI, are located in peripheral regions of the Product Space far away from the domestic cluster. This suggests that knowledge and skills are not easily transferable to the indigenous workforce, and we observe that evidence of spill-overs in terms of the creation of new closely-related domestic-owned industries is limited. We note that, however, spill-overs in terms of the creation of new related services industries (not present in our data sets) – such as computer software and maintenance – have been observed.
The peripheral nature of the foreign-owned cluster does indicate Ireland might enjoy some protection in terms of competition as it is ‘distant’ in terms of the capabilities needed move into this region in the Product Space for many countries. However, the trend towards high levels of diversification for developed countries will likely negate any such protection in the longer run. Specialisation could also leave Ireland open to industry shocks such as patent expiry, changing tax rules, competition from emerging manufacturing bases and changes in the organisation of international supply chains.
However, on the domestic front things are more positive in terms of future trajectory. Ireland’s domestic exporters are located in central highly connected regions of the Product Space leading to high opportunity value and plenty of potential nearby industries (requiring similar capabilities) for expansion. Furthermore, lower complexity but domestically-owned sectors such as foodstuffs, animals and agriculture have shown a recent increase in products exported with RCA – suggesting that the domestic capability base is expanding. FDI into these sectors is also significant which, in this case due to its proximity to Ireland’s current domestic productive capabilities, is likely to bring new complementary expertise and accelerate the observed expansion of the cluster. Ireland has also seen recent growth in domestic industries in medical and optical devices straddling the divide between foreign and nationally-owned firms in the Product Space (yet has not yet increased the number of products with RCA in this sector).
APPENDIX: SUPPLEMENTARY INFORMATION
1. GLOSSARY
• Revealed Comparative Advantage (RCA): A product is exported with RCA when the share of that product in a country's export basket exceeds the global share of exports in that product.
• Product Space: The Product Space is a network that models the process of industrial diversification of an economy. Constructed from international export data, nodes (products) are connected based on the similarity between the sets of countries that export each product pair. This metric is intended to capture shared inputs or required knowledge or skills.
• Country Space: Analogous to the Product Space, nodes of the Country Space are countries which are connected based on their shared capability base. Again, the edge weights are derived from the similarity between the sets of products that each country pair exports.
• Ubiquity: Product ubiquity is the number of countries that export the product with RCA. • Diversity: Country diversity is the number of products that a country exports with RCA.
• Product Complexity Index (PCI): The PCI measures the number and type of capabilities needed to manufacture a product. It is determined by calculating the average diversity of countries that make a specific product, and the average ubiquity of the other products that these countries make.
• Economic Complexity Index (ECI): The ECI of a country ranks how diversified and complex the country's export basket is. Analogous to PCI, it is computed iteratively via a country's diversity refined by the ubiquity of it's products.
• Distance: Distance in the Product Space is measured from a single (non-exported) product to the current set of products exported by a country. Mathematically, it is the sum of the RCAs of exported products weighted by the edge weights connecting these products to the non-exported product.
• Opportunity Gain: The Opportunity Gain measures the potential complexity gain for a country with respect to an individual product. It is computed by calculating the distance of the country to the product (in the Product Space) weighted by the complexity value of the product.
• Opportunity Value: The Opportunity Value measures how well a country is positioned in the Product Space. It is computed by calculating the distance of the country to the products it is currently not exporting with comparative advantage, weighted by the complexity value of each product.
2. ECONOMIC COMPLEXITY VARIABLES
The Product Space and accompanying complexity metrics are derived from CEPII international trade data between 1995 and 2013, including 129 countries and 1240 product classes4 which can be aggregated at various levels. Typically we consider product classes at the Harmonised System (HS) 4-digit level, and sectors at the HS 2-digit and HS 3-digit levels.
We measure the intensity with which a country exports a product by computing its Revealed Comparative Advantage (RCA). The RCA (corresponding to a product in a country) is defined as the ratio between the share of total exports that the product represents in the country's export basket, and the global share of exports of that product. A product is over-represented in a country's export basket if its RCA is above 1.
We say that
• A product is present if RCA≥1 • A product is absent if RCA≤1
• A product appears in t1 if RCA≤1 in t0 and RCA≥1 in t1 • A product disappears in t1 if RCA≥1 in t0 and RCA≤1 in t1
for some combination of times t0 and t1. Tables 1-7 show industry presences, appearances and disappearances for Ireland during the period 1995-2012.
The Product Space
The Product Space, introduced by Hausmann and Hidalgo [1, 5], is a network where nodes represent industries that are connected - via weighted edges - based on how similar their knowledge or input requirements are. In practice, the similarity or edge weight between two nodes is computed using a measure of co-export between two products. The logic behind this approximation is that if two products are co-exported by a subset of countries, then these countries must have a similar capability base.
The structure of a network such as the Product Space may be represented by an adjacency matrix Φ, with entries ϕij corresponding to the weight of an edge from node i to node j. If we denote the indicator matrix for RCA>1 via Mc,i = Mc,i > 1, the edge weight between node i and j is the minimum of the conditional probability of exporting a product i given the export of another good j, and is computed as
where the diversity of country c and the ubiquity of industry i are defined as
respectively.
In practice, since this is a dense (full) matrix, we cannot represent the whole matrix when illustrating the Product Space visually. Hence various techniques, including the Minimum Spanning Tree [8], are applied to reduce the number of edges to illustrate the underlying structure of the network [6].
The Country Space
The Country Space may be defined analogously to the Product Space, where the network structure enables us to compare the relative productive structure of country pairs in terms of shared skills and capabilities. In a similar fashion to the construction of the Product Space, these similarities are estimated by measuring co-export of traded products [3]. In this case, we log transform the RCAs (adding a small constant due to zero values) such that Lc,i = log10(Mc,i + 0.1), and define edge weights that are the entries in adjacency matrix Ψ
Complexity Indices and Opportunity Value
As proposed by Hausmann and Hidalgo [2], the complexity of an economy is related to the range of useful knowledge embedded in it, which can then be combined to make products. These products cannot be made by countries that are missing parts of the required capability set. The complexity metric attempts to estimate this capability set for a given product or country.
Hence, beyond country diversity and product ubiquity, in order to generate a more accurate measure of the number of capabilities available in a country, or required by a product, we need to incorporate more information about the nature of the products. For example, for countries, this requires us to calculate the average ubiquity of the products that it exports and the average diversity of the countries that make those products and so forth. For products, this requires us to calculate the average diversity of the countries that make them and the average ubiquity of the other products that these countries make.
These relationships can be expressed in a recursive format, known as the 'Method of Reflections'. The average diversity of country c and analogously the average ubiquity of industry i may be expressed as:
Continuing the iteration, we reach a pair of expressions:
which, via substitution, can be expressed in closed form in terms of either c or i:
with
and
The application of eigenvalue methods enables us to obtain the long-run solution of the iterative systems above. In particular, the Economic Complexity Index (ECI) is the second largest eigenvector of M̃cc’, and the Product Complexity Index (PCI) is the second largest eigenvector of the analogous matrix M̃ii’.
Density, Distance and Opportunity Value
In order to estimate which products are 'close' to the current productive structure of an economy, we need to derive a metric of distance in the product space. We can define a density predictor variable, the reciprocal of distance, which essentially measures the likelihood of a product presence or appearance based on the RCA of its neighbours in the Product Space [7].
where Ni is the neighbourhood of the k nearest neighbours of node i (defined via k largest out-edges from node i). The logic here is that if a node or product is surrounded by high RCA industries in the Product Space, then it is more likely that either this product is already present, or it will appear in the future. It has been shown that density, which captures path dependance in the Product Space, is highly predictive of export/employment/wage growth on an industry-country level [7].
The distance of industry i from country c can be seen as the inverse of density (i.e., less 'likely' products are 'further' away):
Under this model, a country is well positioned to diversify if it has existing industries in dense well-connected regions of the Product Space, and close neighbours with high product complexity.
We define the opportunity value of country c, which can be seen as the level of complexity of the products that it does not currently export with RCA weighted by how close these products, as
and the opportunity gain, which measures the change in opportunity value for country c that would come as a consequence of developing industry i, as
[image:26.595.75.517.372.655.2]3. FIGURES AND TABLES
Figure 2: We can also consider other aspects concerning the ease of doing business in Ireland via The World Bank's Doing Business Indicators. While Ireland has an impressive record in financial and administrative areas such as starting a business, providing access to credit, setting attractive tax rates and protecting investors, Ireland lags the OECD average in certain practical areas such as electricity and construction permits. [Source: The World Bank's Doing Business Indicators 2014]
[image:27.595.73.526.371.683.2]Figure 4: Ireland's main export partners include the US, the UK and various large European countries. Export to the US and Western Europe has been increasing since 1995, driven by the USA and Belgium, who mainly buy pharmaceutical inputs, and the UK and Germany who import a range of products including food and agricultural products. [Source: The Atlas of Economic Complexity 2012]
Figure 6: We compare the export basket for Northern European countries in 1995 to that in 2010 (via correlation of the industry-specific RCA values in those years). We observe a low correlation value for Ireland suggesting that Ireland has not only specialised, but also radically changed its export mix relative to its neighbours during this period. [Source: Author’s calculations using CEPII 2012 COMTRADE data, and UN World Development Indicators 2012.]
[image:29.595.85.519.380.683.2]