Honeywell
MUL TICS SYSTEM DUMP ANALYSIS PROGRAM LOGIC MANUALSERES 60 (LEVEL 68)
RESTRICTED ,DISTRIBUTION
SUBJECT:
Guide to Analyzing System Failure and Malfunction
SPECIAL INSTRUCTIONS:
DATE:
This Program Logic Manual (PLM) describes certain internal modules constituting the Multics System. It is intended as a reference' for only those who are thoroughly familiar with the implementation details of the Multics operating system; interfaces described herein should not be used by application programmers or subsystem writers; such programmers and writers are concerned with the external interfaces only., The external interfaces are described in the Multics Programmers' Manual, Commands and Active Functions (Order No. AG92), Subroutines (Order No. AG93), and Subsystem Writers' Guide (Order No. AK92).
As Multics evolves, Honeywell will add, delete, and modify module descriptions in subsequent PLM updates. Honeywell does not ensure that the internal functions and internal module interfaces will remain compatible with previous versions.
This PLM is one of a set, which when complete, will supersede the System Programmers' Supplement ,to the t"iul tics Programmers' Manual (Order No. AK96).
THE INFORMATION CONTAINED IN THIS DOCUMENT IS THE EXCLUSIVE PROPERTY OF HONEYWELL INFORMATION SYSTEMS. DISTRIBUTION IS LIMITED TO HONEYWELL EMPLOYEES AND CERTAIN USERS AUTHORIZED TO RECEIVE COPIES. THIS DOCUMENT SHALL NOT BE REPRODUCED OR ITS CONTENTS DISCLOSED TO OTHERS IN WHOLE OR IN PART.
PREFACE
Multics Program Logic Manuals· (PLMs) are intended for use by
Multics system maintenance personnel, development personnel, and
others who are thoroughly familiar with Multics internal system
operation. They are not intended for application programmers or
subsystem writers.
The PLMs contain descriptions of modules that serve"as
internal interfaces and perform special system functions. These
documents do not describe external interfaces, which are us~d by application and system programmers.
Since internal interfaces are added, deleted, and "modified as design improvements are introduced, Honeywell does not ensure that the internal functions and internal module interfaces will
remain compatible with previous versions. To help maintain
accurate PLM documentation, Honeywell publ1.shes a special status bulletin containing a list of the PLMs currently available and
identifying updates to existing PLMs. This status bulletin is
distributed automatically to all holders of the System
Programmers' Supplement to the Multics Programmers' Manual (Order No. AK96) and to others on request. To get on the mailing list for this status bulletin, write to:
Large Systems Sales Support Multics Project Office
Honeywell Information Systems Inc. Post Office Box 6000 (MS A-85) Phoenix, Arizona 85005
~
1975, Honeywell Information Systems Ine. File No.: 2L13This PLM is intended for use by those persons who wish to
analyze Multics crashes or various system anomalies. Since
problem analysis of this sort requires a working familiarity with many parts of the Multics system, it is presumed that the reader of this PLM has this familiarity.
The reader is warned at the outset that this manual is not intended to be a complete decision tree over which one may travel with a dump to arrive at the cause for the crash. Instead, it lists those items most generally referenced when analyzing a dump and gives some direction as to where to look next for the cause of the problem.
The System Debuggers' Handbook, Order No. AN87, should be
consulted for the detailed formats of status words, control unit
data, fault codes, and other information read or shared by
hardware. Also included therein are some formats peculiar to the
Multics software environment, such as stack frame formats. No
attempt is made to duplicate any of that information in this
manual. That publication is a crucial tool. in any attempt at
crash analysis.
The following PLMs are referenced frequently in this manual. cor convenience, their titles are shortened as follows:
System Tools. Storage System
Supervisor Input/Output System Initialization
Hultiprogramming and Schedu1ing System Debuggers' Handbook.
Tools PLM
Storage System PLM Supervisor I/O PLM Initialization PLM Multiprogramming PLM Debuggers' Handbook PLM
Hultics requires the use of a Front-End Network Processor
(FNP) to handle two-way information transmission between an ION
data channel and remote terminals. The FNPs referenced in this
document may be either DATANET 355 Front-End Network Processors
or DATANET6600 Front-End Network Processors; their use with the
Section I
Section II
Section III
Section IV
Section V
Section VI
CONTENTS
Crash Procedures • . . . • Returnin~ to BOS • • • Taking a Dump . . • . . . . . Dumping the Initializer Process
Processing an fdump . . .
Crash Analysis • . . . • . . • . Examination of Registers
Layout of Machine Conditions . • . . . Stack Header . . • . • . • •
Stack Frame . . . • . . . . Argument List . • • • . . . .
Crashes with No Message
Crashes with A Message . .
Major System Data Bases . • " . • . . .
System Segment Table . . • . . . •
SST Header • . . . • . . . • .
Core Map . . . • . . . • . • .
Paging Device Map . • • . • . Active Segment Table .
SST Analysis Tools . • . • . . . . Active Process Table .
The APTE . . . . • . • . . • • Fault Vector . . . .
Known Segment Table Linkage Section lock_seg . . . . PDS . • • . • • • •
Data Structure . . Trace Entry Types
Types of Crashes . . . . . . . .
Loops . . . . . • . . •
Page Control Crashes . . . • . Attempt to Terminate Initializer
Process . . . . • . . • . • .
Teletype DIM Problems . . . •
Section VII
Section VIII
CONTENTS (cont)
Hardware Problems . . . Bulk Store Problems 10M Problems . . . . Disk Problems . . . Memory Parity Errors
System Performance Degradation .
Command and Subroutine Descriptions check_sst . . . . copy_dump . . . .
copy_dump$set_fdump_num, copy_dump$sfdn
copy_out . . . . copy_salvager_output dump_pdmap . .
extract . . . .
ol_dump . . . .
online_dump . . . . od_cleanup
online_dump_355, od_355 patch_ring_zero . . . . print_apt_entry
print_aste_ptp . print_dump_tape ring_zero_dump .
copy_dump_seg_ . . . . .
format_355_dump_line_ . . . . format_355_dump_line_$line . . . . get_ast_name_
get_dump_ptrs_ . . . . od_pr in t_ . . . .
od_print_$op_fmt_line . . . .
od_print_$op_finish. . . . .
od_print_$op_new_seg . . . . .
od_print_$op_init . . . .
od_print_$op_new_page . . .
od stack_ . . . . online_355_dump_ . . . . print_dump_seg_name_ . . . . . print_dump_seg_name_$hard print_dump_seg_name_$get~ptr .
Figure 1-1. Figure 2-1. Figure 2-2. Figure 5-1. figure 5-2. Figure 5-3. Figure 5-4. Figure 5-5. Fip:ure 5-6. Figure 5-1. Figure 5-8. Figure 5-9. Figure 5-10. Figure 5-11. Figure 5-12. Figure 6-1. Figure 6-2. Figure 6-3.
Figure 6-4.
Table 5-1. Table 6-1. Table 6-2. Table 6-3. Table 6-4.
CONTENTS (cont)
ILLUSTRATIONS
Format of DUMP Partition ~ • . . . • • • . Format of Machine Conditions . . .
PL/I Descriptors . . . . ~ . . . . Layout of System Segment Table . . . .
Core Map Entry . . . •
Paging Device Map Entry . ~ . . . . Active Segment Table Entry . . . . tc_data . . . .
Ready List Format . 8 • • Format of ITT Message . . !"orma t of KSTE . . . -. .
Format of name in KST . . ~ . .
Association of Name with Link . . . . Format of Lock Entry in lock_seg . . . . . Format of Lock Array Entry . . .
Format of 6600 FNP 10M Fault Word . . . . . Format of Coded Interrupt Word
Format of Transaction Control Word for DIA . . . .
Format of tty_buf . . . .
TABLES
Wait Events . . . . Trace Type . . . . .
HSLA Trace Subtypes . Errors from tty_free
Errors from tty_inter . . 0 • •
SECTION I
CRASH PROCEDURES
This section covers the information necessary to understand how Multics crashes (i.e., returns to BOS), how dumps are taken, and how these dumps are processed.
,RETURNING TO BOS
There are six ways in which Multics can crash. The first,
and most common, way is for some type of fatal error to be
discovered by Multics. When this happens, a brief message that
describes the surface cause of the crash (e.g., LOCK NOT EQUAL
PROCESSID) is typed on the operator's console and then BOS is
reentered. To effect this reentry, syserr (which typed the
message on the operator's console) calls
privileged_mode_ut$bos_and_return. This program picks up the
interrupt pattern called scs$sys_trouble_pattern and executes a
SMIC instruction. The handler for this IIsystem trouble"
interrupt is the interrupt interceptor ii.
The first task performed by ii is to send system trouble
interrupts to any other processors that may be running. The
other processors take this interrupt and it is processed by l l .
However, ii sets a variable, trouble_processor, in its linkage
section so that when it handles the trouble interrupts on the
other processors, it recognizes this fact and does not get into a loop sending trouble interrupts.
After the initial processor has informed the other
processors of the impending crash, it saves all the system
controller masks for system controllers for which it is control
processor. In addition, the trouble interrupt machine conditions
on the Processor Data Segment (PRDS) are copied into
trouble_save_data on the PRDS. Both of these save operations are performed so that Multics may be restarted from BOS with a GO
command. Since this is generally not done in the case of a
crash, no more will be said about it at this time. As each
the initial processor, it saves the masks of system controller
for which it is control processor and copies the trouble
interrupt data to trouble_save_data on its PRDS.
Clearly only one processor can return to BOS and this processor is the boot load CPU. All other processors execute a DIS instruction in ii. Regardless of which processor is the initial processor to enter ~i, it is the bootload CPU that returns to BaS.
The method used to enter BOS is as follows: the boot load CPU loops for a while to allow all pending I/Ooperations to quiesce. Since this loop is inhibited, the lockup fault vector is patched to ignore any lockup faults taken during this loop. Once the loop is completed, the two instructions, an SCU and a TRA instruction pair, as picked up from location 4 of the BaS toehold (absolute location 4004) are patched into the DERAIL fault vector. The previous contents of this fault vector are
saved· prior to doing so. Finally, a DERAIL instruction'is
executed. Since the derail fault vector was patched, the SCU is done and BaS is entered in absolute mode via the TRA instruction. '(See the Bootload Operating System (BaS) PLM, Order No. AN74, for information about the BaS toehold and the steps taken by BaS when
entered at location 4004.) .
The second way that Multics can crash and enter BOS is for an error to occur that cannot be reported by asyserr message on the operator's console. These errors are the arrival of an interrupt while the processor is using the PRDS as a stack, a page fault while the processor is using the PRDS as a stack, certain faults while the processor is using the PRDS as a stack, or a spurious trouble interrupt. More information is provided later about these errors. When any of the above errors occur, control goes either immediately to the system trouble code of ii that was just described, or it gets to this code by the forcing of a sys_trouble interrupt. In either case, BaS is reentered as described above.
Another way that BaS can be entered is by an execute fault. An execute fault is caused by the depression of the EXECUTE FAULT button on any processor maintenance panel. The handler for this fault is, ii and the fault is treated in exactly the same way as a system trouble interrupt. In addition, the fault data stored by the execut~ fault is stored in the same place on the PRDS as the system trouble interrupt data.
Another way that BaS can be entered is by the manual execution of an XED instruction at location 4000 octal (the BOS toehold). The two instructions in the toehold are executed by placing an inhibited XED 4000 in the processor DATA switches (octal pattern 004000717200). The processor is put in MEM step mode and then the EXECUTE SWITCHES pushbutton is depressed once
and the STEP button is depressed several times. Then the
processor is taken out of HEM step mode and the STEP button is
depressed once more to cause the two instructions at location 4000, an SCU and TRA, to be executed.
It should be pointed out that of the last two ways mentioned for entering BaS, the execute fault is the normal way used to
crash the system. This would be done for example when it is
noticed that Multics is in a loop. The execute fault method
ensures that all processors are stopped via system trou~le
interrupts before returning to BaS. The manual XED of location
4000 is used when running only one processor and when it is
desired to start Multics again with a BaS GO command after
perhaps doing some patching or dumping of Multics from BaS.
It is also possible to return to BaS in a restartable manner during initialization, under control of patterns in the processor
DATA switches~ This causes the sending of a sys_trouble
interrupt to the boot load CPU from pmut$call_bos. For more
detai~s see the System Initialization PLM, Order No. AN70.
The final way that BaS can be entered is via an explicit 'call to hphcs_$call_bos, which may be invoked by the Initializer
bas command, or certain failures in administrative ring
initialization. Any sufficiently privileged process can'call
this entry from the user ring.
TAKING A DUMP
When BaS is entered at its toehold via any of the six ways just described, it saves the state of the processor and all live
registers. In addition, it copies the first 40000 octal
locations of the low-order memory to the BaS partition on disk so
that most BaS commands can run without destroying the Multics
core image. It should be noted that some BaS commands will
destroy the Multics core image (i.e., use memory above location 40000). These BaS commands should not be run if it is desired to preserve the Multics core image. These commands are LD355, SAVE, RESTOR, TEST, and LOADDM. If it is necessary to run one of these commands and yet still preserve the Multics core image, the BaS
commands CORE SAVE and CORE RESTOR can be used to save the
Multics core image on tape. See the BaS PLM for details.
There are two primary ways to dump Multics. The first way is to use the BaS DUMP command as described in the BaS PLM. The DUMP command dumps various segments of one or more processes to either the line printer or tape. The BaS DMP355 command can be used to dump the DATANET 6600 Front-End Network Processor (FNP)
on the printer or tape. This, of course, is a rather
time-consuming process and lengthens the time involved in
bringing the system up again after a crash. There are, however,
times when this must be done. Most typical is the case where
Multics crashes before the previous FDUMP command (see below) has
been processed. In this case, the most reasonable alternative
bringing command. VIII.
Multics back up by using
The print_dump_tape command
the print_dump_tape (pdt)
is described in Section
The more usual procedure for taking dumps is to use the BOS FDU~·1P (Fast DUMP) command. FDUMP writes the t1ultics "core image" out to the DUMP partition on disk. The dump is preceded by a
small directory that describes where to find various segments.
The term "core image" is used inexactly in this case. What
actually happens is that the FDUMP command scans the Active
Process Table (APT) (descFibed partially in Section V and more
completely in the Multiprogramming PLM, and dumps all processes
that are in the running state, have the dbr_Ioaded bit on in
their Active Process Table Entry (APTE), or have the stop_pending
bit on in their APTE. If FDUMP is called with the SHORT
argument, those processes with the dbr_Ioaded hit on in their
APTE (usually one per processor) are dumped in the normal fashion
(i.e., all write permit segments are dumped) and all other
processes have their descriptor segment, Process Data Segment
(PDS), and Known Segment Table (KST) dumped. If FDUMP is called ~ith the LONG argument, all processes are dumped in the normal fashion.
To dump a process, the FDUMP command scans the descriptor
segment of that process and dumps each segment with the write
permit bit on in its Segment Descriptor Word (SDW). Since all
processes share at least the segments of ring 0, FDUMP only dumps a segment once, even if all processes being dumped have 'an SDW with the write permit bit on for that segment. Of course, not all pages of each segment are in main memory, so FDUMP interprets each Page Table Word (PTW) for a segment. If the fault bit is off, FDUMP can dump that page of the segment from core. If the fault bit is on, FDUMP interp~ets the secondary storage or Paging Device address that is stored in the PTW and it reads the page from that location and dumps it.
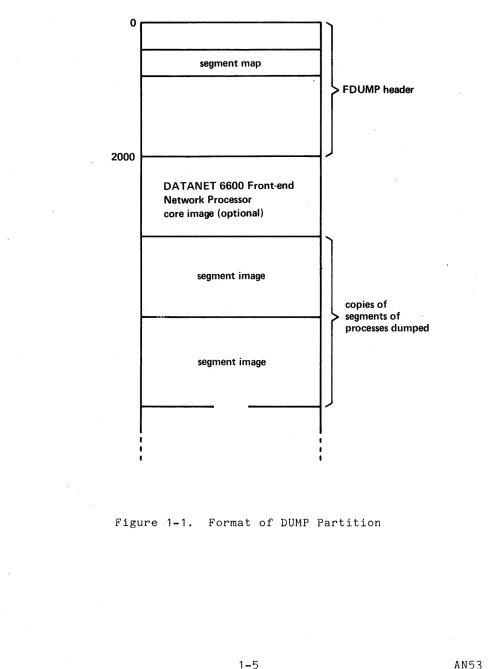
Figure 1-1 below depicts the layout of the DUMP partition
following execution of the BOS FDUMP and FD355 commands. Once
the FDUMP and/or FD355 commands are executed, standard crash
recovery procedures can be initiated (e.g., Emergency Shutdown
(ESD), Salvager, etc.) and the system bootloaded again. To
process the fdump (the image produced by the FDUMP command), the command copy_dump (described in Section VIII) must be used. This command uses the gate hphcs_ and therefore is generally executed by Initializer.SysDaemon, to determine whether the DUMP partition
o
2000
segment map
DATANET 6600 Front-end Network Processor
core image (optional)
segment image
segment image
FDUMP header
copies of segments of processes dumped
[image:11.612.70.561.68.737.2]contains a valid dump (dump.valid = "1"b--see include file bos_dump.incl.pI1). If it does, the Multics fdump is copied into one or more segments in the directory >dumps. These segments
have the name date.time.n.erf_no where date is in the form
MMDDYY, time is in the form HHMMSS, n is a number, starting at 0, incremented by one each time an FDUMP is taken, and erf_no is the error report form number as extracted from dump.erfno. If there is a valid FNP dump (dump.valid_355
=
"1"b), it is copied into a segment in )dumps named date.time.O.erf_no.355. The error reportform number is maintained (incremented each time) by the BOS
FDUMP command. The number can be set to a new value (e.g., 1) at any time by typing FDUMP n where n is the new error report form
(ERF) number (crash number).
DUMPING THE INITIALIZER PROCESS
Although the FDUMP command is the normal way to take a dump, there - is one important circumstance when FDUMP should not"be used. When the initializer process runs into trouble (e.g., will .not respond to any commands) and the system must be crashed, the
crash should usually be brought about by an execute fault. Of
course, whatever process is running on the bootload processo~ is the process that actually returns to BOS a~ described above. If an FDUMP were to be taken, the initializer process would only be dumped if it were running on any of the processors. Otherwise~ the only way to cause it to be dumped would be to use t~e LONG argument to FDUMP. This dumps every process. It also produces a massive dump if a number of processes exist in the system.
A better way to ensure that the initializer process is
dumped is to dump it using the BOS DUMP command. To do this, one must switch the Descriptor Base Register (DBR) value used by BOS. This value is set initially to the DBR value of the process that
returned to BOS. To find the DBR value of the initializer
process, one must use the BOS PATCH command. The DBR for any
process is stored in its APTE at the symbol apte.dbr (see include file apte. incl. pl1 ). (A further description of an APTE is found in Section V.)
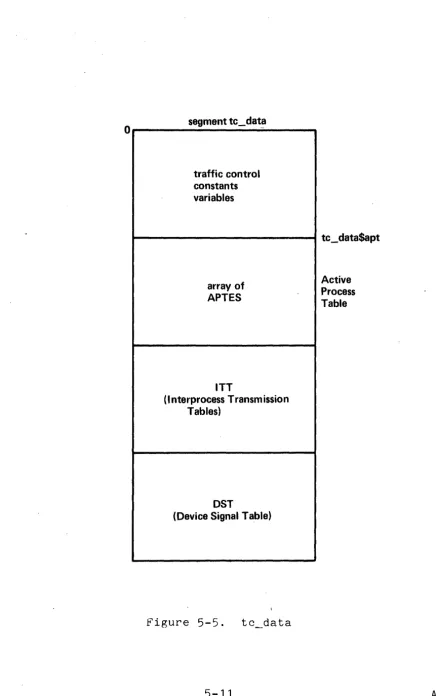
The APTE for the initializer process is always the first
APTE in the APT. One may find the offset of the first APTE by
looking at the value assigned to the segdef apt in the data
segment tc_data. Given these listings or offsets, it is possible to look at tc_data with the PATCH command and find the DBR value
for the initializer process. Then the DUMP command should be
used. Use the DBR command of DUMP to set the BOS DBR value to the DBR of the initializer. Then take a dump of the initializer process on the printer or tape.
PROCESSING AN FDUMP
If a crash occurs, the Multics and possibly the FNP core
images are in several segments in the directory )dumps. There
are two commands that can be used to print these dumps. One
command, online_dump, or od, is used to print the Multics dump. The other command, online_dump_355, or od_355, is used to process the FNP dump. These command descriptions can be found in Section VIII.
Various useful subroutines used by the online dump facility are also discussed in Section VIII.
SECTION II
CRASH ANALYSIS
This section provides some basic knowledge necessary to
anyone analyzing a dump regardless of the cause for the crash.
EXAMINATION OF REGISTERS
The first block of information available in either an fdump or a dump printed by the BOS DUMP command is the state of various
processor registers. The first register of interest is the
Procedure Segment Register (PSR). The PSR contains the segment
number of the procedure that actually returned to BOS. In all
but one case, this should be the segment number of ii. The ,only case in which this is not true is when BOS is entered by 'a manual
transfer (XED of location 4000). In this case, the PSR is at
whatever it is when the processor is stopped to perform the
manual execution of the XED instruction. Listed along with PSR
is the instruction counter (,IC), the Ring Alarm Register (RALR), the A and Q registers, the exponent register, the Interval Timer register, and the index registers. In the case of entry to BOS from l l , only the Interval Timer register has any real possible
interest.
Since Multics can enter BOS and be subsequently restarted
with a GO command, BOS saves all registers. It also saves all
interrupts that come in after Multics has entered BOS. These
interrupts are set again (via a SMIC instruction) if a GO command is executed. The interrupts are printed in the dump in the form of the word INTER followed by 12 octal digits. The first 32 bits
of the 12 o~tal digits correspond to the setting of interrupt
cells 0-31.
Following the interrupt word in the dump are the values in each of the, eight pointer registers. When BOS is entered by l l ,
pointer register 2 (bp) points to the actual machine conditions that were stored when the cause of the crash actually happened.
For example, in the case of a crash with a message, pointer
After the pointer registers, the contents of the PTW and SDW
associative memories are printed. This data is printed in an
interpreted format. Figure 1-10 (SDW Associative Memory Register Format), Figure 1-11 (SDW Associative Memory Match Logic Register
Format), Figure 1-12 (PTW Associative Memory Register Format),
and Figure 1-13 (PTW Associative Memory Match Logic Register
Format) in the Debuggers' Handbook PLM contain the layout of the
associative memories as stored in memory. . Generally, the
associative memory contents are of little use except in debugging hardware problems. One thing to check for if associative memory
problems are suspected is nonunique usage counts (i.e., two
associative memory slots having the same usage number). Another
possibility is for two slots to have the same contents (e.g., two
slots in the SDW associative memory pointing to the same
segment) .
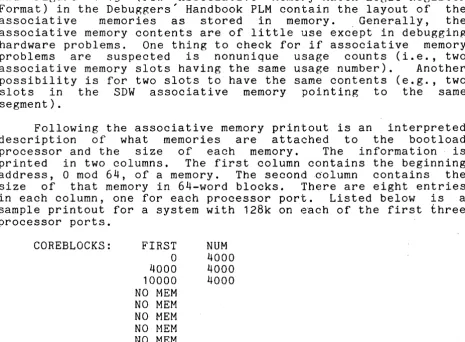
Following the associative memory printout is an interpreted
description of what memories are attached to the boot load
processor and the size of each memory. The information is
printed in two columns. The first column contains the beginning address, 0 mod 64, of a memory. The second .column contains the size of that memory in 64-word blocks. There are eight entries in each column, one for each processor port. Listed below is a sample printout for a system with 128k on each of the first three processor ports.
COREBLOCKS: FIRST
a
4000 10000 NO MEM NO MEM NO MEM NO MEM NO MEMNUM 4000 4000 4000
Following the display of the memory layout is a printout of the memory controller masks for the memory on each processor port. A memory mask is stored as 72 bits. Bits 0-15 contain the settings of bits 0-15 of the interrupt enable register for a memory. Bits 32-35 contain bits 0-3 of the port enable register for a memory. Bits 36-51 contain the settings of bits 16-31 of the interrupt enable register. Bits 68-71 contain bits 4-7 of the port enable register.
The last set of registers that are stored are the four sets of history registers. These history registers are stored for the
Operations Unit (OU), Control Unit (CU), Appending Unit (APU),
and De~imal Unit (DU) or EIS portion of the processor. See Figure 1-34 (CU History Register Format), Figure 1-35 (OU History Register Format), Figure 1-36 (APU History Register Format), and "DU History Register Format" in Section I in the Debuggers' Handbook PLM, for formats of these history registers.
[image:16.615.77.543.136.478.2]The last set of information that is printed with the registers is an interpretive layout of the descriptor segment. Each SDW is printed in an expanded format. Along with the SDW is printed the reference name(s) of the segment. For a directory, this is a full pathname. Segments with null reference names only have no names printed with the SDW. SDWs that are all zero (directed fault zero or segment fault) are not printed.
LAYOUT OF MACHINE CONDITIONS
vlhenever any type of fault or interrupt occurs, the state of the processor is saved. This involves saving all live registers ~nd the state of the Control Unit. In all cases, the fault data is saved as shown in Figure 2-1 below. The format of the EIS pointer and length data, as stored by the SPL instruction, is found in Figure 1-26 (EIS Pointers and Lengths Format, Word 0), Figure 1-27 (EIS Pointers and Lengths Format, Word 1), Figure 1-28 ~EIS Pointers and Lengths Format, Word 2), Figure 1-29 (EIS Pointers and Lengths Format, Word 3), Figure 1-30 (EIS Pointers and Lengths Format, Word
4),
Figure 1-31 (EIS Pointers and Lengths Format, Word 5), Figure 1-32 (EIS Pointers and Lengths Format, Word 6), and Figure 1-33 (EIS ,Pointers and Lengths Format, Word 7) in the Debuggers' Handbook PLM.(mod 8 boundary)
01
,
'
20
30
40
50
60
8 POINTER REGISTERS AS STORED BY SPRI INSTRUCTION
REGISTERS AS STORED BY SREG INSTRUCTION
CONTROL UNIT/APU STATE AS STORED BY SCU INSTRUCTION
SOFTWARE FAULT DATA AS DESCRIBED IN mc.incl.p11
Ers POINTERS AND LENGTH DATA AS STORED BY SPL INSTRUCTION
There are several items in the machine conditions that
should be inspected when hardware troubles are suspected. In
case of ring vioLations, the ring fields in the SCU data, PPR.PRR
(the ring of execution) and TPR.TRR (the ring of reference)
should be checked. Another value to examine is the RALR that is
stored by the SREG instruction. The value in the RALR should
never be greater than or equal to PPR.PRR. The appending unit status bits (Figure 1-38 (scu Data Format, Word 0), Figure 1-39 (scu Data Format, Word 1), Figure 1-40 (scu Data Format, Word "2),
Figure 1-41 (scu Data Format, Word 3), Figure 1-42 (scu Data
Format, Word 4), Figure 1-43 (scu Data Format, Word 5),
Figure 1-44 (scu Data Format, Word 6), and Figure 1-45 (scu Data
Format, Word 1) in the Debuggers' Handbook PLM) are also of
interest when attempting to discover what cycle was being
executed by the appending unit when an APU produced failure or fault occurred4 Another point of interest is that when a fault is taken by the even instruction of an even/odd instruction pair, words six and seven of the SCU data hold the two instructions. In the case of a fault following some levels of indirection, the
even instruction (word six of the SCU data) may exist in an
altered form since some address modification may have been
performed before taking the fault. In the case of a fault taken by the odd instruction of an even/odd instruction pair, word, six of the SCU data contains the odd instruction although it may have had some address modification done as just described. Word seven may contain that instruction or a later instruction due to the instruction fetch lookahead feature.
One final note on the addresses and instructions in fault data: certain classes of faults (e.g., parity, store, some cases of command) are detected by the CPU port logic while processing a data request generated by some other unit of the processor. Due
to the internal overlap of the CPU, the instructions being
processed by the control unit may be several instructions after the instruction that caused the store or other fault. Hence, SCU
data for these faults may not be· taken as deterministically
specifying the faulting reference.
STACK HEADER
Another data base that a person doing cI~ash analysis must be familiar with is the stack. Ring 0 uses both the PDS and PRDS as stacks, and each ring of each process has a stack. (The stack assigned to ring 0 in this assignment is the PDS.) Every stack has a header. The first sixteen words of the stack header are essentially unused and are not discussed further. There are two items in the stack header that are of interest to someone reading a dump. The stack begin pointer points to the first valid stack frame on the stack. On the user ring stacks, the first frame is usually immediately after the stack header. On the PDS and PRDS
however, there are intervening data items. The other item of
general interest in the stack header is the stack end pointer. It points to the location of the stack where the next frame may
be started. Figure
7-5
(Stack Header Layout) in the bebuggers' Handbook PLM depicts the layout of the stack header. There are three other important pointers in the stack header. The BAR mode sp (stack header location 32 octal) is a place to store the stackpointer register (PR6) before entering BAR mode. This is done
since BAR mode programs can validly destroy the word offset
portion of the stack pointer register. However, the stack
pointer is needed by the signaller, so it is stored here so that it can be reloaded if a fault is taken by the BAR mode program.
The translator operator tv pointer is a pointer to a transfer
vector of language operator pointers. The PL/I operator pointers (call, push, etc.) have their own locations in the stack header but the transfer vector exists so the pointers to operators for other translators (e.g., BASIC) can be found in a defined way.
The ALM segment operator_pointers_ contains the current transfer
vector. Finally, the unwinder pointer is provided so that an
unwinder program can be found in each ring.
STACK FRAME
The other element of a stack that one must be familiar with is the stack frame. The first forty wor~s are reserved in,each
stack frame (see Figure 7-6 (Stack Frame Layout) in the
Debuggers' Handbook PLM). The first sixteen words can be used
for saving the active pointer registers when making a call to
another program. The ALM CALL macro saves its pointer registers here and restores them upon return. Since PL/I in general does not depend upon registers across a call, it does not save all the
pointer registers. Words sixteen through nineteen contain the
pointers that thread the stack frames together on a stack in a forward and backward manner. One can start from the stack begin pointer in the stack header and using the forward pointer in each frame, it is possible to "trace" the stack. Similarly, starting
at any given stack frame, it is possible to trace forward or
backward using the forward or backward pointers in each stack
frame.
In general, the backward pointer of each stack frame is a standard ITS pointer. In the case of some special frames, bits 24-29 are used for flags. Listed below are the flags:
bit 24 on if frame belongs to signal.
bit 25 on if this is a signal caller frame.
bit 26 on if next frame is signaller , s.
bit 27 on if this frame was made by the linker.
Used for trap before link and trap before
first reference.
bit 28 on~if this frame belongs to a program that is
pa t of the support environment (e.g. ,
signal_) .
bit 29 on if a condition is established in this
At location 24 octal is a pointer to the return point in the program that created the stack frame if that program called out. This pointer is used by the return operator to return to the caller. At location 26 octal is the entry pointer. This is used by the entry sequence code of PL/I. Upon entry to a PL/I program, that program calls the entry operator of PL/I. The entry point to the PL/I program is saved at this double word. Location 32 octal contains a pointer to the operator segment for most translators. However, ALM programs use this double word" as a place to store the linkage section pointer. When an ALM program does a call, the call operator reloads pointer register 4 (the linkage section pointer) from this location (it is saved there by the ALM push operator). The reason it is "reloaded before calling is in case the ALM program is calling a Version 1 PL/I program that is bound into the same segment as the ALM program. In this case, the standard Version 1 entry sequence that loads the linkage section pointer register is not invoked so that the ALM program must ensure that :Lt is correct. When Version 1 PL/I programs cease to exist, this will no longer be a requirement.
Following the entry pointer is a pointer to the argument list of the procedure that owns the stack frame. The form~t of an argument list is discussed below. The" next two words at locations 34 and 35 octal are reserved. At location 36 octal in
the stack frame are two 18-bit relative addresses. These
addresses are relative to the base of the stack frame. The first relative address points to a series of 16-word on unit blocks in the stack frame. Each on unit block contains a 32-character condition name, a chain pOinter, and some flags. Listed below is the PL/I declaration for an on unit block:
dcl 1 on_unit based aligned, 2 name ptr,
2 body ptr,
2 size fixed bin,
2 next bit (18) unaligned, 2 flags unaligned,
3 p11_snap bit (1) unaligned, 3 p11_system bit (1) unaligned, 3 pad bit (16) unaligned,
2 file ptr;
Details of this may be found in the Limite~ Command Environment
PLM, Order No. AN78. The second relative address is for
compatibility with older systems and is discussed no further in
stack header this document. At location 31 in the
entitled operator return offset.
consists of two 18-bit halves. The
translator ID. This is a number
compiled the· program that owns the
In fact, this
left-most 18 bits
that tells what
stack frame. The are as follows:
o
Version 2 PL/I 1 ALM2 Version 1 PL/I
3 signal caller frame
4
signaller frameis a word word really contain the translator various IDs
The right half of the word holds the address in the program at which a called operator returns. This is useful in debugging,
for it describes the return address for certain calls to
p11_opera tors_. If a crash occurs' and the machine condi tions
show that some fault or interrupt was taken by p11_operators_, XO contains the return address for the operator that took the fault
or interrupt. If the operator was forced to use XO, then the
operator return pointer in the stack frame contains the return
address. This cell is zeroed when an operator restores XO from
it. Hence, if this cell is nonzero, .it contains the return
address. If zero, XO contains the return address. Given this,
one can look at the program that called the operator to determine why the fault occurred.
The last reserved area in the stack frame is at location 40
octal. Here the registers are stored by an SREG instruction.
Again, PL/I does not generally save registers since it does not
depend upon their contents across a call. The ALM CALL macro
however saves the registers here in stack frame. A person
tracing a stack should be aware of course that certain programs do not have stack frames. These programs are most typically ALM
programs that do not call the push operator. These programs
"borrow" the stack frame of' their caller and hence should not write into it. Such programs cannot perform standard calls since the call operator writes into the stack frame.
ARGUMENT LIST
Every standard Multics call must construct a standard
argument list. Pointer register 0 (ap) is set to point to the
argument list. The callee saves this argument pointer in his
stack frame as described previously. The argument list format is
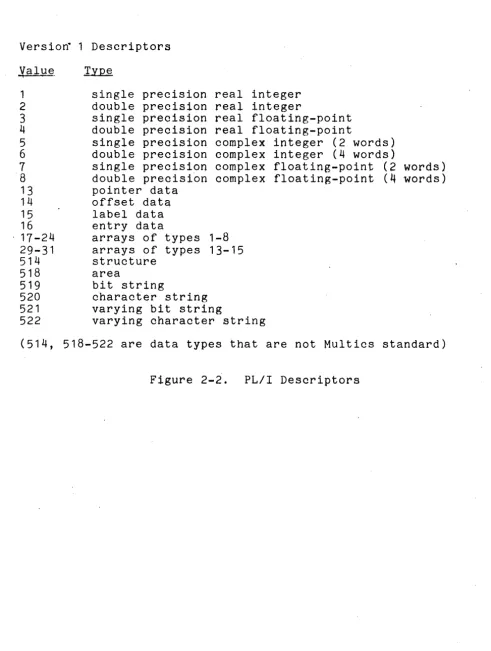
described below. Figure 2-2 lists the types of argument
descriptors.
The argument list must begin in an even word boundary. The pointers in the argument list need not be ITS pointers, however,
they must be pointers that can be indirected through. Hence,
The directly. for the follows:
F
type
p
nd
i'th argument pointer points at the i'th argument The i'th descriptor pointer points at the descriptor i'th argument. The format for a descriptor is as
is a flag specifying that this is a new type descriptor. It is a 1 if it is a PL/I Version 2 descriptor and 0 for the old format descriptors.
specifies the data type of the variable being
described. The PL/I documentation contains a
mapping of the actual codes used.
indicates, if 1, that the data item is packed.
is the number of dimensions of an 'array. The array bounds follow the descriptor head in a format described in the PL/I documentation.
size holds the size (in bits or characters) of string
data, the number of structure elements for
structure data, or the scale and precision (as two, 12-bit fields) for ari~hmetic data.
Versio~ 1 Descriptors
Value
1 2 3 4
5
6 7 8 13 14 15 16 17-24 29-31 514 518 519 520 521 522
single precision real integer double precision real integer
single precision real floating-point double precision real floating-point
single precision complex integer (2 words) double precision complex integer (4 words)
single precision complex floating-point (2 words) double precision complex floating-point
(4
words) pointer dataoffset data label data entry data
arrays of types 1-8 arrays of types 13-15 structure
area
bit string
character string varying bit string
varying character string
(514, 518-522 are data types that are not Multics standard)
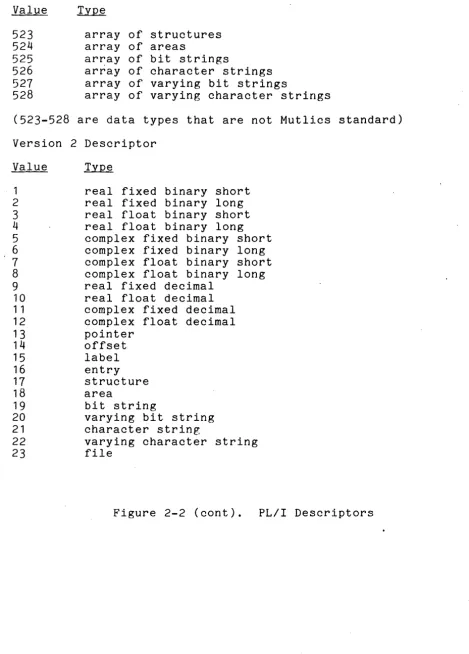
[image:23.618.66.557.72.723.2]Value ~
523 array of structures
524 array of areas
525 ar~ay of bit strings
526 array of character strings
521 array of varying bit strings
528 array of varying character strings
(523-528 are data types that are not Mutlics standard)
Version 2 Descriptor
Value 1 2 3 4 5 6 1 8 9 10 1 1 12 13 14 15 16 11 18 19 20 21 22 23
real fixed binary short real fixed binary long real float binary short real float binary long complex fixed binary short complex fixed binary long complex float binary short complex float binary long real fixed decimal
real float decimal complex fixed decimal complex float decimal pointer offset label entry structure area
bit string
varying bit string character string
varying character string file
Figure 2-2 (cont). PL/I Descriptors
[image:24.618.66.535.58.711.2]SECTION III
CRASHES WITH NO MESSAGE
This section describes a deterministic algorithm for
ascertaining the immediate reason for a system return to BaS with no me~sage. It is the intent of this section and the next to describe an appropriate course of action for determining 'the immediate cause of a crash, when presented with a dump.
The first quantity to inspect is the PSR in the registers printed by BOS, or online_dump. If the P$R contains the segment number of any segment other than the interrupt interceptor (ii), then the system did not return to BaS of its own volition, and a manual transfer to BaS (XED 4000 or XED 4002) was made by the
operator. (Specifically, the PSR/lnstruction counter should
point to the instruction in i i following the derail instruction that causes the return to BaS).
If the PSR/ICTC points to the correct place in i i , pointer register 2, as printed by BaS or online_dump, points to the machine conditions that caused the bootload processor to return to BaS. If the fault/interrupt code in the second word of the SCU data in these machine conditions is anything other than a system trouble interrupt (octal 44 as i t appears there), these machine conditions represent one of the following cases:
1. An execute fault was taken by the boot load processor, i.e., the operator pressed the EXECUTE FAULT pushbutton on this processor. The fault/interrupt code is 37, octal.
2. An interrupt was taken by the interrupt interceptor (ii) while running on the PRDS. The value of sp (pointer register 6) in these machine conditions is an address on the PRDS, and the fault/interrupt code is
even (interrupt). A masking problem should be
suspected.
If the fault/interrupt code in the SCU data pointed to by pointer register 2 as given by BOS reflects the sys_trouble code,
some other module or processor caused this interrupt. All
modules that send a sys_trouble interrupt execute NOP
instructions (octal 000 000 011 000, but sometimes with direct (03 or 07)' modifiers) immediately after sending this interrupt. Hence, if the SCU even/odd instruction words (6 and 7) do not have Nap instructions, one should assume that some processor other than the boot load processor first sent a sys_trouble interrupt. The machine conditions at prds$sys_trouble_data for all running processes should be inspected to find one that was interrupted out of Naps. (It is possible, however, for a processor to be executing some Nap loop, such as certain locking code at the time a sys_trouble interrupt is received from another
processor. If, in a multi-CPU dump, many such sets of
sys_trouble data are found, this should be suspected, and the set of conditions that identifies NOP after a SMIC instruction sending sys_trouble found.)
When the processor that started the sys_trouble broadcast has been found, the program that sent the first sys_trouble interrupt must be identified. This can be done by inspecting the
PSR in the machine conditions for this first sys_trouble
interrupt. If it is the segment number of the fault interceptor (fim), some fault was encountered that required paged programs to handle properly, while running on the PRDS. Pointer register 2 in these machine conditions points to the machine conditions stored at the time of the fault. (If such a fault shotild happen with the page table lock set while running on a temp-wired PDS, the fim does not detect a problem but attempts to process the fault, usually causing a page fault with the page table lock set, with a resulting crash message, "PAGE: MYLOCK ERROR ON GLOBAL LOCK". In later systems, the fim checks for this case and sends sys_trouble.)
If the PSR identifies bound_page_control, or wired_fim in
earlier systems, a page fault was taken in an invalid
circumstance. Pointer register
a
in the system trouble machine conditions points to the page fault machine conditions.If the PSR identifies privileged_mode_ut (in bound_priv_1 in later systems) an explicit call was made to pmut$call_bos. This is always done in the case of fatal crashes with a message, in which casesyserr makes this call. One should identify the owner of the stack frame pointed to by sp (pointer register 6) in the sys_trouble data. By owner, we mean the procedure indicated by the return pointer (location 24 octal). (pmut does not push a frame in this case.) If the owner is bound_error_wired (which contains syserr) then a call was probably made to print out a
crash message. The arguments to syserr in a. precedin~ frame
should be inspected. In this case, either the message was
printed out by the operator's console, or some difficulty may
have been encountered in trying to print it out. Otherwise, it may be assumen that privileged_mode_ut was called by some program
in the outer rings, and a stack trace should determine the
SECTION IV
CRASHES WITH A MESSAGE
When Multics crashes after printing a message on the
operator's console, that message is always printed by syserr.
After printing the message, syserr calls
priviieged_mode_ut$bos_and_return (in bound_priv_1), which sends a system trouble interrupt to the current processor. The receipt . of this system trouble interrupt sends similar interrupts to all other processors in the system. When analyzing a dump, look at the system trouble machine conditions on ~ROS of each processor. One set of such machine conditions has a PSR equal to the segment
number of bound_priv_1. In addition, the. even and odd
instructions in the SCU data are both NOP instructions since privileged_mode_ut executes NOPs waiting for the system. trouble interrupt to go off.
Once the correct machine conditions have been found, pointer register 6 (the stack pointer) contains a pointer to the syserr stack frame. If the segment number in pointer register 6 is for the PROS, the previous stack frame belongs to the caller of syserr. If, however, the segment number is for the POS, syserr uses a different convention. syserr makes its stack frame at location 30000 octal on the POSe It does this so that possibly valuable stack history is not overwritten by its stack frame. This would happen if it laid its frame down right after the frame of its caller. An examination of the stack frame at 30000 shows
that it has two frames following it. The first is for
wire_stack, a program that wires pages of the POS so that syserr does not take a page fault running on the PDS. The second is for
syserr_real, the program that actually prints the message.
SECTION V
MAJOR SYSTEM DATA BASES
This section describes those parts of the system data bases that one might wish to examine after a crash.
SYSTEM SEGMENT TABLE
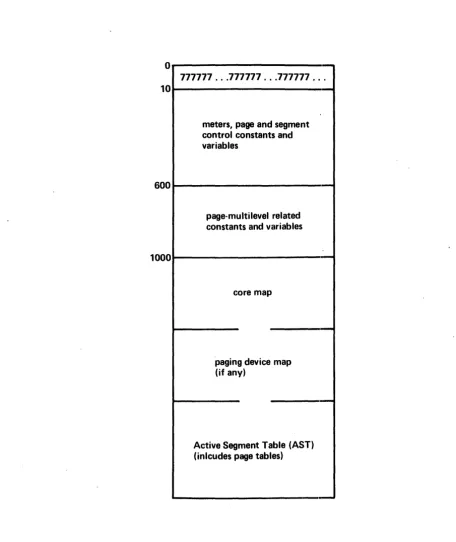
The System Segment Table (SST) is a variable size (via
configuration card) unpaged segment. It holds all the-page
tables in the system. In addition, it holds control blocks for
core management, for paging device management, and for active
segment management. Many of the data items in the SST contain
the addresses of other items. These addresses are expressed as
18-bit relative pointers to the SST. Figure 5-1 below gives the general layout of the SST.
SST Header
The SST header consists of various oontrol variables and
meters. The meters are defined in the include files sst.incl.p12 and cnt.incl.p11. These meters are not discussed further in this document. It would be useful to have a copy of this include file
in hand before reading further. The first item of interest in
o
777777 ... 777777 ... 777777 ... 10
meters, page and segment control constants and variables
600
page-multilevel related constants and variables
1000
core map
paging device map (if any)
Active Segment Table (AST) (inlcudes page tables)
Figure 5-1. Layout of System Segment Table (SST)
[image:32.618.61.518.85.628.2]Following the page table lock is the AST lock (sst.astl). This lock is generally used only by segment oontrol. Instead of being a loop lock, the AST lock is a wait lock. This means that if a process finds the AST lock locked, it gives up the processor and informs the traffic controller that it wishes to WAIT on this lock. When the process that locked the AST lock is finished, it
notifies all processes that are waiting on the lock. The
wait/notify mechanism and locking mechanism are described in the
Multiprogramming and Scheduling PLM, Order No. AN73. The SST
variable, sst.astl_event, contains the event upon which processes contending for the AST lock should wait~
The next item of interest is the pointer to the beginning of
the AST, sst.astap. As described below, there is a page table
following each ASTE. The maximum size of a page table is 256
PTWs. Clearly it would be wasteful to allocate a maximum size
page table for every active segment. Consequently, the ASTEs are broken up into pools where all the ASTEs in a pool have the same numbe~ of PTWs. The current pool sizes are 4, 16, 64, and 256. Each element in the array sst. level consists of a pointer to the ·used list (described below) of ASTEs of a pool, and the number of
ASTEs in the pool. There are also special ~ools for various
classes of supervisor and initialization segmen~s (see· the
Storage System PLM, Order No. AN61 and the Initialization PLM).
The next item of general interest in the SST header is the set of control words for the core map. The variable sst.cmp is a pointer to the start of the core map, and sst.usedp is a relative
pointer to the least-recently-used core map entry of the used
list (described briefly below and fully in the Storage System
PLM. Another variable of interest is sst.fsdctp, a pointer to
the ASTE for the FSDCT. There is also a pointer to the ASTE for the root in sst.root_astep. There is room now in the header for
a block of meters. Following the meters is a block of
information used in management of the paging device. The
variable sst.pdmap is a pointer to the paging device map in the SST, sst.pdhtp is a pointer to the paging device hash table, and sst.pdusedp points to the least-recently-used entry of the paging device used list.
Core Map'
forward thread backward thread
I I
I
device address I I
d· Id flags
I I
PTW pointer astep
(Release 2.2 and later)
double-write device address
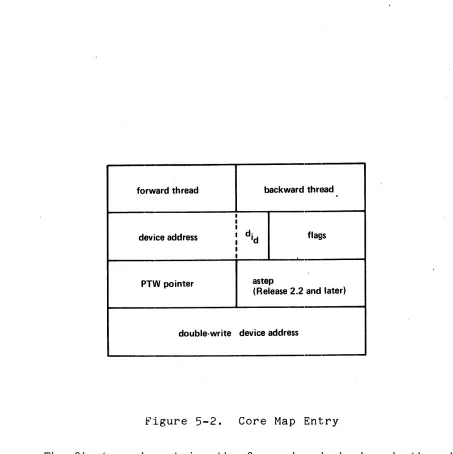
Figure 5-2. Core Map Entry
The first word contains the forward and backward threading pointers. These pointers (actually, they are addresses relative to the base of the SST) are used in the implementation of the Least ·Recently Used (LRU) algorithm for core management. The header variable, sst.usedp, points to the head of this circular list and in fact points to the CME that represents the block of core least recently used. The LRU algorithm is described fully in the Storage System PLM. One important thing to be checked in a dump analysis is that the CMEs are all threaded together
correctly. In Release 2.2 and later systems, CMEs for
out-of-service pages and RWS (read-write sequence) buffers are
Dot threaded in.
[image:34.612.73.526.60.514.2]Each CME holds the device addres~ for the page that resides in the core block represented by that CME. A device address
consists· of an 18-bit record number and a 4-bit device
identification. (The first bit of this device ID indicates the paging device.) The one exception is when the page occupying the core block associated with the CME is a new page and has not yet been assigned a disk address. In this case, a null device address is stored as the device address. Null device addresses may also appear in PTWs. Null device addresses are coded ·for debugging purposes to be able to tell which program created the null address. Listed below are the null addresses (any address greater than 777000 octal is considered to be a null address):
777777 777001 777002 777003 777004 777005 777006 777007 777010 777011 777012 777013 777014 777015
created by append
created by pc$truncate created by pc$truncate created by salv_check_map created by salv_check_map created by aalv_truncate created when page is zero created by pc$move_page_table created by pc$move_page_table created by get_aste
created by make_sdw created by deactivate created by move_file_map
created when page is bad on paging device
Listed below are the Multics device ID numbers:
1 Bulk Store 2 D191
3 E191 4 D190 5 E190 6 D181
If the paging device indicator is not on, then the device address is a disk address. The only consistency check one can make in this case is to look at the PTW pointed to by the PTW pointer'in the CME and make sure that the core address in the PTW corresponds to the core block represented by the CME. During a read/write· sequence, the PTW pointer is replaced by a pointer to a Paging Device Map Entry (PDME). A simple algorithm to do this is:
If this relationship is not tru~, then either a read/write sequence is in progress (in which case the PTW pointer no longer points to a PTW, but to a PDME), or there is an inconsistency in the SST. It can easily be determined if a read/write sequence is in progress since there is a flag in the CME (cme.rws as defined in cmp.incl.pI1) that indicates this.
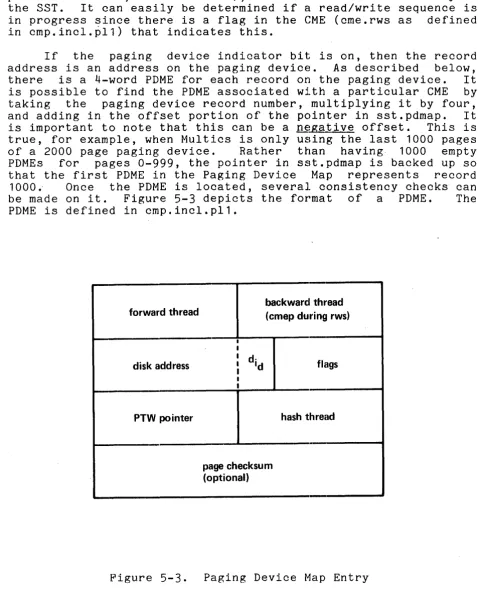
If the paging device indicator bit is on, then the record address is an address on the paging device. As described below, there is a 4-word PDME for each record on the paging device. It is possible to find the PDME associated with a particular CME by taking the paging device record number, multiplying it by four, and adding in the offset portion of the pointer in sst.pdmap. It is important to note that this can be a negative offset. This is true, for example, when Multics is only using the last 1000 pages of a 2000 page paging device. Rather than having· 1000 empty PDMEs for pages 0-999, the pointer in sst.pdmap is backed up so that the first PDME in the Paging Device Map represents record 1000.- Once the PDME is located, several consistency checks can be made on it. Figure 5-3 depicts the format of a PDME. The PDME is defined in cmp.incl.pI1.
backward! thread forward th read (cmep during rws)
I
I
I d·
disk address I Id flags I
I
t
PTW pointer hash thread
page checksu m (optional)
Figure 5-3. Paging Device Map Entry
[image:36.615.70.549.98.690.2]One check to be made is to make sure that the PTW pointer points to the same PTW as the CME. Another check is to see if the device address is for a disk address. If not, there is an error. Other checks are listed below.
Paging Device Map
The Paging Device Map directly follows the core map in the SST. It has a very similar function in that i t is used to manage the 1024-word pages on the paging device in such a manner that the least recently used page on the paging device is the one selected for removal when a new page must be placed on the paging device. This removal process is called a Read-Write Sequence (RWS). It involves reading a page from the paging device and writing i t to its secondary storage (disk) address. It is presumed that the reader is familiar with the use of the paging device as described in the Storage System PLM. There are various consistency checks that can be made on the Paging Device Map. First, all PDMEs must be correctly forward and backward threaded. 'The thread starts with the PDME pointed to by sst.pdusedp. There is one exception to this rule. When a RWS is in progress for a page, its PDME has a zero forward pointer and its back pointer contains the address of the associated CME. Both the CME and the PDME should have the RWS flag on (cme.rws and pdme.rws in cmp.incl.p11).
Another" consistency check one can make is to see if the secondary storage address stored in the PDME is incorrect. One can do this by applying the paging device hashing algorithm to that secondary storage address to see if the PDME in question is on the hash thread. As described in the Storage System PLM, when the paging device hashing algorithm is applied to a disk address, a PDME address is produced. If the disk address in question is not stored in that PDME, the value in pdme.ht is the address of another PDME to look at. Thus, there exists a thread of PDMEs all of which hold disk addresses that produce the same value when the paging device hashing algorithm is applied. To perform the
consistency check, take the 18-bit secondary storage record
Another useful consistency ciheck is to c6nfirm the correctness of the PDME, PTW, and CME association if the page is in core or of the PDME and PTW association if the page is not in core (as determined by the setting of the PDME flag pdme.incore). If the page ~s not in core then look at the PTW pointed to by pdme.ptwp (if pdme.ptwp is zero, the segment containing that page is not active and hence has no active PTWs)e The device address in the PTW must be for the paging device or there is an error. To determine if it is the correct paging device address, multiply the 18-bit paging device record number by 4 (the size of a PDME) and add the offset portion of the pointer stored in sst.pdmap. This should yield as a result the offset of the associated PDME in the SST. If the page is in core, compute the CME address from the PTW pointed by pdme.ptwp as described earlier. The device address in the CME must be for the paging device and the address of the associated PDME can be computed as just described.
For any PTW tha~ has ptw.df on, the PTW must, of necessity, contain a core address. If ptw.df is off, it always contaihs a device address for all systems earlier than Release 2.2. In the case that this page is being read in (ptw.df = "D"b, ptw.os = "1"b), there is always a CME associated with the PTW which, in systems prior to Release 2.2, must be searched for.. In Release 2.2 and later systems, a PTW for a page being read in contains a core address, which allows quick location of the CME. In all other cases, the PTW contains a device address.
Another quick consistency check is that all PDMEs that are free (last three words are zero) must be at the head of the used list. The used list is traced by following forward pointers. The address of the first PDME is stored in sst.pdusedp. Also, the number of free PDMEs in the used list plus the number of PDt1Es that have an RWS active (stored in sst.pd_wtct) should equal the value in sst.pd_free.
The last type of check that can be made is really more of a
heuristic one. The pdme.abort, pdme.truncated, and
pdme.notify_requested flags are rarely on and may be symptomatic when looking for the reason for a crash. Also, the pdme.removing flag should only be on when the associated paging device record is being explicitly deleted by the operator.
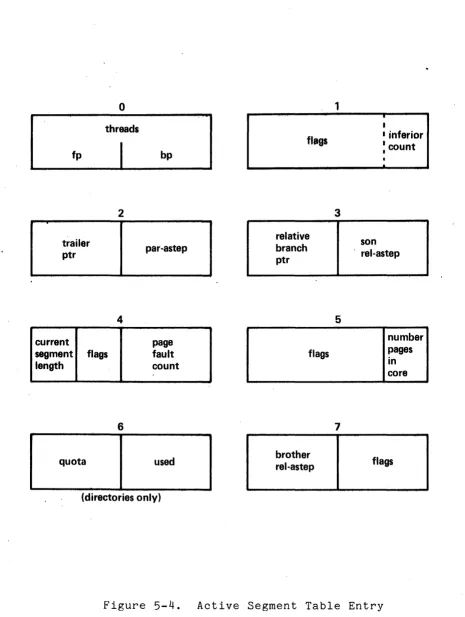
Active Segment Table
The Active Segment Table (AST) described earlier contains a number of Active Segment Table Entries (ASTE) and associated page tables. The ASTE is eight words long and basically contains copies of some pieces of directory information about a segment. This information, which can change quite rapidly, may be updated in the ASTE rather than paging in the directory to do the updating each time. Figure 5-4 below shows the format of an ASTE.
fp
trailer ptr
current
o
threads
2
4
segment flags length
6
quota
bp
par-astep
page fault count
used
(directories only)
flags
relative branch ptr
flags
brother rel-astep
1
3
5
7
I
I
I inferior
: count
•
.
son
. rel-astep
number pages in core
[image:39.613.74.539.53.670.2]flags