Munich Personal RePEc Archive
Financing of India’s Balance of
Payments: The Role of Debt Creating
Flows
George, Justine
Assistant professor, Department of Economics, St Paul’s College,
Kalamassery
1 June 2012
Online at
https://mpra.ub.uni-muenchen.de/70512/
Financing of India’s Balance of Payments: The Role of Debt Creating
Flows
(Justine George, Asst. Professor, Department of Economics, St. Paul’s College Kalamassery)
Abstract
Existences of high cost of borrowing were one of main the reason for shifting of financing BoP away from debt flows in the post liberalization period. After a reduction in the share of debt flows between 2001-02 and 2003-04, it again bears an important part of net capital flows since 2003-04. Unlike in the past, these debt flows were productively used because the end use of ECB mainly concentrated on import of capital goods, project purpose and modernisation rather than used for loan refinancing, working capital and rupee expenditure.
1 Introduction
Debt creating flows were increasingly used for financing BoP in India up to the
liberalization. Along with official debt flows, private debt such as Non Resident
Indian (NRI) deposit, External Commercial Borrowings (ECB), short term credits
were prominent part of the net capital flows from the starting of 1980’s. But in post
liberalization period nature net capital flows shifted to non debt flows and along with
that, compositional shift happened within the debt flows from official to private debt
flows. However, in the recent period, particularly from 2003-04 witnessed an increase
in the private debt flows to India and in turn caused an increase the share of debt
flows in the net capital flows between 2003-04 and 2007-08.
The main objective of the paper is to understand the role of debt flows for financing
BoP during the liberalisation period. Paper is organized into seven sections: - Section
2 provide an overview of debt flows in liberalisation period. Section 3 counter
factually analyse the years of India’s dependence of debt flows for financing BoP.
Sections 4 discuss the resurgence of debt flows in post 2002-03 periods. Section 5
compares the cost of external borrowing vis-a-vis domestic cost of borrowing and finally section 6 concludes main findings.
2 Overview of debt flows in liberalisation period
External assistance, External commercial borrowings (ECB), Trade credit and non
flows to India. Broadly, debt capital flows to India could be divided into three phases.
First phase is the period from 1947 to 1980, second phase is 1980 to 1990 and third
phase 1991 onwards. First phase is characterised as the multilateral and bilateral
concessional loans were used as the sole source of financing BoP in India. During the
second phase, India forced to attract costlier form of private debt flows such as ECB,
short term debt and NRI deposit for financing BoP. This was mainly due to the
shortages of official debt flows in relation to the huge current account deficit buildup
in those periods (Reddy, 2006b). Third phase started from 1991 and marked by two
changes, firstly the composition of debt flows shifted away from official to private
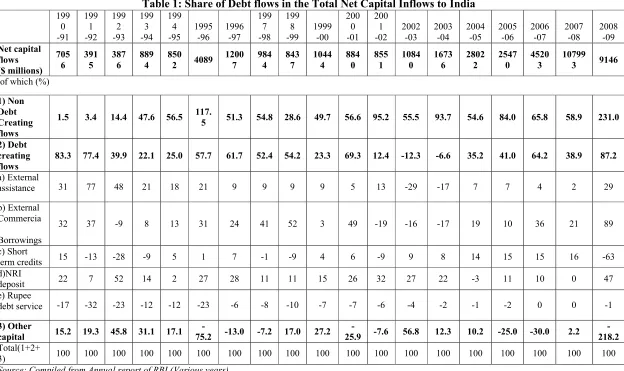
debt1 and secondly the focus of BoP financing shifted from debt to non debt flows. Share of debt flows was high at 83.3 % of net capital flows in 1990-91 (See Table 1).
Since then, it is declined to -6.6% in 2003-04. But a slight resurgence of debt flows
occurred thereafter. Between 2004-05 and 2007-08 share of debt flows were average
at 44% of net capital flows, out of which external commercial borrowing and short
term credit are the reason for increase in the share of debt flows. Concerned increase
in the debt flows during the post 2003-04 periods would have significant effect on
BoP, particularly in current account and it conditioned by cost of borrowing of these
debts
At a disaggregated level, share of external assistance declined from 31.2% of net
capital flows in 1990-91 to incredibly low at 2% in 2007-08. On the other hand, in the
recent period India has started extending assistance to other countries mainly in the
form of grant and loan. The major beneficiaries of the assistance were Bhutan, Nepal
and Srilanka and Pakistan (Mohan, 2008). As a result of BoP crisis, flow of
commercial borrowing indicated a slow down, thereafter it raised significantly in the
latter half of 1990 and it constitute around 30% of net capital flows to India in those
periods. Towards the late 1990’s and early 2000’s the demand for ECB remains low
due to host of factors such as global economic slowdown, lower domestic demand.
The year 2003-04 onwards marked resumption in the flows of ECB to India. Net
inflows under ECB increased from $ 5194 in 2004-05 to exceptionally high at $
22,633 million in 2007-08 and again it got reduced to $ 8158 in 2008-09 and it mainly
due to the effect of global economic crisis. Short term credit to India is also high in
the recent period and it increased immensely from 2003-04 onwards. In 2003-04,
short term credit was very low at $ 970 million. Since then, it is increasing and
reaches very high at $ 17,183 million in 2007-08
Except few years, the flows of NRI deposit have been stable during the last two
decades and it manifests the result of conscious policy followed by the Reserve bank
of India. However, in the pre reform period policy initiative aimed at attracting
nonresident deposit by offering a number of incentives including exchange guarantee
and a higher rate of interest. Since 1991, such deposit has been streamlined by
withdrawing the scheme with exchange guarantee, eliminating short term components
in a phase to phase manner and the maturity structure of the NRI deposit also reversed
to encourage long term deposit. NRI deposit with maturity less than one year was
2 Table 1: Share of Debt flows in the Total Net Capital Inflows to India
199 0 -91 199 1 -92 199 2 -93 199 3 -94 199 4 -95 1995 -96 1996 -97 199 7 -98 199 8 -99 1999 -00 200 0 -01 200 1 -02 2002 -03 2003 -04 2004 -05 2005 -06 2006 -07 2007 -08 2008 -09 Net capital flows ($ millions) 705 6 391 5 387 6 889 4 850 2 4089 1200 7 984 4 843 7 1044 4 884 0 855 1 1084 0 1673 6 2802 2 2547 0 4520 3 10799 3 9146
of which (%)
1) Non Debt Creating flows
1.5 3.4 14.4 47.6 56.5 117.
5 51.3 54.8 28.6 49.7 56.6 95.2 55.5 93.7 54.6 84.0 65.8 58.9 231.0 2) Debt
creating flows
83.3 77.4 39.9 22.1 25.0 57.7 61.7 52.4 54.2 23.3 69.3 12.4 -12.3 -6.6 35.2 41.0 64.2 38.9 87.2
a) External
assistance 31 77 48 21 18 21 9 9 9 9 5 13 -29 -17 7 7 4 2 29
b) External Commercia l
Borrowings
32 37 -9 8 13 31 24 41 52 3 49 -19 -16 -17 19 10 36 21 89
c) Short
term credits 15 -13 -28 -9 5 1 7 -1 -9 4 6 -9 9 8 14 15 15 16 -63
d)NRI
deposit 22 7 52 14 2 27 28 11 11 15 26 32 27 22 -3 11 10 0 47
e) Rupee
debt service -17 -32 -23 -12 -12 -23 -6 -8 -10 -7 -7 -6 -4 -2 -1 -2 0 0 -1
3) Other
capital 15.2 19.3 45.8 31.1 17.1
-75.2 -13.0 -7.2 17.0 27.2
-25.9 -7.6 56.8 12.3 10.2 -25.0 -30.0 2.2 -218.2
Total(1+2+
2
3 Dependence on Debt Flows for Financing BoP in Liberalisation Period
Debt flows was the prominent source of financing BoP up to liberalisation period.
Because of the buoyant availability of non debt flows, dependence of financing BoP
with debt flows significantly reduced in the post liberalisation period. From 1990-91
onwards only five years India partially used the debt flows for financing BoP. In other
words, India didn’t have enough foreign investment for financing requirement. Out of
the total five years, three years happened in the beginning period of liberalisation and
financed around average of 90% of current account deficit with debt flows.
Dependence of debt flows for financing BoP also necessitated in years such as
1997-98 and 191997-98-99. This dependence is mainly occurred because of low net inflows of
foreign investment due Asian economic crisis. Due to the severity of low net foreign
investment in 1998-99, 42% of current account deficit was financed with debt flows.
Table 2: Dependence on Debt Flows for Financing BoP in liberalisation2
Year Financing BoP with Debt Flows (%)
1990-91 98.9
1991-92 88.7
1992-93 84.2
1997-98 2.7
1998-99 42.7
Source: Computed from RBI, Database on Indian Economy
Ever since 2000, India has never depended on debt flows for financing BoP. But in
2008-09 India didn’t had enough capital flows to finance current account deficit due
to global economic crisis and therefore 75% of current account deficit is financed
with foreign exchange reserve. Therefore in 2008-09 neither the debt nor non debt
flows saves the situation from using foreign exchange reserve to finance current
account deficit.
2BoP can be financed with both debt and non debt flows. Dependence of debt flows for financing BoP
4 Resurgence of Debt Flows to India
Substantial increase in the External Commercial Borrowings (ECB) and short-term
credit was the main the reason for increase in the share of debt flows since 2003-04.
For instance, 74% debt capital flows in 2007-08 was jointly contributed by short term
credit and external commercial borrowings. Government policy of liberalizing the
debt flows along with high interest rate difference in India relative to other nations are
the reason for large increase in debt flows. The increase in ECB since 2003-04 can be
attributed to the larger borrowings from international capital market by Indian
corporate sector encouraged by the persistence of interest rate wedge between
domestic and international interest rates and it also reflect sustained domestic
investment demand and import demand in India (Mohan,2008). London Inter Bank
Offered Rate (LIBOR) used as a yardstick for world interest rate. Suppose if we take
LIBOR rate as proxy for foreign interest rate and monthly yield rate of corporate debt
paper as domestic interest rate shows not only an interest rate difference but
[image:8.612.129.523.371.603.2]concerned difference keeps on widening for the last few years (See Figure 1).
Figure 1: Monthly Yield Rate on Corporate Debt papers (with AAA rating) for five year maturity and LIBOR rate
Source: Ministry of Finance, (2008)
End use is an important consideration of debt and it would influence repayment of
commercial borrowing on the basis of end use and the data is available from 2004-05
onwards3. Classification on the basis of end use of external commercial borrowing
shows that, for the past four years, ECB were being used for productive purpose such
as import of capital goods, project purpose and modernisation. On the other hand
share of loan refinancing, rupee expenditure and working capital propose has been
quite low. Table 4.4 shows that, along with project purpose and modernisation, import
of capital goods are the important end use of external commercial borrowings in
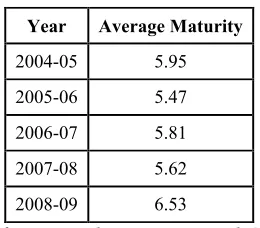
India. For all types of external commercial borrowings, minimum maturity ceiling has
been fixed at three year so far. However during the course of time, evidence shows
that government had not compromise anything on maturity of external commercial
borrowings for increasing its inflows because the last four years maturity of all the
ECB contacted in each year is more than the average five years (See Table 3).
Table 3: Average Maturity of External Commercial Borrowings
(Values are in Years)
Year Average Maturity
2004-05 5.95 2005-06 5.47 2006-07 5.81 2007-08 5.62 2008-09 6.53
[image:9.612.258.388.339.453.2]Source: Calculated from RBI data on External Commercial Borrowings Table 4: End use of External Commercial Borrowings
(Values are in percentage share of each to the total ECB)
Y ea r Im p o rt of cap it a l go o d s P ro je ct p u rp os e M od er n is a ti o n R u p ee ex p en d it u re L oan re fi n an ci n g W o rk in g cap it al O th er T o ta l
2004-05 30 21 19 11 4 1 14 100
2005-06 18 19 25 4 20 0 13 100
2006-07 20 30 25 13 2 0 9 100
2007-08 35 19 10 4 4 0 30 100
2008-09 53 15 5 13 4 0 9 100
3We classified on the basis of major end use of external commercial borrowing and other categories
Source: Calculated from RBI data on External commercial borrowings
On the other hand, increase in the short term credit in the last few years is trade
generated and resulted from higher level of imports in those years, particularly oil
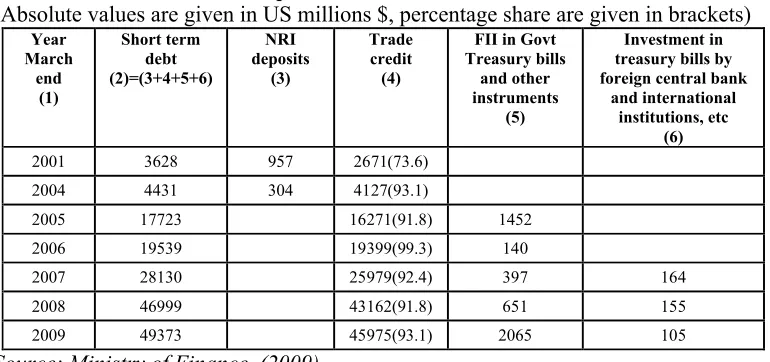
imports (Ministry of Finance, 2009). As a result of high trade credit, short term debt
in India increased for the past few years. At present short term debt in India include,
NRI deposit with one year or less than one year maturity, trade credit with less than
six month maturity, Foreign Institutional Investment in government treasury bills and
other Treasury bill investment by international institution and foreign central bank.
Short term debt in India absolutely increased from $ 4.4 billion in 2004 to high at $
49.3 billion in 2009, out of which trade credit roughly constitutes 90% increase in the
short term debt4 (Table 5). RBI closely monitors the stock of short-term debt on an
ongoing basis. Because of the prudential regulation generally no rollover of
short-term credit is allowed beyond six month. Besides foreign exchange reserve coverage
of short term debt greatly improved in the liberalisation period. For instance, the ratio
of short term debt to foreign exchange reserve down from 146% in 1990-91 to 19.9 %
in 2008-09. Conscious approach could also see in the case of NRI deposit, in which
short term element in NRI deposit eliminated in phase to phase manner and revising
the maturity structure of the deposit to encourage long-term deposit. NRI deposits
with maturity year or less completely eliminated since April 2003.
4The increase in the short term debt in the recent period could also attribute to the improvement in the
Table 5: Components of Short-term Debt in India
(Absolute values are given in US millions $, percentage share are given in brackets)
Year March
end (1)
Short term debt (2)=(3+4+5+6)
NRI deposits
(3)
Trade credit
(4)
FII in Govt Treasury bills
and other instruments
(5)
Investment in treasury bills by foreign central bank
and international institutions, etc
(6)
2001 3628 957 2671(73.6) 2004 4431 304 4127(93.1)
2005 17723 16271(91.8) 1452 2006 19539 19399(99.3) 140
2007 28130 25979(92.4) 397 164
2008 46999 43162(91.8) 651 155
2009 49373 45975(93.1) 2065 105
Source: Ministry of Finance, (2009)
5 External Assistance to India and Interest Bearing Loans
External assistance has played significant role in the development process in India.
However, unlike the past, now India has no longer reliant on external assistance for
financing BoP. In donor wise, external assistance mainly composed of multilateral
and bilateral assistance. In the recent period, International Development Association
(IDA), International Bank for Reconstruction and Development (IBRD), Asian
Development Bank (ADB) are the major donors of multilateral segment of external
assistance where as Japan, United Kingdom (U.K), Germany, European Economic
Community (EEC), United States of America (USA), Russian federation are main
nations in which we have been receiving bilateral assistance (Ministry of finance,
2008b).
IDA, the soft loan affiliate of World Bank and carry lower rate of interest where as
loan from IBRD and ADB are carrying market rate of interest therefore it is relatively
costly. However borrowing from ADB and IBRD has been showing an increase in the
recent period. The continuance of borrowing from ADB, IBRD assumes special
importance from the possibility of India being kept out of IDA loans. IDA loans are
extended only to low income countries. At present India though a low income
country, is at the border line. Grant element component of assistance under
multilateral agencies are low and it is very negligible for IBRD and ADB loans (See
Annexure 2). On the other hand major part of bilateral assistance is getting from
shows that, even though the bilateral assistance from U.K, EEC and USA were lower,
however, most of the assistance was received from these nations as grant. Grant
element is also very higher for the bilateral assistance from Germany (See Annexure
[image:12.612.125.524.167.345.2]3)
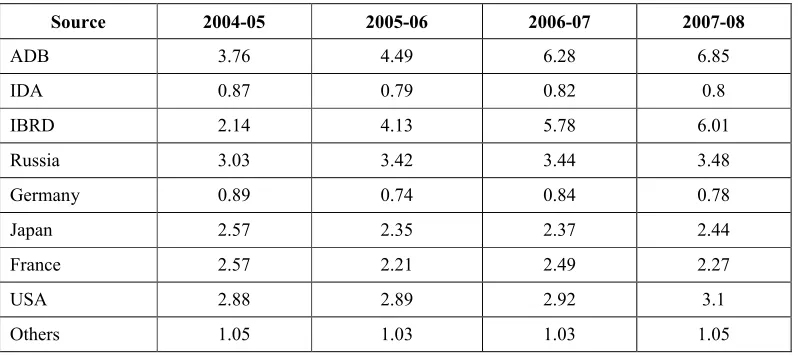
Table 6: Weighted Average Interest of External Borrowings from Different Sources
Source 2004-05 2005-06 2006-07 2007-08
ADB 3.76 4.49 6.28 6.85
IDA 0.87 0.79 0.82 0.8
IBRD 2.14 4.13 5.78 6.01
Russia 3.03 3.42 3.44 3.48
Germany 0.89 0.74 0.84 0.78
Japan 2.57 2.35 2.37 2.44
France 2.57 2.21 2.49 2.27
USA 2.88 2.89 2.92 3.1
Others 1.05 1.03 1.03 1.05
Source: Ministry of Finance, (2008b)
Weighted average interest rate for ADB and IBRD are not only very higher in the
external assistance portfolio, but also the interest rate is increasing under the period of
analysis (See Table 6). Moreover table 6 shows two things, firstly IDA loans found to
be one of the low cost borrowing items in our external assistance portfolio. Secondly,
cost of borrowing of bilateral assistance from Japan is very low as we compare with
that of ADB and IBRD loans. Japan is the major bilateral donor to India and their
weighted average interest rate is very low and follows more or less same interest rate
throughout period of analysis. Crucial question here is why government has been
increasingly borrowing high cost loans from ADB and IBRD.
5.1 Relative Benefit of Domestic Borrowing vis-à-vis External Borrowing
Loans from ABD and IBRD are carrying market rate of interest and therefore these
are found to be high cost categories of loans in India’s external debt portfolio. Though
our external borrowing is composed of these high cost loans, but the total cost of
external borrowing is still very low as we compare it with cost of domestic borrowing.
other nation; therefore cost of borrowing of from domestic very high in relation to
[image:13.612.98.552.142.466.2]external borrowings.
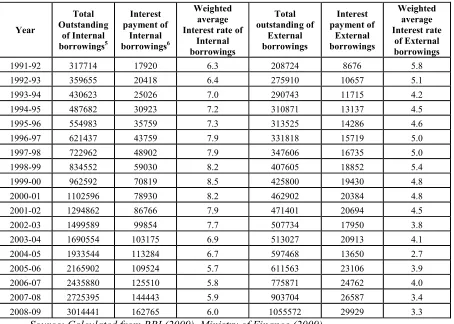
Table 7: Comparative Analysis of Debt Service Liability on External and Domestic Borrowings (Values are in Rs Crores)
Year Total Outstanding of Internal borrowings5 Interest payment of Internal borrowings6 Weighted average Interest rate of
Internal borrowings Total outstanding of External borrowings Interest payment of External borrowings Weighted average Interest rate of External borrowings
1991-92 317714 17920 6.3 208724 8676 5.8
1992-93 359655 20418 6.4 275910 10657 5.1
1993-94 430623 25026 7.0 290743 11715 4.2
1994-95 487682 30923 7.2 310871 13137 4.5
1995-96 554983 35759 7.3 313525 14286 4.6
1996-97 621437 43759 7.9 331818 15719 5.0
1997-98 722962 48902 7.9 347606 16735 5.0
1998-99 834552 59030 8.2 407605 18852 5.4
1999-00 962592 70819 8.5 425800 19430 4.8
2000-01 1102596 78930 8.2 462902 20384 4.8
2001-02 1294862 86766 7.9 471401 20694 4.5
2002-03 1499589 99854 7.7 507734 17950 3.8
2003-04 1690554 103175 6.9 513027 20913 4.1
2004-05 1933544 113284 6.7 597468 13650 2.7
2005-06 2165902 109524 5.7 611563 23106 3.9
2006-07 2435880 125510 5.8 775871 24762 4.0
2007-08 2725395 144443 5.9 903704 26587 3.4
2008-09 3014441 162765 6.0 1055572 29929 3.3
Source: Calculated from RBI (2009), Ministry of Finance (2009)
Note: weighted interest rate of particular loan in year is nothing but the percentage share of interest amount paid with the total outstanding loan in the last year.
Table 7 correctly highlight existence of cost difference between domestic and external
borrowing, out of which cost of external borrowing stood at very lower compared to
the cost of domestic borrowings. For instance weighted average interest rate for
5 Total outstanding of internal borrowing consists of the total outstanding internal debt and other
interest bearing liabilities. Internal debt consist of market loans and other medium and long term loans, treasury bills and special securities issued to national small saving fund where as other interest liabilities include insurance and pension fund, deposit of non Govt provident fund, reserve funds of commercial departments special securities to oil companies, FCI and others. From 2004-05 the provision for interest payment on borrowings under the market stabilization scheme (MSS), have been separately reflected in terms of MOU on MSS
6 Interest payment of internal borrowings is calculated by subtracting interest payment of external
domestic borrowing was at 6% in 2008-09, but in the same years weighted average
interest rate was only 3.3% for external borrowing. There was no much difference
between the cost of borrowings of external and domestic borrowings in the beginning
of liberalisation period, but since then cost of external borrowing dramatically
declined where as domestic borrowing increasing very much in the observation
period. Though cost of domestic borrowing has been declining in beginning period of
liberalisation and it showed a large increase especially between 1998-99 and 2002-03.
However, the post 2003 cost of domestic borrowing is declining, but as of now cost of
domestic borrowing is very higher vis-à-vis external borrowings.
6 Conclusion
Existence of high cost of borrowing was one of main the reason for shifting in
financing BoP away from debt flows. Even though the focus of BoP financing shifted
away from debt flows however period from 1990-91 to 1999-2000, five years India
partially relied on debt flows for financing BoP. After a reduction in the share of debt
flows between 2001-02 and 2003-04, it again bears an important part of net capital
flows since 2003-04.
Drastic increase in the short term credit and External Commercial Borrowings (ECB)
are the reason for the large increase in the debt flows in the post 2003-04 periods.
Unlike in the past, these debt flows were productively used because end use of ECB
mainly concentrated on import of capital goods, project purpose and modernisation
rather than used for loan refinancing, working capital and rupee expenditure. Increase
in the short term credit is trade related and it is due to high import of Petroleum Oil
Lubricant (POL) product in the last few years. Though there is a reduction in the total
cost of borrowing of debt flows, however, some high cost loans are still existed in
India’s debt portfolio. ADB and IBRD loans are fall under these categories because
these loans are carrying market rate of interest. Weighted average interest rates for
these loans are increasing for the last few years. At the same time when we compare
the total cost of external borrowing with domestic borrowing latter is higher than the
Bibliography
Acharya, S. (2002) Macroeconomic Management in the Nineties. Economic and
Political Weekly,37(16), pp. 1515-1538.
Chandra, N.K. (1991) Growth of Foreign Capital and Its Importance in Indian Manufacturing. Economic and Political Weekly,26(11/12), pp. 679-690. Chandra, N.K. (2008) India’s Foreign Exchange Reserves: A Shield of Comfort or an
Albatross?. Economic and Political Weekly,43(14), pp 40-51.
Chandrasekhar, C.P. (1985) India's Balance of Payments under the New Regime.
Social Scientist,13(9), pp. 31-43.
World Bank (2009a) Global Development Finance CD-Rom (Washington, DC: World Bank)
World Bank (2009b) Global Development Finance 2009: Review, Analysis and OutlookAccessed at
http://siteresources.worldbank.org/INTGDF2009/Resources/gdf_combined_w eb.pdf(accessed on May 21 2010)
Ministry of Finance (2005) India’s External Debt: A status Report 2004-05, Department of Economic Affairs, Ministry of Finance, Government of India.
Ministry of Finance (2006) India’s External Debt: A status Report 2005-06, Department of Economic Affairs, Ministry of Finance, Government of India.
Ministry of Finance (2007) India’s External Debt: A status Report 2006-07, Department of Economic Affairs, Ministry of Finance, Government of India.
Ministry of Finance (2008) Position paper on external assistance received by India, Ministry of Finance Department of Economic Affairs Project Monitoring Unit, Government of India.
Annexure
Annexure 1
Share of outstanding official and private creditor in the total debt outstanding
(Values are in percentage share of each category to total)
End- March Official creditors Private creditors
1998 58.1 41.9
1999 56 44
2000 56.2 43.8
2001 51.2 48.8
2002 51.8 48.2
2003 48.3 51.7
2004 45.2 54.8
2005 39.3 60.7
2006 37.3 62.7
2007 31.8 68.2
2008 27.8 72.2
2009 27.4 72.6
2 Annexure 2: Multilateral Assistance Received from Major Donors
(Absolute values are in Rs crores, values in the parenthesis indicate the percentage share of loan and grant element)
Source: Ministry of Finance, (2008)
Note: Total denotes Total Multilateral Assistance
Annexure 3: Bilateral Donors
(Absolute values are in crores, values in the parenthesis indicate the percentage share of loan and grant element)
Donor/
years 2000-01 2001-02 2002-03 2003-04 2004-05 2005-06 2006-07
Japan 2729.8 (99.4/0.6) 3728.9 (100/0) 3328.9 (99.7/0.3) 3277.7 (99.8/0.1) 2971.18 (98/2) 2710.36 (97.92/2.08) 2097.62 (98.28/1.72) U.K 307.3 (0/100) 808.4 (0/100) 778.7 (0/100) 1279.94 (0/100) 1506.93 (0/100) 1371.94 (0/100) 1310.32 (0/100) Germany 386.7 (82.5/17.5) 444.7 (65.9/34.1) 381.16 (50.83/49.17) 333.41 (59.21/40.79) 121.18 (14.87/85.12) 188.24 (18.25/81.75) 278.32 (36.48/63.52) EEC 36.28 (0/100) 181.9 (0/100) 326.03 (0/100) 147.54 (0/100) 426.31 (0/100) 820.51 (0/100) 397.88(0/100) USA 81.11 (0/100) 66.18 (0/100) 49.86 (0/100) 110.56 (0/100) 80.17(0/100) 52.66(0/100) 44.56 (0/100) Russia 130.09 (100/0) 23.03 (100/0) 316.06 (100/0) 771.71 (100/0) 1194.82 (100/0) 1106.83 (100/0) 1404.41 (100/0) Total 3866.18 (83.5/16.5) 5624.8 (72.4/27.6) 5399.46 (71.94/28.06) 6218.05 (68.97/31.03) 6446.38 (64.84/35.05) 6309.14 (60.52/39.48) 5531.26 (64.60/35.40)
Source: Ministry of Finance, (2008)
Note: Total denotes Total Bilateral Assistance
Donor/
Years 2000-01 2001-02 2002-03 2003-04 2004-05 2005-06 2006-07 IDA 4871 (99.53/0.43) 5782 (99.22/0.78) 4303 (9941/0.59) 4178 (99.37/0.63) 4632 (99.23/0.57) 5363 (99.81/0.19) 4306 (99.65/0.35)