Specificity of QuantiFERON-TB Plus, a New-Generation
Interferon Gamma Release Assay
S. A. R. Siegel,
aM. Cavanaugh,
bJ. H. Ku,
aL. M. Kawamura,
cK. L. Winthrop
a,daSchool of Public Health, Oregon Health & Science University-Portland State University, Portland, Oregon, USA
bOregon State Public Health Laboratory, Hillsboro, Oregon, USA
cQiagen, Germantown, Maryland, USA
dDivision of Infectious Diseases, Oregon Health & Science University, Portland, Oregon, USA
ABSTRACT
Interferon gamma release assays (IGRAs) are important tools in identifying
prior tuberculosis exposure. The new-generation QuantiFERON-TB Gold Plus (QFT-Plus)
assay, recently approved for use in the United States, differs from the current-generation
QFT Gold-In-Tube (QFT-GIT) assay with the addition of a second antigen tube that also
contains novel CD8
⫹T-cell-stimulating peptides. The QFT-Plus assay has increased
sensi-tivity in immunocompromised populations, and we sought to assess the specificity of
QFT-Plus compared to that of QFT-GIT in low-risk individuals. We enrolled adults without
tuberculosis risk factors, including a subgroup with pulmonary nontuberculous
myco-bacterial (NTM) disease due to
Mycobacterium avium
complex (MAC) or
Mycobacterium
abscessu
s. The primary outcome measures included specificity, interassay concordance,
and agreement between the QFT-Plus and QFT-GIT assays. Of 262 participants enrolled,
51 had pulmonary NTM. The median age was 39 years (age range, 18 to 78 years); 73%
were female. Among the 262 individuals who were enrolled, 5 (1.9%) individuals had
positive QFT-Plus results, and 3 of these individuals also had positive QFT-GIT results.
The two individuals with discordant results (QFT-Plus positive/QFT-GIT negative) had
only one tube positive in the Plus assay. The overall specificity of Plus and
QFT-GIT was 98.1% (95% confidence interval [CI], 95.6, 99.4%) and 98.9% (95% CI, 96.7,
99.8%), respectively. The QFT-Plus specificity was similar in both the NTM (98.0% [95%
CI, 89.4, 99.9%]) and non-NTM (98.1% [95% CI, 95.2, 99.5%]) groups. QFT-Plus has a high
specificity, similar to that of the QFT-GIT assay, including in patients with pulmonary
MAC or
M. abscessus
disease.
KEYWORDS
diagnostic, nontuberculous mycobacterial infection, latent tuberculosis
infection
D
espite its diminishing incidence in the United States, tuberculosis (TB) remains an
important cause of morbidity and mortality throughout the world. In the United
States, recent efforts have focused on eliminating the reservoir of those with latent TB
infections (LTBI) who might later progress to active TB (1). Recent guidelines advocate
using interferon gamma (IFN-
␥
) release assays (IGRAs) and/or the tuberculin skin test
(TST) to identify those with latent infection. Two IGRAs are available for screening,
including the 3rd-generation QuantiFERON-TB Gold (QFT-GIT; Qiagen, Hilden, Germany)
test and the T-SPOT TB test (Oxford Immunotec, UK).
The 3rd-generation QFT-GIT test measures responses to the
Mycobacterium
tuber-culosis
antigens ESAT-6, CFP-10, and 7.7 (2). Recently, a 4th-generation assay, the
QuantiFERON-TB Plus (QFT-Plus) assay, which utilizes two antigen tubes, has been
developed and approved. The first tube contains only ESAT-6 and CFP-10 (7.7 has been
removed from the assay), meant to elicit a CD4
⫹response, and the second tube
includes these same antigens plus additional proprietary peptides designed to
stimu-Received15 April 2018 Returned for modification31 May 2018 Accepted14 September 2018
Accepted manuscript posted online19 September 2018
CitationSiegel SAR, Cavanaugh M, Ku JH, Kawamura LM, Winthrop KL. 2018. Specificity of QuantiFERON-TB Plus, a new-generation interferon gamma release assay. J Clin Microbiol 56:e00629-18.https://doi.org/10 .1128/JCM.00629-18.
EditorBetty A. Forbes, Virginia Commonwealth University Medical Center
Copyright© 2018 American Society for Microbiology.All Rights Reserved. Address correspondence to S. A. R. Siegel, [email protected].
crossm
on May 16, 2020 by guest
http://jcm.asm.org/
late TB-specific CD8
⫹T lymphocytes (3). Recent studies have found that both CD4
⫹and
CD8
⫹T lymphocytes produce IFN-
␥
in the presence of
M. tuberculosis
antigens.
M.
tuberculosis
-specific CD8
⫹responses have been detected in patients with LTBI as well
as those with active TB (4–7). Moreover, ESAT-6- and CFP-10-specific CD8
⫹T
lympho-cytes are described as being detected more often in patients with active TB disease
than in those with LTBI, which may be related to a more recent exposure to
M.
tuberculosis
(8–10).
M. tuberculosis
-specific CD8
⫹T cells producing IFN-
␥
have also been
detected in active TB patients with HIV coinfection (11, 12) as well as young children
with TB disease (13).
Few studies have evaluated active nontuberculous mycobacterial (NTM) disease
causing false-positive IGRA results. Evidence indicates that IGRAs are not affected by
most clinically relevant NTM, as there is little overlap between ESAT-6 or CFP-10 and
most NTM species (14). A recent study found that children in Denmark with at least one
positive NTM culture (positive for either
M. avium
complex [MAC],
M. abscessus
-
M.
chelonae
,
M. celatum
,
M. fortuitum
-
M. peregrinum
,
M. gordonae
,
M. malmoense
, or
M.
xenopi
) had no positive or indeterminate IGRA results, indicating a specificity of 100%
(15). However, infection with either
M. marinum
or
M. kansasii
, both of which express
ESAT-6 and CFP-10, has been shown to cause positive IGRA results (16, 17). The
cross-reactivity of the proprietary antigens within the secondary tube of the QFT-Plus
assay with these or other clinically relevant NTM is unknown. How the removal of 7.7
or the addition of CD8-stimulating peptides affects the sensitivity or specificity in
diagnosing LTBI is unclear. In the present study, we sought to compare the specificity
of the new QFT-Plus assay with that of the QFT-GIT assay in a population of patients
lacking TB risk factors, including a subset of individuals with pulmonary NTM disease.
MATERIALS AND METHODS
Participants.We prospectively enrolled individuals agedⱖ18 andⱕ70 years at the Oregon Health & Science University (OHSU) in Portland, OR, USA. Participants were enrolled into one of two groups; group 1 consisted of individuals with no recognized TB risk factors, and group 2 consisted of patients also lacking TB risk factors but who met American Thoracic Society (ATS)/Infectious Diseases Society of America (IDSA) case criteria for nontuberculous mycobacterial (NTM) disease (18). The TB risk factors considered included a history of bacillus Calmette-Guérin vaccination; a documented TB diagnosis or completion of empirical TB therapy; prior contact with a TB case; a history of living or traveling in India, China, sub-Saharan Africa, or Southeast Asia or in an area with a current active TB prevalence of⬎50 per 100,000 (defined as an area where TB is endemic) for more than 1 month; birth in a country where TB is endemic; and exposure to high-risk environments for TB exposure for more than 1 month (e.g., a nursing home, hospital, or homeless shelter) (19, 20). For group 1 recruitment, we advertised via OHSU’s intrainstitutional website for potential study participants. Individuals in group 1 were local to Portland, OR, and were associated with OHSU (nonclinical staff and students). Study patients for group 2 were identified from a chronic chest infection clinic at OHSU where NTM patients were screened for participation. All participants were enrolled on a first come-first served basis until the target enrollment numbers were met. Inclusion criteria for both groups 1 and 2 necessitated an absence of TB risk factors. Individuals were excluded if they had resided or traveled within areas where TB is endemic (defined as residence or travel within a region having a TB incidence of⬎50/100,000 for⬎30 days), a prior diagnosis of TB, prior exposure to someone with active TB, a history of living or working for more than 1 month in a jail or a homeless shelter, a history of health care work interacting directly with patients at risk for TB, or a history of an immunosuppressive condition, such as human immunodeficiency virus infection, cancer, or systemic immunosuppressant usage. In addition to the blood sample, we collected demo-graphic, epidemiological, and clinical information pertaining to past TB exposure and previous skin test or QFT-TB test status.
Previous data suggested that the specificity of QFT-GIT is 99.2% (95% confidence interval [CI], 97.7, 99.8%) (QuantiFERON-TB Gold In-Tube product insert [document no. US05990301L], Cellestis Inc., March 2013). We hypothesized that the specificity of QFT-Plus would be similar. Our prespecified noninferiority margin was 3%, providing a lower bound of 96.2% specificity to be necessary to conclude that QFT-Plus was noninferior. Two-hundred three study subjects were needed to ensure a power of 80%, assuming a specificity of 99.0% for the current-generation QFT-GIT assay. Informed consent was obtained prior to enrollment. The Oregon Health & Science University’s Institutional Review Board approved the study protocol.
QFT-GIT and QFT-Plus assays.The assays were performed according to the instructions in the manufacturer’s (Qiagen) QuantiFERON-TB Gold In-Tube and QuantiFERON-TB Plus package inserts (2, 3). Whole-blood samples were collected by normal venipuncture and placed into a 9-ml sterile sodium heparin tube for both the QFT-GIT and QFT-Plus assays. One milliliter of blood was transferred to antigen-nil, mitogen, and QFT-GIT antigen tubes and QFT-Plus tube 1 and tube 2 and was incubated within 16 h of the blood draw. There was one set of antigen-nil and mitogen tubes used for the two
on May 16, 2020 by guest
http://jcm.asm.org/
assays (QFT-GIT and QFT-Plus) in this study. Following a 16- to 24-h incubation period at 37°C, the blood tubes were centrifuged at 2,500 relative centrifugal force (2,500⫻g) for 15 min, and the plasma was harvested. Samples were immediately frozen at⫺70°C and later batch tested.
The QuantiFERON-TB (QFT) enzyme-linked immunosorbent assay procedure was performed by the manual method to detect and measure the amount of IFN-␥produced in each QFT blood collection tube. The results were compared to those obtained by both a 4-point and an 8-point standard curve analysis using Qiagen software and are reported as the number of international units (IU) per milliliter. The 8-point standard curve was used for data analysis for this study. A cutoff value (the value for the IFN-␥ antigen tube minus the value for the antigen-nil tube control) of 0.35 IU/ml was used. The QFT-GIT assay was considered positive if the measured antigen response minus the background (antigen-nil) response was⬎0.35 IU/ml. For the QFT-Plus assay, a positive result was defined as a single antigen tube (either tube 1 or tube 2) with an antigen response of⬎0.35 IU/ml. A mitogen tube-minus-antigen-nil tube control value of⬍0.5 IU/ml or an antigen-nil tube value of⬎8.0 was classified as indeterminate.
Statistical analyses.We calculated the median, mean, and interquartile range (IQR) for all antigen and negative-control response tubes. We calculated specificity as the proportion of negative cases out of the total patient cohort with the 95% confidence interval (CI). We calculatedPvalues between specificity values for each assay overall and per population, using McNemar’s test for 2-by-2 tables.P
values for mean IFN-␥concentrations were calculated by thettest. We assessed the agreement between QFT-GIT and QFT-Plus using the overall percentage of concordant results with 95% confidence intervals and calculated Cohen’s kappa values using the categorical variables (positive/negative) based on the cutoff values for IFN-␥(21). We performed the analyses using Stata (version 13) software (StataCorp LP, College Station, TX).
RESULTS
Study populations.
The demographic and clinical characteristics of the two study
populations are shown in Table 1. There were similar comorbidities between the NTM
and non-NTM populations, with the exception of bronchiectasis, which was more
common among NTM patients. Patients with NTM disease had predominately
M.
[image:3.585.43.373.83.416.2]avium
-
M. intracellulare
(90.2%), with
M. abscessus
(9.8%) being the other species.
TABLE 1Demographic and clinical characteristics
Characteristic
Values for:
NTM group (nⴝ51)
Non-NTM group (nⴝ211) No. (%) of females 37 (72.5) 157 (73.7) Median (range) age (yr) 65 (18–78) 34 (18–75)
No. (%) of subjects by race
American Indian or Alaska Native 1 (1.9) 1 (0.5)
Asian 13 (6.1)
Black or African American 2 (0.9)
Multiracial 1 (1.9) 13 (6.1)
White 49 (96.1) 178 (83.6)
Unknown or not reported 6 (2.8)
No. (%) of subjects by Hispanic or Latino ethnicity
Hispanic or Latino 1 (1.9) 10 (4.7) Not Hispanic or Latino 50 (98.0) 194 (91.9)
Unknown or not reported 9 (4.3)
No. (%) of subjects infected with the following NTM species:
M. avium-M. intracellulare 46 (90.2)
M. abscessus 5 (9.8)
No. (%) of subjects with the following comorbidities:
Lung cancer 1 (2.0) 1 (0.5)
Sjogren’s syndrome 1 (2.0) 1 (0.5)
Type 2 diabetes 1 (2.0) 2 (0.9)
Gastrointestinal reflux disease 8 (15.7) 9 (4.3) Inflammatory bowel disease 1 (2.0) 3 (1.4)
COPDa 8 (15.7) 2 (0.9)
Cystic fibrosis 3 (5.9)
Bronchiectasis 35 (68.6)
Rheumatoid arthritis 3 (5.9)
aCOPD, chronic obstructive pulmonary disease.
on May 16, 2020 by guest
http://jcm.asm.org/
Test results and assay specificity.
Of 263 enrolled participants, 1 (0.4%; an NTM
patient) had an indeterminate result with mitogen values of
⬍
0.2 IU/ml for both the
QFT-GIT and QFT-Plus assays and was excluded from further analysis. Of the remaining
262 individuals, 5 (1.9%) had positive QFT-Plus results, and 3 of these 5 also had positive
QFT-GIT results; no other subjects tested positive by QFT-GIT. Of the three individuals
with concordant QFT-Plus-positive/QFT-GIT-positive results, both tube 1 and tube 2
within the QFT-Plus assay were positive. Conversely, the two individuals with
discor-dant QFT-Plus-positive/QFT-GIT-negative results had only one tube positive in the
QFT-Plus assay. One of these individuals had only tube 1 positive, while the second
individual had only tube 2 positive.
Overall, the specificity of QFT-Plus was 98.1% (95% CI, 95.6, 99.4%). This was similar
to that of QFT-GIT (specificity
⫽
98.9% [95% CI, 96.7, 99.8%];
P
⫽
0.45). The kappa value
between the two assays was 0.75 (95% CI, 0.41, 1.00), which is in line with previously
calculated kappa values (22). The QFT-Plus specificity was similar in both the NTM and
non-NTM groups (Table 2).
Out of the 211 non-NTM subjects enrolled, 4 (1.9%) subjects had positive QFT-Plus
results, and 2 of these 4 subjects also had positive QFT-GIT results. No other subjects
tested positive by QFT-GIT. The kappa value was 0.66 (95% CI, 0.22, 1.00), indicating a
99.06% agreement between the two tests.
For the 51 NTM patients enrolled, there was 1 patient positive by both assays; in
addition, both antigen tubes of QFT-Plus were concordantly positive for this patient
(Table 3). No other patients had positive test results with either assay. The kappa value
between the two assays was 1.00, indicating a 100.0% agreement between the two
tests.
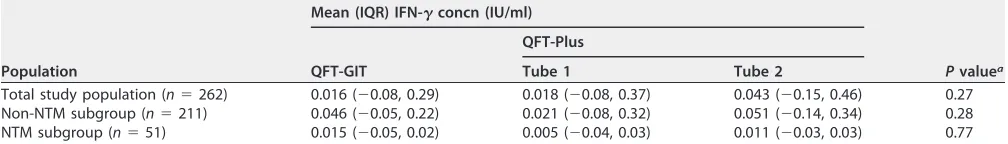
Quantitative IFN-
␥
values.
The mean (IQR) amounts of stimulated antigen-nil IFN-
␥
(TB nil) for each tube (tube 1, tube 2, and QFT-GIT) is shown in Table 3. For both the
NTM and non-NTM groups, there were no significant differences between tube 1, tube
2, or QFT-GIT antigen-nil tube IFN-
␥
concentrations. The means for the QFT-GIT
antigen-stimulated IFN-
␥
response (TB antigen nil) are reported in Table 3 (overall and
by NTM diagnosis). The results for the individuals with positive assay results are
reported in Table 4.
DISCUSSION
[image:4.585.42.373.83.143.2]We evaluated the QFT-Plus IGRA among a cohort of individuals lacking TB risk
factors, including patients with pulmonary NTM disease. Our findings suggest that
QFT-Plus has a high specificity similar to that of the current-generation QFT-GIT assay.
Further, we found a high specificity and strong agreement between the two tests
TABLE 2Assay specificity
Population
% specificity (95% CI) by test
Pvalue QFT-GIT QFT-Plus
Total study population (n⫽262) 98.9 (96.7, 99.8) 98.1 (95.6, 99.4) 0.45 Non-NTM subgroup (n⫽211) 99.1 (96.6, 99.9) 98.1 (95.2, 99.5) 0.67 NTM subgroup (n⫽51) 99.5 (97.4, 100) 98.0 (89.6, 100) 0.17
TABLE 3Stimulated TB antigen-nil IFN-␥concentration by population
Population
Mean (IQR) IFN-␥concn (IU/ml)
Pvaluea
QFT-GIT
QFT-Plus
Tube 1 Tube 2
Total study population (n⫽262) 0.016 (⫺0.08, 0.29) 0.018 (⫺0.08, 0.37) 0.043 (⫺0.15, 0.46) 0.27 Non-NTM subgroup (n⫽211) 0.046 (⫺0.05, 0.22) 0.021 (⫺0.08, 0.32) 0.051 (⫺0.14, 0.34) 0.28 NTM subgroup (n⫽51) 0.015 (⫺0.05, 0.02) 0.005 (⫺0.04, 0.03) 0.011 (⫺0.03, 0.03) 0.77
aPvalue for the interassay comparison between tube 1 and tube 2.
on May 16, 2020 by guest
http://jcm.asm.org/
[image:4.585.41.545.657.729.2]among both NTM and non-NTM individuals in our cohort, suggesting that the new
QFT-Plus assay is unlikely to be false positive in most cases of pulmonary NTM.
To date, the specificity of the new QFT-plus assay has received little evaluation.
Barcellini et al. recently evaluated QFT-Plus (7) and found a specificity of 97.17% among
106 low-risk persons and zero indeterminate results. The calculated specificity was
similar to that found in our study, and interestingly, among the three positive patients
in that study, only one had concordant positive results between tube 1 and tube 2
QFT-Plus antigen tubes. The remaining two study subjects had discordant tube 1/tube
2 results, similar to our study, in which two of the five subjects with positive results
lacked concordant tube 1/tube 2 results, and both of these cases were negative by the
QFT-GIT assay. This discordance suggests the possibility that such results were false
positive. While the lack of a gold standard makes such a conclusion speculative, we
believe that enrollees with concordant tube 1/tube 2 results, in addition to a positive
QFT-GIT result, are more likely to have LTBI. Consistent with this thinking, a recent study
from Stanford University (22) among low-risk health care workers examined the use of
a conservative definition of a positive QFT-Plus conversion by requiring positive results
in both the tube 1 and tube 2 antigen tubes (rather than the manufacturer’s use of
either tube being positive). Similar to our study, the Stanford University study found
among 626 health care workers with no LTBI risks that the QFT-GIT and QFT-Plus
specificity was 97.9% and 97%, respectively. Using the conservative definition
neces-sitating concordant positive tube 1 and tube 2 results, the QFT-Plus specificity
in-creased to 99% (
P
⫽
0.07). In our study, if we used this approach and classified the two
individuals with discordant positive tube 1/tube 2 results as being overall test negative,
then the specificity would be similar at 98.9%.
There is a lack of data assessing IGRA specificity in the population of patients with
NTM (15, 23), and to our knowledge, no prior study has evaluated IGRAs within a cohort
of patients with pulmonary
M. avium
or
M. abscessus
infection. Together, these two
species account for more than 90% of cases of pulmonary NTM disease in the United
States (24, 25). Among our NTM cohort, only 1 of 51 patients was positive by either the
QFT-GIT or QFT-Plus assay, and they were concordantly positive by both assays, with,
in addition, both tube 1/tube 2 being positive as well. This individual was infected with
MAC and had concurrent cystic fibrosis, and after repeated interviews, absolutely no TB
risk factors could be elicited. The subject was retested outside this protocol with an
additional QFT-GIT test and remained positive. Lastly, there was one patient with
indeterminate results, which were concordant in both assays due to a low mitogen
control result. This individual was receiving hydroxychloroquine (200 mg daily) for
lupus that was not initially reported.
[image:5.585.41.372.95.186.2]ATS, IDSA, and the U.S. Centers for Disease Control and Prevention have jointly
published new recommendations/guidelines for the diagnosis of
M. tuberculosis
infec-tion, including LTBI (26). Their new recommendations for LTBI diagnostic testing are
based on the likelihood of infection with
M. tuberculosis
and, if the individual is infected,
the likelihood of progression to TB disease. The new testing strategy recommends dual
testing in some situations, and with dependence on the probability of prior exposure
TABLE 4Stimulated TB antigen-nil IFN-␥concentration for participants with at least one positive test result
Participant NTM infection status
Mean (IQR) IFN-␥concn (IU/ml)a
QFT-GIT
QFT-Plus
Tube 1 Tube 2
1 No 0.09 0.4a ⫺0.24
2 No 0.01 0.01 5.44a
3 No 0.56a 0.66a 0.73a
4 No 0.43a 0.37a 0.46a
5 Yes (MAC) 1.25a 0.54a 0.77a
aThe value is above the 0.35-IU/ml cutoff point considered positive.
on May 16, 2020 by guest
http://jcm.asm.org/
and the risk of progression if the individual is infected, utilization of the results from two
tests (IGRA or TST) is recommended. This strategy is in line with prior recommendations
(27, 28). The results from our study might suggest the possibility that the new QFT-Plus
assay could assist in such a two-test strategy. If two antigen tubes of QFT-Plus are
considered dual IGRA testing within a single assay, it would follow that result
inter-pretation could take the same risk-stratified approach suggested by current LTBI testing
guidelines. Results from both the study of Barcellini et al. (7) and the Stanford University
study (22) support this risk-stratified approach, whereby requiring positivity in both
tubes could maximize specificity and potentially minimize false-positive results.
How-ever, if the patient had a risk of exposure and a high risk of progression, then accepting
either one as positive in defining a positive assay result would provide maximal
sensitivity.
Our study was limited by its relatively small size and the lack of a gold standard
assay for LTBI with which to compare assay results. Our study provides reassurance that
the new QFT-Plus assay will not cross-react with most clinically important NTM, such as
MAC and
M. abscessus
. We were not able to assess this question in regard to other NTM
species, like
M. marinum
or
M. kansasii
, which contain ESAT-6 and CFP-10 and are
known to cause positive IGRA results (29–31).
In summary, our study found the performance of the QFT-Plus test to have a similar
and acceptable specificity in a low-risk population in comparison to the specificity of
the QFT-GIT assay. Our study adds to the small body of literature on IGRA specificity in
the NTM population. Future studies should evaluate the outcomes for individuals with
discordant tube 1/tube 2 results among both high-risk and low-risk populations. It is
possible that a definition of overall test positivity that necessitates interassay
concor-dance between tube 1 and tube 2 could have higher utility in screening low-risk
populations, whereby specificity is preferred.
ACKNOWLEDGMENTS
We thank the participants who graciously consented to participate in this study. We
acknowledge Megan Wardrop for her help.
We all contributed to the study design, interpretation of the analyses, and critical
revision of the manuscript.
This work was supported by Qiagen, Inc.
K.L.W. has received an investigator-initiated grant from Qiagen, Inc.
REFERENCES
1. Nahid P, Dorman SE, Alipanah N, Barry PM, Brozek JL, Cattamanchi A, Chaisson LH, Chaisson RE, Daley CL, Grzemska M, Higashi JM, Ho CS, Hopewell PC, Keshavjee SA, Lienhardt C, Menzies R, Merrifield C, Narita M, O’Brien R, Peloquin CA, Raftery A, Saukkonen J, Schaaf HS, Sotgiu G, Starke JR, Migliori GB, Vernon A. 2016. Official American Thoracic Society/Centers for Disease Control and Prevention/Infectious Diseases Society of America clinical practice guidelines: treatment of drug-susceptible tuberculosis. Clin Infect Dis 63:e147– e195.https://doi.org/ 10.1093/cid/ciw376.
2. Qiagen. 2013. QuantiFERON TB Gold (QFT) ELISA package insert. Qiagen, Hilden, Germany.http://www.quantiferon.com/irm/content/PI/QFT/2PK/ UK.pdf. Accessed 7 October 2016.
3. Qiagen. 2015. QuantiFERON-TB Gold Plus ELISA package insert. Qiagen, Hilden, Germanyhttp://www.quantiferon.com/irm/content/package-inserts .aspx. Accessed 7 October 2016.
4. Lalvani A, Brookes R, Wilkinson RJ, Malin AS, Pathan AA, Andersen P, Dockrell H, Pasvol G, Hill AV. 1998. Human cytolytic and interferon gamma-secreting CD8⫹T lymphocytes specific for Mycobacterium
tu-berculosis. Proc Natl Acad Sci U S A 95:270 –275.
5. Lewinsohn DM, Zhu L, Madison VJ, Dillon DC, Fling SP, Reed SG, Grab-stein KH, Alderson MR. 2001. Classically restricted human CD8⫹T
lym-phocytes derived from Mycobacterium tuberculosis-infected cells: defi-nition of antigenic specificity. J Immunol 166:439 – 446.https://doi.org/ 10.4049/jimmunol.166.1.439.
6. Lewinsohn DA, Winata E, Swarbrick GM, Tanner KE, Cook MS, Null MD,
Cansler ME, Sette A, Sidney J, Lewinsohn DM. 2007. Immunodominant tuberculosis CD8 antigens preferentially restricted by HLA-B. PLoS Pat-hog 3:1240 –1249.https://doi.org/10.1371/journal.ppat.0030127. 7. Barcellini L, Borroni E, Brown J, Brunetti E, Codecasa L, Cugnata F, Dal
Monte P, Di Serio C, Goletti D, Lombardi G, Lipman M, Rancoita PM, Tadolini M, Cirillo DM. 2016. First independent evaluation of QuantiFERON-TB Plus performance. Eur Respir J 47:1587–1590.https:// doi.org/10.1183/13993003.02033-2015.
8. Day CL, Abrahams DA, Lerumo L, Janse van Rensburg E, Stone L, O’Rie T, Pienaar B, de Kock M, Kaplan G, Mahomed H, Dheda K, Hanekom WA. 2011. Functional capacity of Mycobacterium tuberculosis-specific T cell responses in humans is associated with mycobacterial load. J Immunol 187:2222–2232.https://doi.org/10.4049/jimmunol.1101122.
9. Rozot V, Vigano S, Mazza-Stalder J, Idrizi E, Day CL, Perreau M, Lazor-Blanchet C, Petruccioli E, Hanekom W, Goletti D, Bart PA, Nicod L, Pantaleo G, Harari A. 2013. Mycobacterium tuberculosis-specific CD8⫹T
cells are functionally and phenotypically different between latent infec-tion and active disease. Eur J Immunol 43:1568 –1577.https://doi.org/ 10.1002/eji.201243262.
10. Nikolova M, Markova R, Drenska R, Muhtarova M, Todorova Y, Dimitrov V, Taskov H, Saltini C, Amicosante M. 2013. Antigen-specific CD4- and CD8-positive signatures in different phases of Mycobacterium tubercu-losis infection. Diagn Microbiol Infect Dis 75:277–281.https://doi.org/10 .1016/j.diagmicrobio.2012.11.023.
11. Chiacchio T, Petruccioli E, Vanini V, Cuzzi G, Pinnetti C, Sampaolesi A,
on May 16, 2020 by guest
http://jcm.asm.org/
Antinori A, Girardi E, Goletti D. 2014. Polyfunctional T-cells and effector memory phenotype are associated with active TB in HIV-infected pa-tients. J Infect 69:533–545.https://doi.org/10.1016/j.jinf.2014.06.009. 12. Ongaya A, Huante MB, Mwangi P, Keiser PH, Amukoye E, Endsley JJ.
2013. Mycobacterium tuberculosis-specific CD8⫹T cell recall in
conva-lescing TB subjects with HIV co-infection. Tuberculosis (Edinb) 93(Suppl): S60 –S65.https://doi.org/10.1016/S1472-9792(13)70012-X.
13. Lancioni C, Nyendak M, Kiguli S, Zalwango S, Mori T, Mayanja-Kizza H, Balyejusa S, Null M, Baseke J, Mulindwa D, Byrd L, Swarbrick G, Scott C, Johnson DF, Malone L, Mudido-Musoke P, Boom WH, Lewinsohn DM, Lewinsohn DA, Tuberculosis Research Unit. 2012. CD8⫹T cells provide an
immunologic signature of tuberculosis in young children. Am J Respir Crit Care Med 185:206 –212.https://doi.org/10.1164/rccm.201107-1355OC. 14. Andersen P, Munk ME, Pollock JM, Doherty TM. 2000. Specific
immune-based diagnosis of tuberculosis. Lancet 356:1099 –1104.https://doi.org/ 10.1016/S0140-6736(00)02742-2.
15. Hermansen TS, Thomsen VO, Lillebaek T, Ravn P. 2014. Non-tuberculous mycobacteria and the performance of interferon gamma release assays in Denmark. PLoS One 9:e93986.https://doi.org/10.1371/journal.pone .0093986.
16. Arend SM, van Meijgaarden KE, de Boer K, de Palou EC, van Soolingen D, Ottenhoff TH, van Dissel JT. 2002. Tuberculin skin testing and in vitro T cell responses to ESAT-6 and culture filtrate protein 10 after infection with Mycobacterium marinum or M. kansasii. J Infect Dis 186:1797–1807.
https://doi.org/10.1086/345760.
17. Lewis FM, Marsh BJ, von Reyn CF. 2003. Fish tank exposure and cuta-neous infections due to Mycobacterium marinum: tuberculin skin test-ing, treatment, and prevention. Clin Infect Dis 37:390 –397.https://doi .org/10.1086/376628.
18. Griffith DE, Aksamit T, Brown-Elliott BA, Catanzaro A, Daley C, Gordin F, Holland SM, Horsburgh R, Huitt G, Iademarco MF, Iseman M, Olivier K, Ruoss S, von Reyn CF, Wallace RJ, Jr, Winthrop K, ATS Mycobacterial Disease Subcommittee, American Thoracic Society, Infectious Disease Society of America. 2007. An official ATS/IDSA statement: diagnosis, treatment, and prevention of nontuberculous mycobacterial diseases. Am J Respir Crit Care Med 175:367– 416.https://doi.org/10.1164/rccm .200604-571ST.
19. Lempp JM, Zajdowicz MJ, Hankinson AL, Toney SR, Keep LW, Mancuso JD, Mazurek GH. 2017. Assessment of the QuantiFERON-TB Gold In-Tube test for the detection of Mycobacterium tuberculosis infection in United States Navy recruits. PLoS One 12:e0177752.https://doi.org/10.1371/ journal.pone.0177752.
20. American Thoracic Society. 2000. Targeted tuberculin testing and treat-ment of latent tuberculosis infection. MMWR Recommend Rep 49(RR-6):1–51.
21. McHugh ML. 2012. Interrater reliability: the kappa statistic. Biochem Med (Zagreb) 22:276 –282.https://doi.org/10.11613/BM.2012.031.
22. Moon HW, Gaur RL, Tien SS, Spangler M, Pai M, Banaei N. 2017. Evalu-ation of QuantiFERON-TB Gold-Plus in health care workers in a low-incidence setting. J Clin Microbiol 55:1650 –1657. https://doi.org/10 .1128/JCM.02498-16.
23. Wang MS, Wang JL, Wang XF. 2016. The performance of interferon-gamma release assay in nontuberculous mycobacterial diseases: a ret-rospective study in China. BMC Pulm Med 16:163.https://doi.org/10 .1186/s12890-016-0320-3.
24. Henkle E, Hedberg K, Schafer S, Novosad S, Winthrop KL. 2015. Population-based incidence of pulmonary nontuberculous mycobacte-rial disease in Oregon 2007 to 2012. Ann Am Thorac Soc 12:642– 647.
https://doi.org/10.1513/AnnalsATS.201412-559OC.
25. Prevots DR, Shaw PA, Strickland D, Jackson LA, Raebel MA, Blosky MA, Montes de Oca R, Shea YR, Seitz AE, Holland SM, Olivier KN. 2010. Nontuberculous mycobacterial lung disease prevalence at four inte-grated health care delivery systems. Am J Respir Crit Care Med 182: 970 –976.https://doi.org/10.1164/rccm.201002-0310OC.
26. Lewinsohn DM, Leonard MK, LoBue PA, Cohn DL, Daley CL, Desmond E, Keane J, Lewinsohn DA, Loeffler AM, Mazurek GH, O’Brien RJ, Pai M, Richeldi L, Salfinger M, Shinnick TM, Sterling TR, Warshauer DM, Woods GL. 2017. Official American Thoracic Society/Infectious Diseases Society of America/Centers for Disease Control and Prevention clinical practice guidelines: diagnosis of tuberculosis in adults and children. Clin Infect Dis 64:e1– e33.https://doi.org/10.1093/cid/ciw694.
27. Winthrop KL, Weinblatt ME, Daley CL. 2012. You can’t always get what you want, but if you try sometimes (with two tests—TST and IGRA—for tuberculosis) you get what you need. Ann Rheum Dis 71:1757–1760.
https://doi.org/10.1136/annrheumdis-2012-201979.
28. Mariette X, Baron G, Tubach F, Liote F, Combe B, Miceli-Richard C, Flipo RM, Goupille P, Allez M, Salmon D, Emilie D, Carcelain G, Ravaud P. 2012. Influence of replacing tuberculin skin test with ex vivo interferon gamma release assays on decision to administer prophylactic antituberculosis antibiotics before anti-TNF therapy. Ann Rheum Dis 71:1783–1790.
https://doi.org/10.1136/annrheumdis-2011-200408.
29. van Ingen J, de Zwaan R, Dekhuijzen R, Boeree M, van Soolingen D. 2009. Region of difference 1 in nontuberculous Mycobacterium species adds a phylogenetic and taxonomical character. J Bacteriol 191:5865–5867.
https://doi.org/10.1128/JB.00683-09.
30. Mahairas GG, Sabo PJ, Hickey MJ, Singh DC, Stover CK. 1996. Molecular analysis of genetic differences between Mycobacterium bovis BCG and virulent M. bovis. J Bacteriol 178:1274 –1282.https://doi.org/10.1128/jb .178.5.1274-1282.1996.
31. Harboe M, Andersen P, Colston MJ, Gicquel B, Hermans PW, Ivanyi J, Kaufmann SH. 1996. European Commission COST/STD Initiative. Report of the Expert Panel IX. Vaccines against tuberculosis. Vaccine 14: 701–716.