6
I
January 2018
An Efficacious Graphical User Interface
Implementation for Automatic Classification of
Brain Tumor from Magnetic Resonance Imaging
Images Using Image Processing
Hardik Modi1, Neha Baraiya2, Himanshu Patel3
1, 3
Charotar University of Science and Technology-388421,Gujarat,India
Abstract: Biomedical image processing is an emerging field, and is very useful for automatic disease diagnosis. Brain tumor classification is performed using image processing toolbox of MATLAB over here. For tumor classification: Image Preprocessing, Segmentation and feature Analysis are essential steps, these steps are described in the paper. First of all, images were filtered by Gaussian filter, then tumor part i.e. regions having high intensity are enhanced using power low transform in order to neglect insufficient data from image. Then enhanced part was extracted and denoising was performed to get tumor region only at output. By the method we have got only tumor part having high intensity and all other part of brain considered as background. After tumor segmentation, feature analysis has been made by which we can get idea that how they differs into normal and benign or malignant tumors. Then classified based on feature analysis of tumor region, all the processes have been done over dataset of 45 Brain Tumor images. Here overall Accuracy of correct classification is got to be 97.78%, where normal brain is classified with 100%, benign with 95% and malignant with 100% accuracy. A Graphical User Interface (GUI) is developed in MATLAB to perform all the task and to test proposed work. In future, everything would be going to be computer assisted. This is a step toward automatic disease diagnosis using Computer Aided Design (CAD).
Keywords: Classification, Feature Extraction, GUI, Image Processing, Segmentation, Tumor.
I. INTRODUCTION
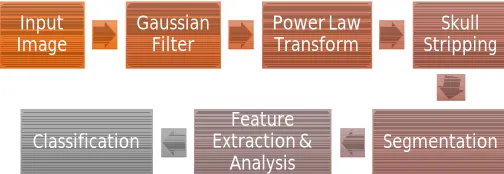
[image:2.612.179.431.633.720.2]Automatic brain tumor segmentation and classification is emerging area of research, now days. Simplest and efficient method is described here, which do not require training and testing phase. Unsupervised classification is done after feature Analysis, and hence the proposed method is fast in computational complexity and accurate method. Nandpuru H.B. et al. have classified brain tumor using SVM, where they have first converted RGB to gray, then applied median filtering and skull masking using morphological opening, region filling and power law transform. Then extracted features and after that classified using SVM [1].Siva Sankari S., et al. have Segmented tumor part using k-mean clustering, and extracted features using GLCM and Gabor filter, where Analysis is done over 45 images[2].Ehab F. Badran, Esraa Galal Mahmoud, and Nadder Hamdy [3] have constructed GUI using MATLAB to test their proposed work. The methods proposed by them are: preprocessing by image edge expansion; segmentation using canny edge detection or adaptive thresholding; feature extraction using Harris method; classification using neural network. Chavan, Nikita V., B. D. Jadhav, and P. M. Patil [4] have preprocessed image with Gaussian filter, and enhancement has performed using histogram equalization, binarization is performed for image segmentation and GLCM features have extracted and finally classification is done using kNN classifier. They have classified brain MRI images in two classes, whether tumor is present or not i.e. brain is normal or abnormal. In this paper, proposed methods are: Image preprocessing, power law transform, segmentation, feature extraction and selection, Classification as shown in figure 1.
FIGURE 1.Process flow diagram
II.METHODOLOGY A. Filter Image
For medical image processing, preprocessing stage is an essential step, used to improve image quality and noise reduction [5]. This preprocessing step includes image filtering, required prior to the main information extraction and data analysis. There are various special filters available in image processing, and among them selection of optimal filter for the particular application is really a crucial task. In MRI, Rician noise[6] is present often, in order to remove the noise Gaussian filter is used here. Figure 3(b) shows Gaussian filtered image, where sharpness of image is got reduced, and noise became inefficient so that it will not have adverse effect on result [7].
B. Power law transform followed by morphological operation:
Filtered image is then applied to contrast stretching to enhance tumor contained region using power law Trans form. It is the basic type of gray level transform used for image enhancement in order to better visualization effect of an image [1], [9]. Here main advantage of power law transform is that it helps to strip the skull out of brain image, which increases the accuracy of segmentation. Power law transform works based on the following equations, figure 3(c) is showing the output of this step:
Let us take input image ( , ) and ( , ) output image and consider equation 1 and 2.
= ( )
……….……….. (1)
= ∗
………….…….. (2)
Where denotes the intensity of and the intensity of , and are coefficients, which decides shape of curve. The power-law
[image:3.612.135.466.361.659.2]transformation curve is shown in figure 2. After transforming intensity adjustment is performed of the transformed image.
FIGURE 2. power-law transformation curve [9]
(a). Input Image [15]
(b). Gaussian Filtered (c). Power law
transform
[image:4.612.91.520.76.198.2](d) Reconstructed Image
FIGURE 3. Image Preprocessing Steps
C. Segmentation:
In biomedical diagnosis of disease, segmentation is an essential stage. Segmentation refers to partitioning image into the regions, which are having similar textures in a meaningful way [10]. In medical applications like locate tumor, blood vessel segmentation, blood cancer detection, retinal vessel segmentation, surgery planning, knee joint cartilage thickness measurement, study of anatomical structures includes segmentation is at its key part. This stage is having advantage that while diagnosis, there is no need to analyze whole image and instead analyze only the segmented part so that computational complexity and memory requirement will be less. Hence now onward for all steps, segmented tumor is considered for analysis to yield benefits of this process.
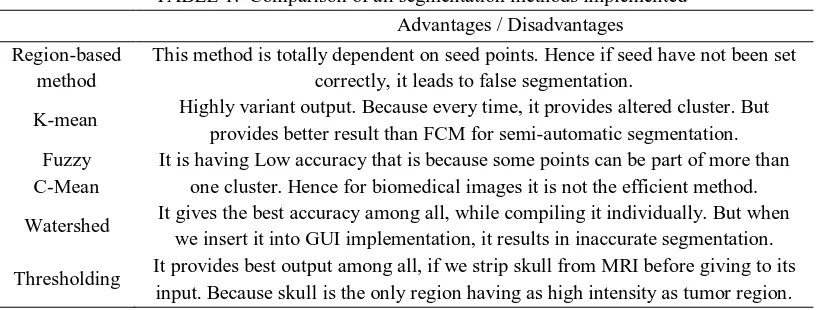
Various segmentation methods implemented are shown here with [7], [8], and [9]:
1) Thresholding
2) Watershed
3) Region based
4) Clustering methods
All the methods are intensity dependent. Sometimes it may happen that regions excluding tumor region may have intensity same as tumor part intensity value, hence it is challenging task to segment tumor part correctly (In all the segmentation methods, preprocessing step discussed above had not been apply).
Advantages and disadvantages of all the methods are discussed in below table 1.
TABLE 1. Comparison of all segmentation methods implemented Advantages / Disadvantages Region-based
method
This method is totally dependent on seed points. Hence if seed have not been set correctly, it leads to false segmentation.
K-mean Highly variant output. Because every time, it provides altered cluster. But
provides better result than FCM for semi-automatic segmentation. Fuzzy
C-Mean
It is having Low accuracy that is because some points can be part of more than one cluster. Hence for biomedical images it is not the efficient method.
Watershed It gives the best accuracy among all, while compiling it individually. But when
we insert it into GUI implementation, it results in inaccurate segmentation.
Thresholding It provides best output among all, if we strip skull from MRI before giving to its
input. Because skull is the only region having as high intensity as tumor region.
[image:4.612.103.515.473.628.2]Among all methods accuracy of segmented tumor part using FCM, region based, thresholding, watershed method and K-mean are 79.15, 87.48, 91.34and 92.76 and 94.72% respectively [7]. The image segmentation is shown in below figure 5.
Input Image [16] Thresholding Watershed
[image:5.612.181.436.114.362.2]region grow k-mean Fuzzy C Mean
FIGURE 4. Comparison of all the segmentation methods implemented [7]
(a). Ground Truth Image [15]
(b). Segmented Tumor part
FIGURE 5. Tumor Segmentation
D. Feature extraction
Features are important part of any image, they used to describe the whole image and are unique for each image. Feature extraction is to be performed in order to reduce the processing time and complexity in the further stages i.e. image analysis. Various feature extraction methods are GLCM,GLRLM, wavelet, PCA, LDA, Fast Fourier transform, Histogram leveling and many more. It is most important stage after segmentation for classification.
Gray Level Co-occurrence matrix (GLCM), is used here for feature extraction. This was initially proposed by R.M. Haralick [11]-a statistical method to examine texture features, generally it is used to measure textures of an image. The features, described below can be extracted by this extraction technique. This method shows how textures are spatially dependent, various GLCM properties are described below [2], [4], [11], [12], [13], and [14]:
1) Energy: Energy is the sum of squared elements in the GLCM; it ranges from 0 to 1and can be shown as equation (1). Energy is
= ( , )
,
……… (1)
2) Contrast: Contrast is a measure of the difference between maximum intensity and minimum intensity of an image, it ranges
from 0 to ( ( , 1) − 1) . It also known as variance and inertia. Mathematical definition of contrast can be given as
equation (2). Contrast is 0 for a constant image.
= | − | ( , )
,
……… (2)
3) Correlation: Correlation is a measure of how a pixel and its neighboring pixels are correlated over the whole image; it ranges from -1 to 1. Mathematically it can be represented as equation. Correlation is 1 for a perfectly positively and -1 for the
negatively correlated image and for a constant image.
= ( −µ)( −µ) ( , )
,
.….…… (3)
4) Homogeneity: It is the measure of how the distribution of elements in the GLCM to the GLCM diagonal is closed to each other. It ranges from 0 to 1. Mathematically represented by equation (3). Homogeneity is 1 for a diagonal GLCM.
= ( , )
1 + | − |
,
…..….. (4)
5) Entropy: Entropy is a statistical measure of uncertainty (randomness)which could be used to characterize the texture of the input image.
= ( ( , ) ∗ ( , ))
,
……….. (5)
E. Feature Analysis
Next step is a feature selection, this step tells which features are important, and also help to remove unnecessary features. These “unnecessary features” may reduce the quality of classification, so it's important to remove them. After feature selection, one would have only "import features" - in this case will be a set of coefficient of GLCM. The features extracted by the above method, are analyzed and concluded that we can classify tumor by using correlation, homogeneity, size, location and entropy features. As benign tumors are more homogeneous than malignant and are having less size and entropy than malignant, and benign tumors have more roundness in its shape than malignant and generally benign tumors are associated with skull, hence by using neighborhood pixels of skull one can detect benign tumor.
F. Classification.
Here classification is followed by feature analysis, where we have studied features of all the types of tumor. By that we have concluded that for normal brain MRI images correlation is having value NaN. That is because there will not be any tumor part contained in image and ultimately in segmented output, image would be static. For static image correlation is having NaN value. Than for benign and malignant tumor containing brain MRI images, homogeneity and contrast features would be selected to classify. Hence we can say that further classification can be done based on Homogeneity and contrast. Threshold value of both the features has been decided after analysis, as between specific value, tumor is having particular type.
III. RESULTS AND DISCUSSION
matrix for feature Extraction. The selected features used for classification are homogeneity, contrast and entropy analyzed as in charts shown below, how they varies in each types of tumor, and extracted features of several image are shown in table 2.
TABLE 2. Features Extracted form segmented tumor image.
Homogeneity Correlation Contrast Energy Entropy
Image 1 (normal brain) 1 NaN 0 1 0
Image 2 (benign) 0.998643 0.947244 0.002715 0.94583 0.175795
Image 3 (benign) 0.998684 0.958025 0.0026315 0.934682 0.205439
Image 4 (benign) 0.998761 0.938635 0.0024781 0.957146 0.14412
Image 5 (benign) 0.998257 0.976719 0.0034852 0.846824 0.405832
Image 6 (benign) 0.998738 0.934241 0.0025238 0.959103 0.138461
0.988 0.99 0.992 0.994 0.996 0.998 1
Homogeneity
0 0.0050.01 0.0150.02 0.025
Contrast
0 0.2 0.4 0.6 0.8
Image 7 (malignant) 0.995437 0.961866 0.0091259 0.751649 0.579965
Image 8 (malignant) 0.994502 0.963789 0.0109968 0.685437 0.693789
Image 9 (malignant) 0.995649 0.954818 0.0087019 0.798776 0.492308
Image 10 (malignant) 0.995406 0.943761 0.0091871 0.827539 0.434061
TP: Abnormal Brain Correctly classified with one of the Brain Tumor Type TN: Normal Brain Correctly classified as normal brain
FP: Abnormal Brain Incorrectly classified as Normal Brain
FN: Normal Brain Incorrectly classified with one of the Brain Tumor Type.
1) Sensitivity = 100%
2) Specificity = 100%
3) Accuracy = ( )
[image:8.612.185.426.206.568.2]( ) 100 %
TABLE 1. Classified tumor accuracy
Correct Segmentation Accuracy
Benign 19/20 95%
Malignant 20/20 100%
Normal brain 5/5 100%
Table 3 shows how accurately brain MRI images are classified, 44 images are correctly classified among 45 input images,and hence overall accuracy is got to be 97.78%.Here the lack of accuracy is due to error in segmentation, if segmentation is happening correctly then result do not deviate and correctly classifies the tumor type. Hence it is only desirable to segment tumor part correctly and for that we need optimal segmentation technique. Both sensitivity and specificity have been got to be 100%, because no normal brain is misclassified as any of the abnormal brain, and any tumor containing brain are not misclassified as normal. Misclassification done only in between malignant and benign. For GLCM method results are not very good but acceptable. To show accuracy, confusion matrix is generally used, which is also known as an error matrix. It is having two dimensions: one is actual and second one is predicted. The confusion matrix for the proposed method is shown in figure 6. From confusion matrix, it is clear that normal and malignant tumor are classified with error rate is 0%, benign tumor is classified with 5% error rate, the average error rate is 1.67%.
A. GUI Implementation
[image:9.612.117.498.122.698.2]Graphical User Interface is generally used for the people who are not having knowledge of particular software, but can take advantage of that software. As GUI is user friendly, it is easy to use and handy for everyone. Here GUI is developed using MATLAB 8.0.0.783 (2012b), figure 7, 8, and 9 shows GUI simulation of the work.
FIGURE 7.Simulation of Malignant Brain Tumor Image [17]
[image:9.612.124.491.130.314.2]FIGURE 8.Simulation of Benign Brain Tumor Image [18]
IV. CONCLUSION
The classification is done using feature analysis of segmented brain MRI image. Gaussian filter is the most suitable filter for MRI images, as it reduces artifacts from image without reducing its quality. Power law transform followed by morphological process is used for contrast stretching and skull stripping, so that useless data can be removed from image. Various segmentation methods, their advantages and downfalls are discussed, and their accuracy has been calculated. Accuracy is got reduced, because brain skull is having as high intensity as tumor, which causing interfere in segmented output. As skull is already stripped using above stage, tumor region is the only part of an image having high intensity, thresholding is the best way to segment tumor, because it is quick and simple technique. GLCM features provide robust information of segmented image, and that’s why it is the best suitable feature extraction method. After feature extraction, feature analysis has been done in order to select only salient features, which can be used to classify tumor. Here classification is done based on homogeneity, correlation, entropy, shape, size and location of tumor. Classification accuracy is got to be 97.78%.
V.ACKNOWLEDGEMENT
We would like to thank the Charotar University of Science and Technology for its constant support all the way through our work. And thankful to Dr. Purnima Dinge, the radiologist of Charusat Healthcare and Research Foundation (CHRF) for useful information in brain oncology.
REFERENCE
[1] Nandpuru, Hari Babu, S. S. Salankar, and V. R. Bora. "MRI brain cancer classification using support vector machine." In Electrical, Electronics and Computer Science (SCEECS), 2014 IEEE Students' Conference on, pp. 1-6. IEEE, 2014.
[2] SivaSankari S., Sindhu M., Sangeetha R. and ShenbagaRajan A. “Feature Extraction of Brain Tumor Using MRI.” In International Journal of Innovative Research in Science, Engineering and Technology, 2014, 3(3): pp. 10281-6
[3] Badran, Ehab F., EsraaGalal Mahmoud, and NadderHamdy. "An algorithm for detecting brain tumors in MRI images." In Computer Engineering and Systems (ICCES), 2010 International Conference on, pp. 368-373. IEEE, 2010.
[4] Chavan, Nikita V., B. D. Jadhav, and P. M. Patil. "Detection and Classification of Brain Tumors." International Journal of Computer Applications 112, no. 8 (2015).
[5] Rajeshwari, S., and T. SreeSharmila. "Efficient quality analysis of MRI image using preprocessing techniques." In Information & Communication Technologies (ICT), 2013 IEEE Conference on, pp. 391-396. IEEE, 2013.
[6] Sasirekha, N., and K. R. Kashwan. "Improved segmentation of MRI brain images by denoising and contrast enhancement." Indian Journal of Science and Technology 2015, 8(22).
[7] Baraiya, N. and Modi, H.“Comparative Study of Different Methods for Brain Tumor Extraction from MRI Images using Image Processing.” Indian Journal of Science and Technology, 2016 9(4): 1-5.
[8] Ghosh, Soumi, and Dubey S. K. "Comparative analysis of k-means and fuzzy c-means algorithms." International Journal of Advanced Computer Science and Applications 2013, 4(4) pp. 34-39
[9] Gonzalez R. C., and Woods R. E. "Digital image processing." Prentice Hall, 2002.
[10] Bankman I. Handbook of medical image processing and analysis. SAN Diego, USA: Academic Press; 2008.
[11] R.M Haralick and K. Shanmugam. Textural features for image classification. IEEE Transactions on Systems, Man, and Cybernetics SMC-3, 1973, 6(6): 610-21.
[12] Goswami, Suparna, and Lalit Kumar P. Bhaiya. "A hybrid neuro-fuzzy approach for brain abnormality detection using GLCM based feature extraction." In Emerging Trends in Communication, Control, Signal Processing & Computing Applications (C2SPCA), 2013 International Conference on, pp. 1-7. IEEE, 2013
[13] Jain, Shweta. "Brain Cancer Classification Using GLCM Based Feature Extraction in Artificial Neural Network." International Journal of Computer Science & Engineering Technology 4, no. 07 (2013).
[14] Zulpe, Nitish, and VrushsenPawar. "GLCM textural features for brain tumor classification." IJCSI International Journal of Computer Science Issues 9, no. 3 (2012): 354-359.
[15] Figure 3(a)& 5(a) [Online]. Available at: http://jessicaoldwyn.blogspot.in/2010_04_01_archive.html. Date accessed: 1 January 2018 [16] Input Figure 4 [Online]. Available at: http://www.drtimothysteel.com.au/brain-tumors/. Date Accessed: 1 January 2018
![FIGURE 2. power-law transformation curve [9]](https://thumb-us.123doks.com/thumbv2/123dok_us/8296060.852901/3.612.135.466.361.659/figure-power-law-transformation-curve.webp)
![FIGURE 4. Comparison of all the segmentation methods implemented [7]](https://thumb-us.123doks.com/thumbv2/123dok_us/8296060.852901/5.612.181.436.114.362/figure-comparison-segmentation-methods-implemented.webp)

![FIGURE 7.Simulation of Malignant Brain Tumor Image [17]](https://thumb-us.123doks.com/thumbv2/123dok_us/8296060.852901/9.612.117.498.122.698/figure-simulation-of-malignant-brain-tumor-image.webp)
