5
IX
September 2017
Comparitive Study on Behavior of Shear Walls at
Different Locations in a High Rise Structure
Sahithya Boyina1, Gorantla Yaswanth2 1,2
Department of civil engineering, Velagapudi Ramakrishna Siddhartha Engineering College
Abstract: Shear walls are structural members used to improve strength and stiffness of RCC structures. The effective and efficient location of shear walls plays a major role especially in seismic evaluation of a building. Equal length shear walls are placed symmetrically on outer corners of a structure. Whenever the outer shear walls cannot offer enough strength, to provide more stiffness to the structure shear walls are also provided to the building indoors. In some cases, whenever the span-width ratio is exceeded it is essential to provide shear walls. In present study a high rise structure (G+14) is analysed by placing shear walls at different locations like in x- direction, y- direction, at the centre of the plan. The parameters like shear force, bending moment, deflection etc are determined by using CYPECAD software.
Keywords: Shear walls, CYPECAD 2017, deflection, base shear, reinforcement, shear force and bending Moment.
I. INTRODUCTION
A. What causes lateral loads?
Lateral loads results from wind or earth quake actions and both can cause a collapse of improperly braced building. The way that wind and earth quake load acts on a building differs completely, but they have the same general effect. There are two sources of lateral loads. They are
1) Wind load: Wind load is the weight performing on a shape due to the wind movement at the building. Wind load in the course of a storm can remaining hours and a constructing reviews sustained wind load and gusts. While the wind loads are treated as static for the reason of layout, however in fact they are not.
2) Earthquake load: These earthquake loads are a result of the floor motions which are additionally dynamic in nature. The magnitude of an earth quake pressure depends on importance of the earthquake, distance from the earth quake supply. In theory and exercise, the lateral force that a constructing studies from an earthquake increases in direct proportion with the acceleration of floor movement. As the ground hastens to and fro for the duration of an earthquake it imparts forces to the building through its basis that is pressured to move with the floor. A very mild structure including material tent could be undamaged in an earth quake however it's going to now not continue to exist excessive wind. The reason is low mass of the tent. That is the reason why residential homes carry out properly in earth quakes and more vulnerable in high wind load inclined areas.
B. Why are buildings with shear walls preferred in seismic zones?
RC buildings frequently have vertical plate like RC partitions called shear partitions similarly to slabs, beams and columns. These partitions commonly start at basis degree and are non-stop throughout the constructing peak. Shear partitions are supplied typically along both duration and width of homes. In beyond earth quakes, even buildings with sufficient amount of partitions that were no longer specifically designed for seismic performance had been saved from collapse. Shear wall homes are a popular desire in many earth quake susceptible international locations like Chile, New Zealand and USA. Shear partitions are efficient and are clean to construct..
When a building is subjected to wind or earth quake load, various types of failure must be prevented:
1) Sliding
2) Anchorage failure
3) Drift
4) Collapse
II. LITERATUREREVIEW
They investigated on the outcomes of one of a kind area of shear wall on deflection in a high upward thrust building utilizing E-tabs. As per discussion of results they concluded that there's marginal discount in deflection, via introducing side centre shear wall, shear wall at centre. However the deflection is diminished tremendously by way of introducing shear wall at corners and sideways as shown in Fig. 1
Fig. 1
B. K lova raju & dr. Kv balaji (2015)
They did research on effective area of shear wall subjected to earth quake loading. Consistent with their results from Fig. 2 they concluded that by placing shear wall in the place showed beneath, the bottom shear improved via 9.82% in comparison with the wall without shear wall and the lateral displacement lowered with the aid of 26.7% in comparison with the wall without shear wall.
Fig. 2
C. Pooja Gupta And Am Pande (2014)
They did study on offering extra shear walls In one-of-a-kind recommendations and likewise on the changes that befell in the constructing homes with broaden in percent of shear wall openings.
With the increase in openings in the shear wall, lateral displacement increased to greater extent. By providing shear walls at the periphery the displacement considerably reduced.
D. M.S Ainawala & Dr P.S Pajgade (2014)
They did study on the influence of shear wall vicinity on the lateral displacement and Storey go with the flow of a multi- storey constructing by means of using E-tabs application. From there evaluation and results they concluded that among all of the models they have got considered, the following model(Fig.3) supplies minimum storey glide and minimal displacement. In the entire other items they viewed, the variant of column sizes affected the storey flow. Whilst in the above case, the column sizes does not show any result on storey glide. Providing shear wall in both x and y recommendations alongside the periphery is the exceptional appropriate model to cut down storey go with the flow.
E. Jamil Sardar & Umesh Karadi (2013)
They have done research on effect of change in location of shear wall on storey drift of a multi Storey building. They presented 25 storey's building in zone 5 using E-TABS software. Amongst all of the locations of shear wall, the below model (Fig.4) proved to be positive. This model confirmed much less inside storey float in comparison with different models. Shear wall at exterior corners of the plan has lesser displacements in comparison with shear wall at center. Inserting the shear wall far away from the center of gravity resulted in increase in most of the member forces.
Fig. 4
F. Anuj Chandiwala (2008)
By considering a building plan in L-section and by changing the position of shear wall at different locations they studied a detailed analysis of a building. By changing the position of shear wall at different corners and centre of the plan, they compared different properties of the building like base shear, lateral displacement etc. Among all the locations shear wall at the end of L- section (Fig. 5) gave better results compared to others. And the main reason for this model to give best results is that the end portion of the flange always oscillate more during earth quake so, by providing the shear wall at the flange section, the lateral forces can be reduced.
Fig. 5 G. Prof. Anubhavray & prof. Yogesh kumar (2008)
They have got finished seismic evaluation on a eight storey constructing via each similar static and Response spectrum methods. In identical static system handiest first main mode is regarded but in response spectrum system all of the modes of vibration are viewed, as a result the lateral masses values of RSM is more correct than identical static system. Making use of specific units of models it's discovered that farther the function of shear wall from axis of bending more potent wills it's.
III.METHODOLOGY
Methods available for earth quake analysis of a building
A. Equivalent static method
These earthquake masses are a result of the floor motions which can be additionally dynamic in nature. The importance of an earth quake strain depends on significance of the earthquake, distance from the earth quake supply.
In idea and exercising, the lateral pressure that a building research from an earthquake will increase in direct percentage with the acceleration of ground movement. As the floor quickens backward and forward at some point of an earthquake it imparts forces to the building via its basis that is forced to move with the ground. A very slight structure consisting of cloth tent can be undamaged in an earth quake but it's going to not live on excessive wind. The cause is low mass of the tent. That is the purpose why residential houses carry out properly in earth quakes and greater prone in high wind load inclined areas.
B. Dynamic analysis
Dynamic analysis should be performed to obtain the design seismic force and its distribution in different levels along the height of the building for both regular and irregular buildings. Regular buildings are those more than 40 m height and in zones IV and V and more than 90 m in zones II and III.
C. Time history method
The utilization of this approach will be on appropriate floor movement and will be finished the use of time-honoured ideas of dynamics. In this approach the mathematical version of the building is subjected to accelerations from earth quake statistics that constitute the predicted earth quake at the bottom of the structure.
D. Response spectrum method
Response spectra are curves plotted between maximum response of SDOF system subjected to precise earthquake ground motion and its time period (or frequency). Response spectrum may be interpreted because the locus of most reaction of a SDOF system for given damping ratio. Response spectra thus facilitates in acquiring the height structural responses underneath linear variety, which can be used for obtaining lateral forces advanced in shape due to earthquake thus helps in earthquake-resistant layout of structures. Usually reaction of a SDOF gadget is determined with the aid of time area or frequency area analysis, and for a given term of machine, maximum reaction is picked. This method is sustained for all range of feasible time durations of SDOF system. Final plot with gadget time period on x-axis and reaction amount on y-axis is the specified response spectra referring to exact damping ratio and enter floor motion. Same technique is executed with distinct damping ratios to obtain common response spectra.
IV.EXPERIMENTALSTUDY
A. Geometrical properties
1) Height of the building = 62 m 2) Number of stories = G+14 3) Wall thickness = 0.23 m 4) Height of the typical storey = 5 m 5) Slab thickness = 125mm 6) Grade of concrete = M35 7) Grade of steel = Fe415
8) Thickness of shear wall = 175mm and 150 mm
B. Loads
1) Live load = 1.5 KN/m2 2) Wall load = 12.14 KN/m2 3) Floor finishing = 1 KN/m2
C. Seismic loading
2) Importance factor (I) = 1 3) Seismic zone = III 4) Type of soil = medium
D. Zone factor
SZone factor = 0.36 from IS 1893 (Part-I)-2002. Response reduction factor (R) Reduction factor = 5.0 from IS 1893 (Part-1)-2002. Importance factor (1) = 1 from IS 1893-2002
[image:6.612.151.463.198.325.2]V. ANALYTICALSTUDY
Fig. 7 AUTOCAD PLAN
A. Cypecad Models
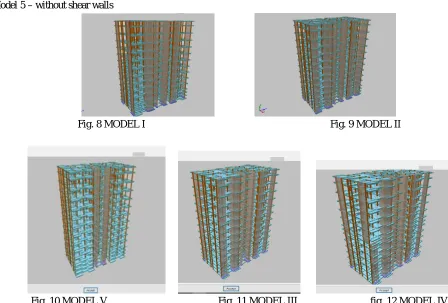
1) Model 1 – shear walls only in x-direction 2) Model 2 - with shear walls
3) Model 3 - shear walls only in y-direction
4) Model 4 - shifting location of shear wall (I.e. up to the VIIstorey in y- direction and in x- direction from VII to XIV Storey)
5) Model 5 – without shear walls
Fig. 8 MODEL I Fig. 9 MODEL II
[image:6.612.67.515.425.728.2]
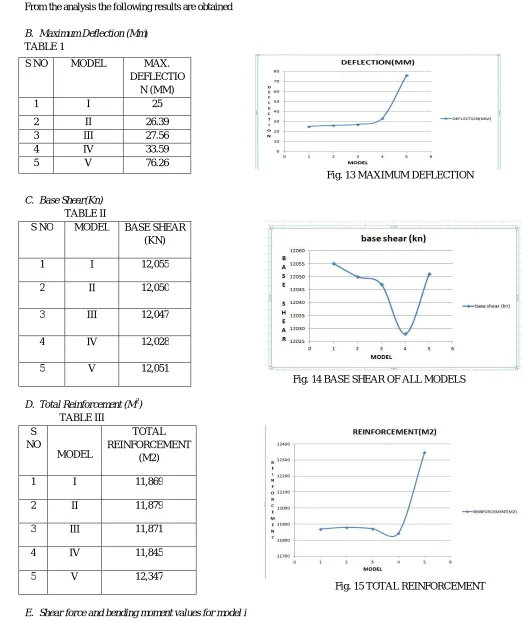
From the analysis the following results are obtained
B. Maximum Deflection (Mm) TABLE 1
Fig. 13 MAXIMUM DEFLECTION
C. Base Shear(Kn)
TABLE II
Fig. 14 BASE SHEAR OF ALL MODELS
[image:7.612.16.540.76.698.2]D. Total Reinforcement (M2) TABLE III
Fig. 15 TOTAL REINFORCEMENT
E. Shear force and bending moment values for model i
S NO MODEL MAX.
DEFLECTIO N (MM)
1 I 25
2 II 26.39
3 III 27.56
4 IV 33.59
5 V 76.26
S NO MODEL BASE SHEAR
(KN)
1 I 12,055
2 II 12,050
3 III 12,047
4 IV 12,028
5 V 12,051
S NO MODEL TOTAL REINFORCEMENT (M2)
1 I 11,869
2 II 11,879
3 III 11,871
4 IV 11,845
Table Iv , Shear Force, Bending Moment Values Of Model I
S no storey Beam Bending
moment(KN-m)
Shear force(KN)
1 G F Beam 27 36.73 70
2 Storey 1 to 4 Beam 27 37.31 63.69
3 Storey 5 Beam 27 39.92 54.59
4 Storey 6 Beam 27 40.7 51.83
5 Storey 7 Beam 27 41.69 49.47
6 Storey 8 Beam 27 42.47 47.48
7 Storey 9 Beam 27 43.14 45.91
8 Storey 10 Beam 27 43.82 44.62
9 Storey 11 Beam 27 44.44 43.57
10 Storey 12 Beam 27 44.96 42.72
11 Storey 13 Beam 27 45.49 42.03
[image:8.612.122.492.544.692.2]12 Storey 14 Beam 27 45.63 41.38
Fig. 16 shear force of model i fig.17 bending moment of model i
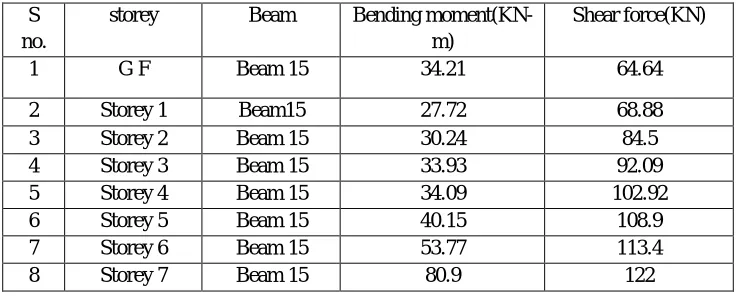
F. Comparison of model iii and iv:
The shear force and bending moment values of model III are given as:
TABLE V Shear force and bending moment values of model III S
no.
storey Beam Bending
moment(KN-m)
Shear force(KN)
1 G F Beam 15 34.21 64.64
2 Storey 1 Beam15 27.72 68.88
3 Storey 2 Beam 15 30.24 84.5
4 Storey 3 Beam 15 33.93 92.09
5 Storey 4 Beam 15 34.09 102.92
6 Storey 5 Beam 15 40.15 108.9
7 Storey 6 Beam 15 53.77 113.4
8 Storey 7 Beam 15 80.9 122
Fig.18 bending moment of model iii fig. 19 shear force of model iii
Then the location of shear wall is shifted in the model III from seventh storey to fourteen storeys to the x direction. And then the analysis is done. The results so obtained are as follows
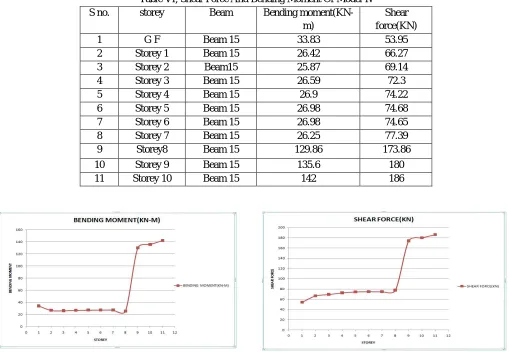
G. The shear force and bending moment values of model IV are given as:
Table VI, Shear Force And Bending Moment Of Model Iv
S no. storey Beam Bending
moment(KN-m)
Shear force(KN)
1 G F Beam 15 33.83 53.95
2 Storey 1 Beam 15 26.42 66.27
3 Storey 2 Beam15 25.87 69.14
4 Storey 3 Beam 15 26.59 72.3
5 Storey 4 Beam 15 26.9 74.22
6 Storey 5 Beam 15 26.98 74.68
7 Storey 6 Beam 15 26.98 74.65
8 Storey 7 Beam 15 26.25 77.39
9 Storey8 Beam 15 129.86 173.86
10 Storey 9 Beam 15 135.6 180
[image:9.612.53.553.73.286.2] [image:9.612.50.559.359.711.2]11 Storey 10 Beam 15 142 186
VI.CONCLUSIONS
A. Comparison of maximum deflection
The model which shows less deflection is proved to be economical. From the Fig.13 and table 1 the following conclusions are made. They are
1) Among all the models considering the deflection the shear walls placed only in x direction showed better results. 2) The deflection in the x direction shear wall model is 25 mm which is very least compared to other models. 3) The model V without shear walls showed the maximum deflection off all which is 76.26 mm.
4) The deflection minimum is showed by model I followed by model II, model III, model IV and V.
B. Comparison of Base shears
The model which shows least base shear will be considered to be economical. From the fig.14 and table II the following conclusions were made. They are
1) The test model in which the shear wall location is shifted from one direction to another direction showed the least base shear.ie 12,028 KN.
2) But among all the other models, the model in which all the shear walls are placed only in y direction showed the least Base shear i.e. 12,047 KN.
3) The ascending order of the base shears for the models are given as model IV, model III,model II, model V and model I. 4) The model with shear walls in x direction showed the maximum base shear which is noticeable.
C. Comparison of total reinforcement
In the civil engineering point of view, the structure which requires less reinforcement will be considered as economical. From the Fig.15 and table III the following conclusions are made. They are as follows:
1) In the reinforcement graph also the test model in which the location is shifted showed least reinforcement Requirement. i.e. 11,845 m2.
2) Among all the four models, the model in which shear walls placed only in x direction took least reinforcement i.e. 11,869 m2. 3) The model which is analyzed without placing any shear walls except the at the core took maximum Reinforcement i.e. 12,347
m2.
4) The descending order of the reinforcement can be given as model 5, model 2, model 3, and model 1and model 4.
Looking in to all the comparisons the model in x direction showed better results in deflection and reinforcement point of view where as in y direction the base shear is very less. From this thesis, placing of shear walls in x direction is proved to be economical in most of the cases.
D. Comparison of model III with model IV:
From fig 18, 19, 20, 21 the following conclusions can be made:
In the normal plan before the shear wall location is shifted, the shear force and bending moment showedthe same pattern that of the model I.
1) Whenever the location is shifted at that particular point the shearforce and bending moment values suddenly increased. 2) This happened due the change in position of shear wall at that particular position.
3) As the column failure also occurred at that position the structure is not perfect.
From the above analysis and results we can conclude that the change in location of shear wall in a single row or column i.e. discontinuation of shear wall location from foundation to the roof is not preferable.
As the column failure also occurred in the same position the structure has to be redesigned. So this model is not proved to be economical.
REFERENCES
[1] POOJA and AM PANDE “ Effect of shear walls on displacements” , International journal of research in engineering and applied sciences. [2] International journal of modern engineering research, volume 3, issue 3, may 2013.
[4] JAMIL SARDAR AND UMESH KARADI, Effect of change in shear wall location on storey drift” International journal of innovative research in science engineering and technology, volume 2, issue 9, 2013
[5] International journal in science, engineering and technology, volume 2, issue 1. [6] Earthquake resistant design by PANKAJ AGARWAL.
[7] SUMANTH CHOWDARY AND SENTHIL PANDYAN, “ A comparative study on RCC structure with and without shear wall” Volume 2, issue 2, 2014