Structural Model Design of Xanthone Compounds as
Antimalarial Activity
Dr.Amanatie1, Prof. Dr.. Jumina2, Prof. Dr Mustofa, M.Kes3, Prof. Dr M.Hanafi4, Dr. Ria Armunanto2
1
Department of Chemistry, Faculty Mathematics and Natural Sciences, Yogyakarta State University, Yogyakarta, Indonesia
2
Department of Chemistry, Faculty of Mathematics and Natural Sciences, GadjahMada University, Yogyakarta, Indonesia, Jumina
3
Prof. Dr. at Faculty Medicine of GadjahMada University, Yogyakarta, Indonesia
4
Prof. Dr. Sci at P3K, LIPI Serpong Tangerang, Indonesia
Abstract- Xanthones and their derivatives have been reported to exhibit inhibitory activities towards Plasmodium falciparum. In order to provide deep insight into the correlation between inhibitory activities and structures of xanthones, linear regression method was employed to establish QSAR models for 16 xanthones derivatives with different structure. The accuracy and predictive power of the proposed QSAR model were verified, optimized, and validated by semi empiric PM3 method. The result of this research showed that the best QSAR model was model 3.
Index Terms- Anti-plasmodialagents, Structural Models Design, xanthone.
I. INTRODUCTION
alaria is the main health problems in subtropical and tropical countries. There are 105 countries in the world in malaria endemic and more than 500 million cases or more than 2.7 million people deaths by malaria each year. In Indonesia, malaria is still become a health problem, particularly in eastern Indonesia. In the year 2003 the Annual ParactemiaIncidence (API) reported that there were 175 - 558 cases. Further, annual malaria incidents are more than 2.48 million and 211 deaths among 227.5 million is people of Indonesian.
The spread of malaria is so quickly and wide because of its parasites resistant, especially Plasmodium falciparum toward
chloroquine.Because of that, researchers want to find new
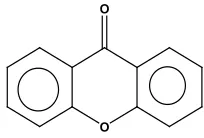
malarial drugs which more potential. Several approaches had been conducted to find new antimalarial drugs, for examples through modification of chemical structure of antimalarial compounds so that they have higher anti-plasmodium activity. Exploration of natural product as drugs traditionally has been applied for malaria treatment (Mustofa, 2000). For instance, derivatives of xanthone (Figure. 1) compounds have been known as potential antimalarial activity against Plasmodium falciparum. Based on description above and considering some factors as mentioned by previous researchers, therefore the writer conducted the QSAR analysis toward 16 compounds of xanthone derivatives (1-16) as shown at table (1). The 16 of xanthone derivatives series have been tested the anti-plasmodial activity by Likhitwitayawuidet al (1998).
The QSAR analysis in this research is different from that which has been conducted by Mustofa and Tahir (2001). Mustofa and Tahir (2001) used atomic net-charge as a descriptor with semi empiric AM1 method, this research used not only atomic
net-charge as descriptors but also dipole moment, Log P and polarizability with semi empiric PM3 method. Then, by performing QSAR analysis towards 16 xanthone derivatives, model equations were determined to predict and to get information about antimalarial activity of xanthone compounds. The use of the electronic structure of the molecule based on semi empirical calculation have also been reported. This can lead to useful model equations for the prediction of anti-malarial activity from the calculated atomic net charges (Mudasir, et al, 2003 and Tahir, et al, 2005). Furthermore, this approach has also been proven to be very helpful in obtaining an indication concerning the active center of molecules (Polman, et al, 1998).
II. METHODE
Model Set-up
The atomic electron net charges, dipole moment, Log P, polarizability have been evaluated by Mulliken population analysis based on standard semi empiricaly PM3 method using chemical software Hyper-Chem version 7,0. PM3 calculation is known to give quite satisfactory results for the chemistry of
xanthone compounds derivatives containing hydroxyl groups.
Geometries for stationary points were identified by medium of energy with respect to geometric parameters using Polak-Ribiere algorithm included in HyperChem package with convergence limit of 0.01 kcal mol-1A-1. Many possible linearrelationships between calculated atomic charges and anti-malarial activity were evaluated by using SPSS statistical software. The main objective is to obtain a model with a few variables descriptors as possible but still describing the anti-malarial activity satisfactorily.
Hanschequation of these relations are:
Log IC50 = A(LogP) –B (LogP)2 +C (E)+ D (ρσ ) + E +… (1)
III. RESULTANDDISCUSSION
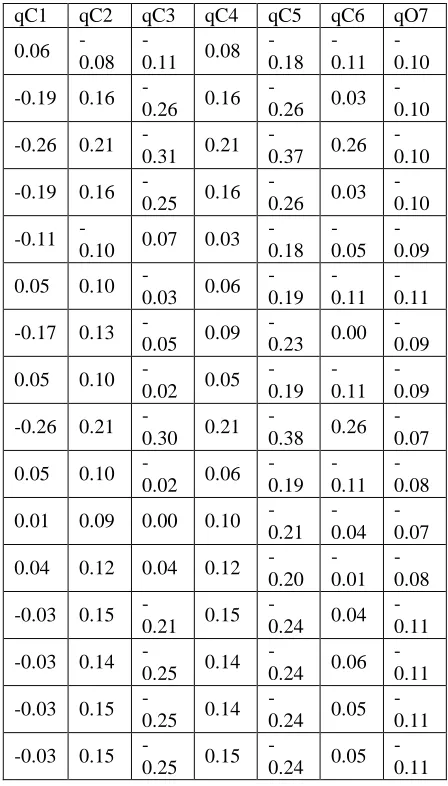
The calculated PM3 descriptors, such as atomic net charges, dipole moment, Log P and polarizability, of xanthone derivatives used in models are determined based on eq. 1 aqnd listed in table (2). This allows the exclusion of less relevant atoms and provides opportunity for a gradual evaluation of the atoms influencing significantly of the anti-malarial activity of molecules.
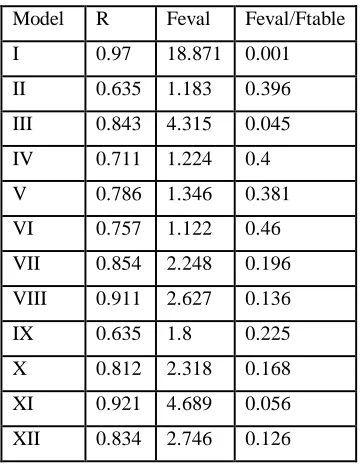
In order to obtain the best design model that correlates with independent variables (descriptors) and dependent variable (antimalarial activity), regression analysis using SPSS software package have been performed. Twelve independent variables consisting of 15 atomic net charges qC1, qC2, qC3, qC4, qC5, qC6, qC8, qC9, qC10, qC11, qC12, qC13, qC14, qC15 and qO7. As well as net charge of xanthone and dipole moment, Log P and polarizability were included in the model set- up. At the first step, all variables are included in the model and the less relevant variables were then eliminated gradual from the model. This procedure finally gave 12 QSAR models andValue R, F, F-hit/F-tab are as listed in F-hit/F-table (3). The statistical parameters obtained Standard Deviation (SD) model 1 and model 3 from linear according to Eq. (1). collected in table (4). From table 3 it is evaluated that some models can immediately be eliminated because their F elevated/F table value are lower than unity, which means that the models are statistically not exist or rejected. In Table 5, content Model 1, qC1,qC12,qC13, moment dipole,Log P, Log IC50eval and Log IC50exp.In Table. 6, content Model 3, qCO7,qC12,qC13, moment dipole, Log IC50eval and Log IC50 exp. In table. 7. Content,Log IC50eval and Log IC50exp Model 1 In table 8.content Log IC50eval and Log IC50exp Model 3 and in t able9.conten Value PRESS or Value Y
On the other hand, it is clearly shown that there are 2 selected models which show a relatively good correlation between anti-malarial activity of the best model among 12 models selected as listed in table 3 and 4 is not adequate only by comparing the R size, especially for model 1, and 3 because their R values are 0,970. and 0,843. Therefore we should also consider other statistical parameter of F (model significance) and SD (Standard Deviation), it seems that model 1 it the best model from the viewpoint of statistical parameters, Standard Deviation (SD) and F value (model significance). However, this model consisted of almost all descriptors avoilable and thus it is not the simplest model and therefore this model is excluded from selection.
Now, the remaining possible models are model 1 and 3. By comparing the parameters F and SD of two models, it is easily observed that model 3 is the best model because it has highest f and relatively lower SD and contains only 4 variables which means that the model is the quite sample, thus model 3 is selected as the best QSAR model. This model could therefore retionalize the search for new xanthonederivatives which have been antimalarial activity of these series xanthone derivatives, necessary due to the rapid resistance development of
Plasmodium falciparum.
Model Validation
It has been conducted that model 3 is the best model from the point of view of statistical parameters of the linear analysis. To see how good the model predict the activity of the xanthone series, calculation of the antimalarial activity for each
xanthoneanalogs has been performed using model 12 and results
(predicted Log (IC50 ) was plotted against those obtained by experiments (observed Log IC50) by regression method to see how well they correlate each other (Fig 2). It is obvious from this figure that model 3 predicts very well the activity of the series of xanthone as indicated by the values of the slope and correlation
coefficient (R) of the plot which is approaching unity, is 0.970 and 0.843, respectively.
Validation of the best model may be evaluated by comparing PRESS (predictive residual sum of square) value of the model 1 in table (5) and the model 3 in table (6). This parameter is defined as sum of square of difference between observed activity and predicted activity calculated by the corresponding model. The model with the smallest value of PRESS is the best model because it implies that the difference between the observed and the predict activities is minimal. Results of PRESS calculation for each model as listed in table (9) again confirms that model 3 is the most reliable model because in induces the smallest PRESS value.
Evaluation Model and Prediction of Most Influencing Atoms.
According to the fitting coefficient values obtained by the variation of descriptors included as summarized in table 3, we may concluded that atom C1, C12, C13 and q-ring seem to be the most responsible atoms for the anti-plasmodium inhibition activity of the molecules. Although some models listed in table (5 and 6) also include dipole moment and Carbon atoms of
xanthone, the values of their coefficient are relatively small
indicating that these atoms are of rather less importance and therefore can be eliminated from the model. By we immediately observed that C1, C12 and C13 assume prominent role in most as compared with the others, and that either O7, C12 and C13 has a significant influence, respectively.
IV. CONCLUSION
We have used a semi empirical molecular orbital calculation PM-3 to study the correlation between atomic net charge and the antimalarial activity of a series anti-plasmodium against wild type of the xanthone derivatives. The best overall correlation is given by the computed molecular properties of atomic net charges of xanthone derivatives and moment dipole, Log P, polarity. It is gratifying to observe that the most influencing atoms of the xanthone, in term of possible mode of docking of the molecule well to the targeted xanthone derivatives. It has also been demonstrated from this result that semi-empirical PM3, although induces possible error sources, still seem to be a necessary and acceptable compromise for quantum calculations on series of xanthone derivatives of this size, including the search for most influencing atoms.
[image:2.612.392.494.591.660.2]O O
Table 1. The 16 of xanthone derivatives series and the anti-plasmodial activity
No Compounds Log IC50
1 2 3 4 5 6 7 8 9 10 11 12 13 14 15 16
1 2 3 4 5 6 7 8 9 10 11 12 13 14 15 16
1.70 2.00 1.88 2.00 1.20 -.60 .70 -.40 .00 -1.00 2.00 -1.10 .40 .48 .18 .48
Fig 2. Compound 1 Fig 3. Compound
Fig 4 Compound 3 Fig 5 Compound 4
Fig 6 Compound 5 Fig 7. Compound 6
Fig 8.Compound 7 Fig 9.Compound 8
Fig10Compound 9 Fig11Compound 10
Fig12 Compound 11 Fig 13 Compound 12
Fig 16. Compound 15 Fig 17Compound 16
Table 2.Value atomic net charges, dipole moment, Log P and polarizability of xanthone derivatives
used in models
qC1 qC2 qC3 qC4 qC5 qC6 qO7
0.06 -0.08
-0.11 0.08 -0.18 -0.11 -0.10
-0.19 0.16
-0.26 0.16
-0.26 0.03 -0.10
-0.26 0.21
-0.31 0.21
-0.37 0.26 -0.10
-0.19 0.16
-0.25 0.16
-0.26 0.03 -0.10
-0.11
-0.10 0.07 0.03 -0.18 -0.05 -0.09
0.05 0.10
-0.03 0.06 -0.19 -0.11 -0.11
-0.17 0.13
-0.05 0.09
-0.23 0.00 -0.09
0.05 0.10
-0.02 0.05 -0.19 -0.11 -0.09
-0.26 0.21
-0.30 0.21
-0.38 0.26 -0.07
0.05 0.10
-0.02 0.06 -0.19 -0.11 -0.08
0.01 0.09 0.00 0.10 -0.21
-0.04
-0.07
0.04 0.12 0.04 0.12 -0.20
-0.01
-0.08
-0.03 0.15
-0.21 0.15
-0.24 0.04 -0.11
-0.03 0.14
-0.25 0.14
-0.24 0.06 -0.11
-0.03 0.15
-0.25 0.14
-0.24 0.05 -0.11
-0.03 0.15
-0.25 0.15
-0.24 0.05 -0.11
qC8 qC9 qC10 qC11 qC12 qC13 qC14 qO15
0.12
-0.22 0.39 -0.15 -0.04 -0.15 -0.01 -0.33
0.11
-0.22 0.40 -0.15 -0.04 -0.15 -0.01 -0.33
0.12
-0.22 0.43 -0.15 -0.04 -0.15 0.00 -0.38
0.15
-0.26 0.40 -0.20 0.16 -0.24 0.04 -0.34
0.09
-0.19 0.39 0.06 -0.14 -0.10 -0.05 -0.32
0.12
-0.22 0.40 -0.15 -0.04 -0.15 -0.01 -0.33
0.11
-0.22 0.40 0.02 0.06 -0.19 0.00 -0.33
0.12
-0.22 0.40 0.02 0.06 -0.20 0.00 -0.33
0.08
-0.18 0.43 0.06 0.03 0.02 -0.10 -0.38
0.08
-0.18 0.40 0.05 0.03 0.02 -0.10 -0.33
0.13
-0.25 0.40 -0.03 0.13 -0.22 0.03 -0.33
0.12
-0.21 0.39 0.03 0.13 -0.14 0.01 -0.32
0.18
-0.30 0.42 -0.24 0.20 -0.31 0.24 -0.03
0.18
-0.30 0.42 -0.24 0.20 -0.31 0.24 -0.03
0.18
-0.30 0.42 -0.24 0.20 -0.32 0.24 -0.03
0.16
-0.27 0.41 -0.21 0.16 -0.23 0.21 -0.03
[image:4.612.68.269.59.193.2] [image:4.612.55.279.256.649.2]Table 3. Value R, F, Feval/Ftable
Model R Feval Feval/Ftable
I 0.97 18.871 0.001
II 0.635 1.183 0.396
III 0.843 4.315 0.045
IV 0.711 1.224 0.4
V 0.786 1.346 0.381
VI 0.757 1.122 0.46
VII 0.854 2.248 0.196
VIII 0.911 2.627 0.136
IX 0.635 1.8 0.225
X 0.812 2.318 0.168
XI 0.921 4.689 0.056
XII 0.834 2.746 0.126
Table 4. Standard Deviation (SD) model 1 and model 3
No Model Standard Deviation (SD)
1 Model 1 SD= 24.490 2 Model 3 SD=0.12878
Table 5. Model 1
Table. 6 Model 3
No Com poun d
qO7 qC1
2 qC1 3 Mo m dipo l Log IC50eval Log IC50ex p
1 1
-0.10 -0.04
-0.15
1.54 3.07318 1.7
2 2
-0.10 -0.04
-0.15
3.24 1.98008 2.0
3 15 -0.11
0.20 -0.32
2.90 1.9078 0.18
4 16 - 0.16 - 3.68 0.80398 0.48
[image:5.612.78.258.78.310.2]0.11 0.23
Table. 7. Log IC50eval and Log IC50exp Model 1
No Log
IC50eval
Log IC50
exp
Δ Δ 2
[image:5.612.35.580.90.724.2]1 8.71508 0.40 8.31506 69.1402228036 2 8.55082 0.48 8.07082 65.1381354724 3 4.6459 0.15 4.4959 20.21311681 4 5.18288 0.48 5.04488 25.4508142144
Table 8. Log IC50eval and Log IC50exp Model 3
No Log
IC50eval
Log IC50
exp
Δ Δ 2
1 3.07318 1.7 1.37318 1.88562 2 1.98008 2.0 -0.01992 0.00039 3 1.9078 0.18 1.7278 2.98528 4 0.80398 0.48 0.32398 0.10496
Table9. Value Y
No. Model Value (Y)
1 Model 1 Y1 = 4.72408 2 Model 3 Y 3 = 0.965178
V. ACKNOWLEDGE
1. Research and Technology Ministry, KNRT-RI, Focus Field of Health and Medicine Techniques Jakarta, Indonesia.
2. Doctor Grant, Gadjah Mada University, Indonesia.
REFERENCES
[1] Hansch,C and Leo A. (1995), Exploring QSAR, Fundamentals and applications in Chemistry and BioLogy, ACS Professional Reference.Book, Americant. Chemical Society: Washington, DC, p19.
[2] Karelson, M and Lebanov, V.S., Quantum-Chemical Descriptors in QSAR/ QSPR studies. J. Chem.Rev. 96.1027-1043.
[3] Kimura, T., Miyashita,Y., Funatsu, K. And Sasaki S, (1996) Quantitative Structur Activity relationships of The Synthetic Substrates for Elastase Enzyme Using Nonlinear least square regression. J.Chem.Inf.Comput.Sci.36, 185-189.
[4] Likhitwitayawuid,K.Chanmahasathien,W.Ruangrungsi,N.Krungkrai,J., 1998, Planta medica, , vol 64, Issue 3 , 281-282.
[5] Likhitwitayawuid, K,Phadungcharosen,T,Krungkrai,J., 1998, Plata Medica, vol 64,Issue 1,70-72.
[6] Mudasir., Herawati, Ethica,SN, and Wijaya,K (2003a) QSAR analysis of antimalariaprimaquine and mefloquineanaLog based on quantum chemical parameters. The 39”IUPAC Congres and 86” Conference of Canadian Sosiety for Chemistry, Ottawa, Canada, August 10-15, 2003, p. 295 [7] Mudasir., Wijaya,K and Hadinugroho, D( 2003 b). QSAR analysis of
substituted 1,4 –benzoquinnone herbicides Using Atomic Net-Charge As Descriptors
[8] Mudasir, tahir,I and Astuti,IP (2003c), QSAR analysis of 1,2,4-Thiadiazoline fungides, based on molecular descriptor calculated Using AM-1 method. Ind.J.Chem, 3.39-47.
[9] Pranowo,HD, 2003 Computation of Chemistry, Department of Chemistry, Faculty of Mathematics and Natural Sciences, GadjahMada University, Yogyakarta, Indonesia N o Com pou nd qC 1 qC1 2 qC1 3 Mo m dip ol Log P Log IC50ev al Log IC50e xp
1 13 -0.3
0.20 -0.31
5.45 1.41 8.715 08
0.40
2 14 -0.3
0.20 -0.31
5.49 1.25 8.550 82
0.48
3 15 -0.3
0.20 -0.32
2.90 0.25 4.645 9
0.15
4 16 -0.3
0.16 -0.23
3.68 -0.19
5.182 88
[10] Mustofa 2000 In- vitro and in-vivo activity of the divers of natural and syntesicantimalarial:effect of potentialisator and the possibility of mechanism of actions. DisertasiUniversity of Montpellier I, France. [11] Tahir, I., Mudasir, Yulistia,I, and Mustofa (2005). Quantitative Structure
Activity Relationship Analysis (QSAR) of VincadifformineAnaLogous as the Antiplasmodial Compounds of the Chloroquine-sensible strain, Indon, J.Chem, 5, 255-260.
AUTHORS
First Author – Dr.Amanatie, Department of Chemistry, Faculty
Mathematics and Natural Sciences, Yogyakarta State University, Yogyakarta, Indonesia, [email protected], Phone:
08179444737 Telp. (0274)896605
Second Author – Prof. Dr.. Jumina, Department of Chemistry,
Faculty of Mathematics and Natural Sciences, GadjahMada University, Yogyakarta, Indonesia, Jumina @ugm.ac.id
Third Author – Prof. Dr Mustofa, M.Kes, Prof. Dr. at Faculty
Medicine of GadjahMada University, Yogyakarta, Indonesia, mustofa [email protected]
Fourth Author – Prof. Dr M.Hanafi, Prof. Dr. Sci at P3K, LIPI
Serpong Tangerang, Indonesia, hanafi [email protected]
Fifth Author – Dr. Ria Armunanto, Department of Chemistry,