DOI:10.21276/ijprhs.2019.03.09
Ashok kumar Pet al. CODEN (USA)-IJPRUR, e-ISSN: 2348-6465
Original Article
Development Characterization and Evaluation of
Nasal
in situ
Gel containing Anti-Asthmatic Drug
Sri Chaya M V, Ashok Kumar P
*, K Manjunath, Suresh V Kulkarni
Department of Pharmaceutics, Sree Siddaganga College of pharmacy, B H Road, Tumkur, Karnataka, India.
A R T I C L E I N F O A B S T R A C T
______
1. INTRODUCTION
Nasal gels are high-viscosity thickened solutions or suspensions. The advantages of a nasal gel include the reduction of post-nasal drip due to high viscosity, reduction of taste effect due to reduced swallowing, reduction of anterior leakage of the formulation, modification of irritation by using soothing/emollient excipients and target to mucosa for better absorption. In-Situ gelation is a process of gel formation at the site of action after the formulation has been applied at the site. In-Situ gel phenomenon based upon liquid solution of drug formulation and converted into the semi-solid mucoadhesive key depot. It permits the drug must be delivered in a liquid form or solution form.
International Journal of Pharma Research and Health Sciences
Available online at
www.pharmahealthsciences.net
Received: 11 Jun 2019 Accepted: 29 Jun 2019
Objective: The purpose of the present study is to develop, characterize and evaluate nasal in situ gel containing anti-asthmatic drug of Cromolyn Sodium
Method:Ion activated method was used for the preparation ofin situgel, and gellan gum is used as ion triggered polymer. In-situgels Cromolyn Sodium with Gellan Gum as a gelling agent, PVP K30, HPMC K 100 M and Lutrol F127 as polymer. The formulations were evaluated for gel formation, pH, viscosity, in vitrorelease, drug content, and mucoadhesive force.
Results and Discussion: pH of all the formulations were found to be in the range of 6.0 -6.55 and the drug content for all the prepared formulations were found to be in the field of 80 - 92%.The results ofin vitrodrug release indicated that the optimized formulation F6 is the utmost successful formulation of the study, revealed a sustained drug release of 92% in 24 hours.
Conclusion: It can be settled that Cromolyn Sodium nasal in situgel produces prolonged and site-specific drug delivery for the treatment of Asthma.
Keywords: Ion activated method, Cromolyn Sodium, Gellan Gum, Lutrol F-127, HPMC K100 M, and PVP K 30.
The corresponding author * Dr. P. Ashok Kumar,
Associate Professor, Sree Siddaganga College of Pharmacy, B H Road, Tumkur, Karnataka, India
In situ gel formation of drug delivery systems can be defined as a liquid Formulation generating a solid or semisolid depot after administration. In situ activated gel-forming Systems are those which are when exposed to physiological conditions will shift to a gel phase. Gelation occurs via the cross-linking of polymer chains that can be achieved by covalent bond formation (chemical cross-linking) or Non-covalent bond formation (physical cross-linking). The impact of external stimuli such as temperature, pH, and ionic strength, on the cross-linking of polymer chains have been studied to improve the gel strength or to induce in situ gelations. Both natural and synthetic polymers can be used for the production of in situ gels
Principle of In-Situ Gel: In situ gel-forming drug delivery
systems is the principle, capable of releasing the drug in a Sustained manner maintaining relatively constant plasma profiles. Formulation of in-situ gel systems involves the use of a gelling agent which can form a stable sol/suspension system to contain the dispersed drug and other excipients. The gelling of this sol/suspension is to be achieved in the gastric environment, triggered by ionic complexation due to change in pH.1
Importance of In-Situ Gelling System:
A low dose is required for treatment Minimum local and systemic side effects Ease of application
Reduced frequency of drug administration Improved patient compliance and comfort Increased residence time
Improved bioavailability2
Cromolyn Sodium acts by inhibiting the release of chemical mediators from sensitized mast cells. It is used in the prophylactic treatment of both allergic and exercise-induced asthma but does not affect an established asthmatic attack. The aim of the present study is to develop, characterize and evaluate of nasal in situ gel containing anti-asthmatic drug of Cromolyn Sodium
2. MATERIALS AND METHODS
Materials: Cromolyn Sodium from Swapnaroop Drugs
&Pharmaceuticals, Mumbai. Lutrol F-127, HPMC K100M and PVP K 30 was from Hi-Media Laboratories Pvt. Ltd. Gellan Gum, Mannitol and Benzalkonium chloride was from SD Fine Chem Laboratories Pvt.
Methodology
Standard Curve of Cromolyn Sodium with Nasal Simulated Fluid
Cromolyn Sodium is a white powder which is soluble in water. Though several methods are reported for its estimation, the UV spectrophotometric method was employed in the study.
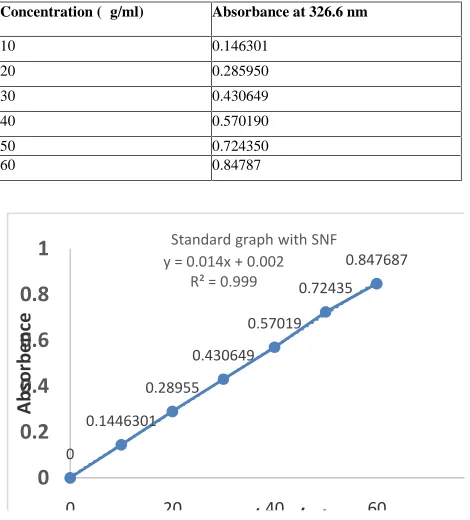
Cromolyn Sodium shows maximum absorbance at 326.6nm in simulated nasal fluid pH of 4.5. Based on this information, a standard graph was constructed (Figure No.1).
Standard Curve of Cromolyn Sodium with Phosphate buffer
Cromolyn Sodium shows maximum absorbance at 327nm in Phosphate buffer pH of 7.4. Based on this information, a standard graph was constructed (Figure No.2).
FTIR STUDIES
Infrared spectra of all the ingredients used in the formulation are taken individually. Also, the infrared spectrum of the physical mixture (in situ gel) is made. The application of infrared spectroscopy lies more in the qualitative identification of substances either in pure form or in the combinations and as a tool in the establishment of the structure. Since IR is related to covalent bonds, the spectra can provide detailed information about the structure of molecular compounds. In order to establish this point, comparisons are made between the range of the substance and the pure compound. The above discussions imply that infrared data is helpful to confirm the identity of the drug and to detect the interaction of the drug with the excipients. The samples are scanned between wavenumber ranges of 4,000 to 500 cm-1.
Preparation of nasal in-situ gel Formulations by Ion Induced method
Gellan gum (0.3%) solutions were prepared by adding the gum to deionized water and heating up to 700C while stirring. After cooling to below 400C, HPMC K 4 M, Cromolyn Sodium (1%,w/v), mannitol (4%, w/v), and Benzalkonium chloride (0.01%, w/v) are added and mixed well.3
Evaluation of in situ gelling solution Determination of pH
The pH of gels is checked by using a digital pH meter at room temperature. Initially, the pH meter is calibrated using standard buffers of pH 4 and 7.0. 1ml of the gelling solution is taken vial (container), and then the made up to 10 ml with distilled water, the electrode of pH meter was dipped in the dispersion, and the pH is noted.
Viscosity Measurement of the nasal In Situ Gelling Solution
The viscosity was measured at 30±2°C using Brookfield viscometer (model name, RV DV2T) and spindle number T5 at 5-25 rpm. First, 50 ml of the in-situ gel was taken in 50 ml beaker, and the viscosity of the gel solution was measured. The reading obtained was noted.
Evaluation of Cromolyn Sodium nasal in situ gels Clarity
The clarity of various formulations was determined by visual inspection under the black and white background, and it was graded as follows: turbid, +; clear, ++; and very clear (glassy), +++.
pH of Formulation
Determination of Drug Content
Uniform distribution of active ingredient is essential to achieve dose uniformity. The drug content is determined by taking 1 ml of the formulation to 100 ml volumetric flask. Then makeup with simulated nasal fluid up to the mark and shaken vigorously. From the above solution, 10 ml is withdrawn and further diluted to 100 ml with simulated nasal fluid. The absorbance of the above solution is measured at 326.6nm by using UV-Vis spectrophotometer.5
Determination of Mucoadhesive Force
The mucoadhesive strength of each formulation was determined by measuring the force required to detach the formulation from goat nasal mucosal tissue by using a modified chemical balance. A section of the nasal mucosa was cut from the goat's nasal cavity, and the mucosal side was instantly fixed into each glass vial using a rubber band. The vials with nasal mucosa were stored at 37°C for 5 minutes. Then next vial with a section of mucosa was connected to the balance in an inverted position while the first vial was placed on a height-adjustable pan. A fixed amount of sample of each formulation was placed onto the nasal mucosa of the first vial. Then the height of the second vial was adjusted so that mucosal surfaces of both vials come in intimate contact. Two minutes contact time was given to ensure close contact between tissues and the sample. Then weight was increased in the pan until vials got detached. The bioadhesive force, expressed as the detachment stress in dyne/cm2, was determined from the minimal weights that separated the tissues from the surface for each formulation using the following equation.
Detachment stress (dyne/cm2) = m x g /A
Where, m =Weight required for detachment of two vials in gm
g = Acceleration due to gravity [980cm/s2] A = Area of tissue exposed
The nasal mucosa was changed for each measurement.5
In vitro drug diffusion Studies
In-vitro drug release study of in situ gel formulation is carried out by Franz diffusion cell of 22ml capacity. The formulation is 2 ml placed in the donor compartment and 22ml of freshly prepared simulated nasal fluid of pH 4.5 is placed in the receptor compartment. Between receptor and donor compartment, dialysis membrane previously soaked overnight in the diffusion medium is placed. The whole assembly is placed on a thermostatically controlled magnetic stirrer. The temperature of the medium at 37±0.5ºC.2ml sample is withdrawn at a predetermined time interval of 1 hour for 24hrs. The sample volume of fresh medium is placed. The withdrawn samples are suitably diluted and by UV spectrophotometer at326.60nm using the simulated nasal fluid as blank.5
Table 1: Formulation of Cromolyn Sodium nasal in situ gel (F1-F9)
3. RESULTS AND DISCUSSION
Calibration curve of Cromolyn Sodium in simulated nasal fluid
The absorbance of standard solutions of Cromolyn Sodium at 326.6 nm to plot calibration curve in the simulated nasal fluid.
Table 2: Data for the standard graph of Cromolyn Sodium at 326.6 nm in Nasal Simulated Fluid
Concentration (μg/ml) Absorbance at 326.6 nm
10 0.146301 20 0.285950 30 0.430649 40 0.570190 50 0.724350 60 0.84787 0 0.1446301 0.28955 0.430649 0.57019 0.72435 0.847687
y = 0.014x + 0.002 R² = 0.999
0
0.2
0.4
0.6
0.8
1
0 20 40 60 80
A bs or be nc e con (mcg/mL Standard graph with SNF
Fig 1: Standard graph of Cromolyn Sodium at 326.6 nm in simulated nasal fluid
INGREDIENT S
F1 F2 F3 F4 F5 F6 F7 F8 F9
Cromolyn Sodium(mg)
100 100 100 100 100 100 100 100 100
Gellan Gum(mg)
30 30 30 30 30 30 30 30 30
HPMC K 100 M(mg)
2 5 10 - - -
-PVP K30(MG) - - - 2 5 10 - -
-Lutrol F 127(mg)
- - - 2 5 10
Mannitol(mg) 400 400 400 400 400 400 400 400 400
Benzalkonium chloride(ml) 0.002 ml 0.002 ml 0.002ml 0.002 ml 0.002 ml 0.002ml 0.002 ml 0.002 ml 0.002ml Distilled water q.s to
Calibration curve of Cromolyn Sodium in Phosphate buffer:
The absorbance of standard solutions of Cromolyn Sodium at 327 nm to plot calibration curve in Phosphate buffer.
Fig: 2: Standard graph of Cromolyn Sodium at 327 nm in Phosphate buffer
Table 3: Data for the standard figure of Cromolyn Sodium at 327 nm in Phosphate buffer
FTIR STUDIES
FT-IR spectra of pure Cromolyn Sodium, and combination with HPMC K100 M, PVP K30 were shown in the (Figure No.3-5). Pure Cromolyn Sodium showed principal absorption peaks at 3414.12 cm-1 (-OH stretching), 2929.97cm-1 (-CH Ali stretching), 1629.90 cm-1 (>C=O stretching), 1477.00 cm-1(-CH2bending), and 1265.35 cm
-1
(-CH3bending). Same peaks of C=O, -OH, C-H,–CH2and–
CH3 bonds were present as that of the pure drug without
much shifting in the spectra of Cromolyn Sodium along with the polymers. This suggested no chemical interaction between the drug and polymers. (Fig 3-5)
Fig 3: FT-IR Spectrum of pure drug Cromolyn Sodium
Fig 4: FT-IR Spectrum of pure drug Cromolyn Sodium + HPMC K100 M
Fig 5: FT-IR Spectrum of pure drug Cromolyn Sodium + PVP K 30 DSC Studies
In order to find out drug and out excipients compatibility DSC studies were also accomplished. Pure Cromolyn Sodium exposed sharp endothermic peak at 272.61ºC. The DSC studies curve of Drug and PVP K30 mixture demonstrated an endothermic peak at 253.76ºC. But in the formulation, there was a slight change in peak temperature, which might be due to the mixing of the drug and excipients, which could have reduced the purity level of each component. But DSC results did not show any major interaction.
Fig 6: DSC curve of pure drug Cromolyn Sodium
Fig 7: DSC curve of drug and PVP K30
Evaluation of Cromolyn Sodium nasal in situ gelling solution:
Table 4: Evaluation report of the gelling solution (F-1 to F-9). Concentration (mcg/ml) Absorbance at 327nm
10 0.142883
20 0.302628
30 0.442078
40 0.597931
50 0.750717
60 0.910004
PARAMETERS FORMULATION CODE
F1 F2 F3 F4 F5 F6 F7 F8 F9
Colour Colour Less
Colour Less
Colour Less
Colour Less
Colour Less
Colour Less
Colour Less
Colour Less
Colour Less
pH 6.23 6.48 6.0 6.52 6.55 6.33 6.33 6.42 6.0
The pH of the in situ gelling sol was found to be 6.0 to 6.55, and it was found to be acidic in nature. Viscosity was found to be in the range of 5to 25 cps.
Drug Content and Mucoadhesion:
Drug content was estimated for all the batches, and it was found to be in the range of 80–92%. The results are shown in Table 5. It shows that as the concentration of HPMC K100M, PVP K30, and Lutrol F 127increases, the bioadhesive strength also rises. The mechanism of bioadhesion can be attributed to hydrogen bonding between gel formulation and oligosaccharide chains of the mucosal membrane. The mucoadhesive force of prepared formulation is in the range of 1248.4 dyn/cm2to 2496.8dyn/cm2.
Table 5: Evaluation report of in situ gel (F-1 to F-9) PARAMETE
R
F1 F2 F3 F4 F5 F6 F7 F8 F9
Clarity +++ +++ +++ +++ +++ +++ +++ +++ +++ pH 6.23 6.48 6.0 6.52 6.55 6.33 6.33 6.42 6.0 Drug content
(%)
85 89 82 84 84 92 80 82 81
Mucoadhesiv e force in dyn/cm2 1404.4 5 1560. 5 1872. 6 1248. 4 1248. 4 2496. 8 1778.9 0 2184.7 1 1560. 5
In Vitro Release Study:
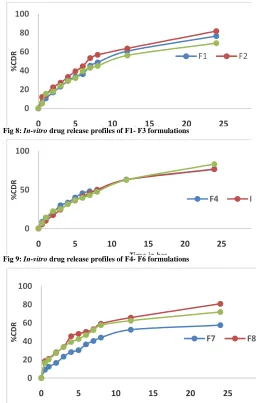
In vitro release studies were carried out for all the formulations using Franz diffusion cell with dialysis membrane engaging magnetic stirrer at 50rpm. It was conducted in SNF. The results were evaluated for 24 hours. The in situ gels of different formulations were evaluated for pH, viscosity, drug content, and in vitro release. The results of all the formulations for different tests found to be within limits. Upright uniformity in drug content was found among different batches of in situ gel. The release studies were carried out for all the formulations. The formulations were prepared by increasing the concentration of the mucoadhesive polymer. The formulation which shows the percentage of drug release maximum at 24 hrs was considered as optimum. The percentage drug release of all prepared formulation is in the range of 57.44to 83.12, were presented in (Table 6) and (Fig 8-10).
Table 6: Percentage Drug Release of Formulations F-1 to F-9 Time
(hrs)
FORMULATIONS
F1 F2 F3 F4 F5 F6 F7 F8 F9
0 0 0 0 0 0 0 0 0 0
0.5 5.636 12.07 5.12 8.51 5.33 7.06 8.99 18.45 16.31 1 10.49 14.26 15.46 12.98 9.93 14.26 12.26 20.79 20.06 2 16.98 22.43 17.79 20.71 17.26 22.46 16.39 27.96 27.03 3 23.00 27.13 24.00 29.94 24.25 25.34 23.23 33.76 33.72 4 29.17 33.33 29.13 33.43 31.45 31.49 28.16 45.45 39.12 5 33.70 39.42 32.16 40.04 36.19 36.81 30.28 48.07 42.43 6 36.28 44.63 39.00 45.46 41.23 39.52 36.59 50.25 46.72 7 45.24 53.35 43.00 48.15 45.71 42.94 40.34 53.03 52.21 8 48.69 56.69 44.95 48.99 50.05 47.41 43.94 59.09 57.45 12 60.59 63.51 56.06 63.17 62.89 62.63 52.52 65.64 62.35 24 76.59 81.85 69.07 76.60 76.50 83.12 57.44 80.73 71.77
0 20 40 60 80 100
0 5 10 15 20 25 30
%C
D
R
Time in hrs
F1 F2
Fig 8: In-vitro drug release profiles of F1- F3 formulations
0 50 100
0 5 10 15 20 25 30
%
CDR
Time in hrs
F4 F5
Fig 9: In-vitro drug release profiles of F4- F6 formulations
0 20 40 60 80 100
0 5 10 15 20 25 30
%
CDR
Time in hrs
F7 F8
Fig 10: In-vitro drug release profiles of F7- F9 formulations
4. CONCLUSION
intranasal bioavailability. The ease of administration, coupled with its ability to provide sustained release, could probably result in less frequent administration, thus enhancing patient compliance.
5. REFERENCES
1. Saudagar RB, SarikaVK.In-Situ Nasal Gel- A Review. Asi J Res Pharm Sci 2017; 1:23-32.
2. Soniya RD, Asish D, Rathod S, Ganesh D.An overview of in situ gelling systems. Pharm Bio Eva 2016;3: 60-9. 3. Parmar V, Lumbhani AN. Development and evaluation
of ion-dependent in situ nasal gelling systems of metoclopramide hydrochloride as an antimigraine model drug. Int J Latest Res Sci-Tech 2012; 1:80-9.
4. Anuradha N, Prabhakar D, Ashok U, and Shravan KK. Formulation and evaluation of in-situ mucoadhesive nasal gel of montelukast sodium. Der Pharmacia Sinica2014: 5:1-8.
5. Mothukuri Tejaswini and Seetha Devi A. Formulation and Evaluation of Nasal In Situ Gel of Phenylephrine Hydrochloride. Int J Drug Res Tech 2016; 6: 64-78.