HUMAN ACTIVITY RECOGNITION USING SYMBOLIC SEQUENCES
María Mejía
1, Anh Tran
2and Paul Cohen
3 1Departamento de Sistemas e Informática at Universidad de Caldas and Departamento de Informática y Computación at Universidad Nacional de Colombia, Colombia
2
Google, United States of America 3
SISTA School of Information Technology and Arts, University of Arizona, United States of America E-Mail: [email protected]
ABSTRACT
Human activity recognition research is an active area in an early stage of development. We present two approaches to activity recognition based on symbolic representations of multivariate time series of joint locations in articulated skeletons.One approach uses pairwise alignment and nearest-neighbour classification, and the other uses spectrum kernels and SVMs as classifiers. We tested both approaches on three datasets derived from RGBD cameras (e.g., Microsoft Kinect) as well as ordinary video, and compared our results with those of other researchers.
Keywords: artificial intelligence, computer vision, machine learning, pose, gesture, activity recognition.
1.INTRODUCTION
Human activity recognition has been studied for approximately 25 years and has become an important challenge for computer vision. The applications of activity recognition include video surveillance, robotics, video indexing and querying, content based video analysis, behavioral biometrics (e.g., recognizing people by the way they walk), biomechanics, medicine, monitoring (e.g., patients, elderly people, babies or kids), dancing and sports analysis, video entertainment, and video games, among others.
Activity recognition is challenging because of variations in motion, illumination, partial occlusion of humans, viewpoint, anthropometry of people involved in the actions, and variable execution rates of behaviors [1], [6], [12], [29], [31]. Methods that rely on the identification of human body parts, present additional challenges such as detecting and tracking people in videos.
In this paper, we present two approaches to activity recognition based on sequences of measurements obtained from articulated skeletons. The input to our methods are articulated skeletons obtained from RGBD sensors (e.g., Microsoft Kinect) and by detecting the
skeletons in 2D from video using Yang and Ramanan’s
pose-estimation technology [42].
One approach represents the moving skeleton as a multivariate symbolic sequence, derived from series of real-valued joint locations with the help of the SAX algorithm [19], [20]. Sequence alignment is used to assess the similarity of these sequences and k-Nearest Neighbour is used as a classifier.
The other approach begins with symbolic sequences but represents the sequence for each joint with a different symbolic alphabet, ensuring that sequences for all the joints can be concatenated into a single, long sequence without losing localized information. Once this is done, a spectrum kernel is built and an SVM is used to find support vectors. Finally a multiclass classifier is built usingthe one-vs-all (OVA) approach.
We discuss the details of these approaches in Section 3 and present related work in Section 2. Our
datasets are described in Section 4. Sections 5, 6, and 7 describe the procedure, results, and discussion of our experiments, respectively. Section 8 concludes our work.
2. RELATED WORK
RGBD technology (e.g., Microsoft’s Kinect) and
Shotton et al.’s algorithm [32] offer new possibilities for
research in activityrecognition, where the focus is on the recognition task itself rather than on low-level vision. Nevertheless, activity recognitionresearch predates these new technologies and is worth reviewing. The following two sections review conventional vision-based research and more recent methods based on RGBD technology, respectively.
2.1 Conventional computer vision approaches to activity recognition
Informative surveys of activity recognition research include[1], [2], [3], [5], [10], [35], [36] [37].
Pose dictionaries or codebooks are a recent trend. For example, Zheng et al. [43] present a novel approach
Junejo and Aghbari [14] present a method like ours in its reliance on the SAX algorithm, which transforms real-valued seriesinto sequences of symbols [21], but different in how it uses the sequences. In their method, symbols indicate features of trajectories of joints such as velocity, acceleration, and spatiotemporal curvature. Sequences are compared with the SAX distance metric, which amounts to looking up the distances between corresponding pairs of SAX symbols in a table, summing the squared distances and multiplying by the compression rate [19]. In contrast, we compare sequences with sequence alignment in one approach and with a kernel method in another.
Campbell and Bobick [6], pioneers in recognizing continuous actions, trained and tested their methods on 3D data provided by a commercial motion capture system. For modeling, they used a set of anatomical constraints based on Euler angles represented in a phase-space that related the variables of the body motion. In phase-space, actions correspond to sets of points. Sheikh et al. [31] describe the
2D motion of actions as sets of 13 joint trajectories. Unlike most researchers, who use sequential orderingin place of an explicitly defined temporal dimension, Sheikhet al.
represent action in a 4-D XYZT space. They use a specialcase of a_ne projection - a weak-perspective projection- to obtain normalized XYT trajectories to measure the view invariant similarities between two sets of trajectories. Similarity is measured as the angle between corresponding subspaces that the trajectories project into.
Gavrila and Davis [11] used a 3D articulated model of a human with 17 Degrees of Freedom (DOF) for upper-body motion for pose recovery and tracking of images. To deal with view invariance, they minimized a chamfer distance between the 3Dmodel and four different views. They obtained the data for recognition using a Moving Light Displays (MLD) framework; where23 markers indicated the locations of the eyes, mouth, hips and shoulders, arms and legs. For recognition they used dynamic time warping [4]. Yacoob and Black [40] model activities in terms ofthe optical flow of body parts (torso, thigh, calf, foot, and arm).Eight parameters of flow (obtained by the methods of Juet al[13]) yield signals for
each action. Signals are transformed to make the method invariant to anthropometric measures and execution rate. These transformations can be represented by coefficients and bases of Principal Component Analysis (PCA). These parameters serve as features in the recognition process, which returns the target activity whose parameters are closest to those ofthe source activity.
2.2 Action recognition based on RGBD technology
Li et al. [17] present a bag-of-3D-points method
for action recognition using RGBD depth maps. Their work is based on anaction graph [18] to model the dynamics of human motion where the nodes, or salient postures, are characterized by bags of 3Dpoints. They sampled each of the three Cartesian planes (XY,XZ, and YZ) and clustered all the data. The clusters correspond to the salient postures of the action graph.
Wang et al. [38] describe a feature based on the
Fourier Temporal Pyramid for representing the motion of
a joint in an action.They also characterize the relationship between human subject and environmental objects using the Local Occupancy Patterns (or LOP) at each joint. Their LOP features are computed using occupancy information based on 3D point clouds surrounding each joint. Additionally, they develop a data mining method for
learning discriminative subsets of joint “actionlets” (joint
postures distinctive to a given action) using a multiple kernel learning approach [7].
Ellis et al. [9] present an algorithm for reducing
latency when recognizing actions, particularly important in interactive entertainment. They used logistic regression to find in real time body pose representations related to actions. The 3D skeletal joints obtained from a Microsoft Kinect sensor were used as features. Sung et al. [33] used a Kinect device as the sensor input; however, they extracted the skeleton joints using the PrimeSense tracking system. These skeleton joints, along with HOG features extracted from the depth maps, are given to a hierarchical maximum entropy Markov model (MEMM) to uncover the different characteristics of human activities. Xia et al. [39] presented a view-invariant representation based on spherical coordinates of histograms of 3D joint locations (HOJ3D). The 3D skeletal joints data is taken from a Microsoft Kinect device, and extracted by the Shotton et al. algorithm [32]. They applied linear discriminant analysis for extraction of meaningful features and found
clusters for mapping the frame’s actions into single cluster
(visual word). They did the classification using a discrete HMM technique. Yang et al. [41] present an action-recognition approach based on Eigen-joints. They obtained three features at each frame corresponding to pairwise joint differences. These features are:motion, calculated between consecutive frames; posture at the actual frame; and offset between the actual frame and the first frame. Given noisiness and high dimensionality of the data, they used PCA for obtaining the Eigen-joints. A Naïve-Bayes-Nearest-Neighbour classifier was used for classification.
Bloom et al. [4] proposed an online action
recognition method for fast detection of compound actions using hierarchical body model that can be configured to detect actions based on the low level body parts that according to them those are the most discriminative for a particular action.
3. TWO APPROACHES FOR ACTION
RECOGNITION BASED ON SYMBOLIC
SEQUENCES
The inputs to our algorithms are multivariate time series of skeletal joints. It is important to us that activity recognition should not depend too strongly on the input device, so our algorithms were developed to work with 2D skeleton data from conventional computer vision methods - for which we used the poseestimation technology developed by Yang and Ramanan [42] in combination with the skeleton tracking software of Pirsiavash and Ramanan [28] (Figure-1) - as well as 3D skeleton data from the Microsoft Kinect sensor and Shotton et al.’s
3.1 Symbolic Sequences and Pairwise Alignment (SSPA)
3.1.1 Description
Representations for any recognition task must be designed with an eye to classification or matching. One approach, which we call Symbolic Sequences and Pairwise Alignment (SSPA) transforms multivariate series into discrete symbolic sequences, and relies on sequence alignment to match novel sequences to stored instances. (An alternative is to not transform the real-valued series and use Dynamic Time Warping (DTW) to find matches between novel and stored instances, as in [11]. Surprisingly, given the loss of information entailed by transforming real numbers into symbols, sequence alignment on symbolic sequences outperformed DTW on real-valued series in every experiment we performed.)
The transformation of real values into symbols is done by the SAX algorithm [19], [20]. First, a series is transformed into its Piecewise Aggregation Approximation (PAA), which approximates the series as a
sequence of “steps,” each at a discrete level.Then each
unique level is assigned a symbol from an alphabet and the original series is rewritten as a sequence of these symbols. SAX involves two parameters: the size of the window for doing the PAA and the length of the alphabet. Larger window sizes generally produce more compressed but less faithful representations of the original series.
Distances or similarities between symbolic sequences can be assessed with sequence-alignment techniques like those used in bioinformatics. We use one of the simplest: the Needleman-Wunch algorithm [27]. A measure of similarity is the cost of aligning two sequences (roughly the amount that one sequence must be modified to make it match another).
We represent activities as multivariate symbolic sequences, where each variable represents a joint (left elbow, right knee, head, etc.) The similarity between two activities is the sum over the similarities of the symbolic sequences for each joint, where the similarity between symbolic sequences for a single joint is a sequence alignment score normalized to the unit interval.
Given this method of assessing the similarities of activities, we can lay out training data in a metric space, after which novel activities can be classified with a Nearest Neighbor classifier.
3.1.2 Computational cost
The complexity of this approach is roughly quadratic in space and time on the length of the symbolic sequence. The cost is dominated by sequence alignment. The approach could be madelinear by using a parallel version of the Needleman-Wunch algorithm like the one proposed by Naveed et al. [26]. We can breakdown the
component costs as follows:
Figure-1. 2D skeleton poses are tracked over time to produce skeleton tracks. The blue skeleton identifies the man while the yellow skeleton identifies the
womanin the video.
Figure-2. Superimposed skeleton on depth map recorded by Kinect.
Preprocessing: uses linear interpolation and a Loess smoother. Both run in time proportional to the length of the series.
Representation: The SAX transformation runs in time proportional to the length of the series.
Building model: The Needleman-Wunch algorithm is quadratic in space and time on the length of the symbolic sequence.
Testing: Nearest Neighbor takes O(N) time where N is the number of points or features in the space, that is, on the size of the training and testing dataset.
3.2 Symbolic Sequences and Spectrum Kernel (SSSK)
3.2.1 Description
joints. An alternative is to concatenate symbolic sequences for the joints into one long sequence. We take care to use a different alphabet for each sequence. This ensures that joints can be identified uniquely, so that when two sequences are compared, the alphabet for, say, the left elbow is the same in both sequences. We held the SAX window size parameter to 1; in other words, we used SAX only to discretizereal-valued series. Given sequences for all instances of an activity, we used the spectrum kernel technique [15], [16] as a sequence-similarity kernelfor use with SVM-based classification. We call this the SymbolicSequences and Spectrum Kernel (SSSK) method. The spectrum kernel technique is common in computational biology for protein classification. The feature map for a SVMis based on the frequency spectrum of the sequence. The k-spectrum of a symbolic sequence is a vector describing the frequency counts of all consecutive subsequences of length k (alsoknown as k-grams) in the original sequence. It is important tonote that the index of each element in the k-spectrum corresponds directly to a unique k-gram of the alphabet (see Figure-3 for a simple example). In other words, for any alphabet �with size|�|, thelength of any k-spectrum vector is equal to |�|�
Let �= {a,b,n} aa ab an ba bb bnnanbnn ksbanana= < 0 0 2 1 0 0 2 0 0 >
ksana= < 0 0 1 0 0 0 1 0 0 > ksbbnn= < 0 0 0 0 1 1 0 0 1 >
Figure-3. The k-spectrum (abbreviated as ks) for three
different sequences (banana, ana, bbnn) are shown fork = 2. The alphabet � has 3 symbols {a, b, n}.
In our work, each variable sequence uses a unique alphabet.That means for an action described by � different variable sequences, where each is described by an alphabet of size|�̂|, each k-spectrum vector will contain �|�̂| �number of elements. For example, actions in the MSRAction3D dataset (see below) are described by 60 different variable sequences (one for each of the three dimensions of each joint, for each of twenty joints). Using a modest alphabet of 5 symbols to describe each variable sequence, we end up with ∗ � elements for each k-spectrum. Clearly, we are working with very high-dimensional data vectors.
For classification, we use a kernel method that can take advantage of the k-spectrum feature. The best known of a class of algorithms for recognition or pattern analysis that use kernel methods is the Support Vector Machine (SVM). The goal of kernel methods is to map the data into higher dimensional spaces in order to separate the data linearly with a hyperplane. This mapping function rely needs to be calculated. Instead it suffices to use the dot product kernel � , . In our case the dot product kernel is equivalent to the spectrum kernel ��, where �� , is the inner product of two k-spectrum vectors x
and y (see Fig. 4). Note that if x and y share many k-grams, their inner product will yield a high value, which
intuitively reflects the high similarity of their subsequences.
� = (� . � � . � � . �� . � � . � � . � � . � � . � � . � ) Figure-4. The spectrum kernel ��for 3 different
sequences, where ���is the k-spectrum for sequence �.
Leslie et al. show that the spectrum kernel �� can
be efficiently computed using a tree data structure similar to a trie or suffix tree [15], [16]. Given the kernel, we use a SVM package (e.g., SVMlight) to build a binary classifier for each action class using the one-vs-all model. Lastly, we create a multi-class classifier by ranking the output of the binary classifiers and returning the class label associated with the highest score.
3.2.2 Computational cost
The space complexity for this approach is dominated by the kernel-building module and the training of SVMlight. The tree data structure for the kernel requires � � nodes, where n is the length of the longest input sequence and � is the length of the � −grams [15], [16]. In our case, the length of an input sequence is equal to the number of variable sequences used to describe each instance times the number of frames (i.e. = � ∗
� − − ). During training, the space complexity of SVM is quadratic in the total number of training instances.
The time complexity, on the other hand, derives from the complexity of the following modules:
Preprocessing of data uses linear interpolation and the Loess smoother. Both run in linear time on the length of the series.
Representation: Converting real multivariate time series into symbolic sequences using the SAX algorithm is linear to the length of each series (i.e., the number of frames).
Kernel: Building the spectrum kernel takes � � time, similar to the space complexity [15].
Building Model: SVM typically has a training time complexity that goes from � � to � � . , where M is the total number of training instances [34].
Testing: The time complexity for testing with a trained SVM model is linear on the total number of support vectors, which are typically much smaller than �. For a detailed analysis of the test time complexity in the context of the spectrum kernel, see the work of Leslie et al. [15].
4. DATASETS
We evaluated the SSPA and SSSK methods on three datasets.
4.1 KINECTU of a dataset (3D)
The actor was instructed to do the first 10 instances of each action in a slower manner than the latter 10 instances. All videos lasted at most 8 seconds. The depth maps captured by the Kinect were converted into articulated3D skeletons using the Shotton algorithm [32]. Though the algorithm yielded 20 joints for each skeleton, we only used 15 joints in our representation. The camera was fixed. The entire dataset consists of eleven activity classes: carry, climb a chair, climb a table, crawl under a table, lift a box from a chair, lift one hand, put a box on a chair, put a box on a table, sit on a chair, sit on a table, and step over an object.
The scene used to record the action was a relatively small space, which led to some occlusions of the actor in some of the videos. Furthermore, the depth map captured by the Kinect camera is not perfect due to the inherent noise of the sensor, resulting in a noisy data series that contains missing points. Pre-processing steps, such as interpolation and smoothing, are needed to clean upthe data.
4.2 MSRAction3D dataset (3D)
The MSRAction3D dataset is publicly available and was collected by a depth sensor similar to a Kinect device. The dataset contains twenty actions: high arm wave, horizontal arm wave, hammer, hand catch, forward punch, high throw, draw x, draw tick, draw circle, hand clap, two hand wave, side boxing, bend, forward kick, side kick, jogging, tennis swing, tennis serve, golf swing, pick up and throw. Ten different actors were used, eachperforming each action three times. The Shotton algorithm [32] was used to recover the 3D positions of each joint from the depth map.
4.3 DARPA mind’s eye sub-dataset (2D)
The DARPA Mind’s Eye program has created a
dataset of roughly 7000 videos of actors performing 48 different actions in a variety of scenes. We selected videos for twelve actions: carry, dig, fall, jump, kick, pick up, put down, run, stand, throw, turn, and walk. All the videos were shot with a fixed camera. The viewpoint on the actors varied from full-face to side view. There were multiple actors, males and females, and generally very high intra-class variability.
To obtain skeletons for the actors in these videos, we applied the 2D pose estimation software of Yang and Ramanan [42] in combination with the tracking software from [28]. Each skeleton comprises fifteen 2D points.
We selected 438 video clips based on DARPA’s movies as training data. We pre-screened these videos to ensure that the detected skeletons actually occupy the same 2D space (roughly) as the people they are supposed to represent. This was necessary because sometimes skeletons are detached from their people; for example, the person might be throwing a ball with his feet firmly on the ground but the detected skeleton might be fit to branches in a nearby tree. This was the extent of our screening; in particular, we did not require the skeleton’s limbs to be in the same 2D locations as those of the source person. The skeleton might have two arms in the air, for example,
while the source video shows a person self-occluding one arm and carrying a bag in the other. Clearly, these skeletons provide a noisy signal.
5. PROCEDURE
We used the SAX algorithm [19], [20] publicly available online (http://cs.gmu.edu/~jessica/sax.htm) to build our symbolic sequences. The kernel construction
software provided by Leslie’s lab was an ideal fit for our
application http://cbio.mskcc.org/leslielab/software/string-kernels) However,the software was developed in the context of protein classification and slight modifications to the alphabet - and consequently the substitution matrix - were needed for our spectrum kernel. All of our classification experiments were done using 10-fold cross validation. Each experiment was done 10 times and the average performance across 10 runs is reported. We obtain an accuracy measurement by first building an aggregated confusion matrix over all 10 runs, and then dividing the sum of the major diagonal vector by the total number of elements in the matrix. For each dataset, we evaluated the SSPA and SSSK methods over a small range of parameter settings. We show the best parameter configurations in Table-1 and report the correspondingresults in the next section.
Additionally, to make our findings comparable with other published results for the MSRAction3D dataset, we present results obtained by following the experimental procedure of Li et al. [17]. For this method, the dataset
was divided into three subsets of eight actions each and cross-subject testing was performed on each subset. Half of the positive instances for each unique actor were used in training and the other half for testing. An overall accuracy is obtained by averaging across all three subsets.
Table-1. Parameter settings used in our experiments.
SSPA SSSK
KINECTUofA
PPA window = 1 alphabet size = 14
gap = -2 match = 2 mismatch = -1
alphabet |�̂|= 7 k = 5
MSRAction3D
PPA window = 1 alphabet size = 14
gap = -2 match = 5 mismatch = -2
alphabet |�̂|= 5 k = 5
DARPA
Mind’s Eye
PPA window = 1 alphabet size = 14
gap = -2 match = 2 mismatch = -1
alphabet |�̂|= 10 k = 5
6. RESULTS
Table-2. Accuracy for 3 different datasets obtained from running 10-foldcross-validation 10 times on each set.
SSPA SSSK
KINECTUofA MSRAction3D DARPA Mind’s
Eye
0.931 0.900 0.542
0.766 0.770 0.348
Figures 5 and 6 show the confusion matrices for the KINECTUofA dataset using our SSPA and SSSK methods, respectively.Similarly, Figures 7 and 8 show the
confusion matrices for the DARPA Mind’s Eye dataset.
The key-action mapping for all three datasets can be found in Appendix A.1.
Figure-5. Aggregated confusion matrix for the KINECTUofA dataset across 10cross-validation
runs using SSPA.
Figure-6. Aggregated confusion matrix for the KINECTUofAdataset across 10cross-validation
runs using SSSK.
Figure-7. Aggregated confusion matrix for the DARPA
Mind’s Eye datasetacross 10 cross-validation runs using SSPA.
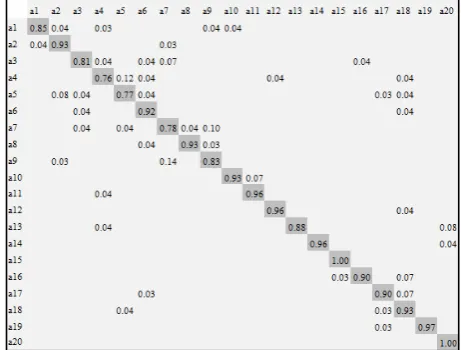
For the MSRAction3Ddataset, we show the confusion matrix for our SSPA approach across the entire dataset in Figure-9. We also present results under the cross-subject testing paradigm using three equal subsets of eight actions each. Performance is averaged across the three subsets and is presented in Table-3, along with other published results for comparison.
Figure-8. Aggregated confusion matrix for the DARPA
Mind’s Eye dataset across 10 cross-validation runs using SSSK.
Table-3. Classification accuracy for the MSRAction3D dataset from variouspublished methods and ours, using cross subject testing on three subsets ofeight actions each.
Method Accur
acy Recurrent Neural Network (2011) [23]
Dynamic Temporal Warping (2006) [25] Hidden Markov Model (2006) [22] Latency aware. Logistic regression (2012) [9]
SSSK SSPA
Action graph on Bag of 3D points (2010) [17] Histograms of 3D joints (2012) 29 [39]
EigenJointsNa¨ıve Bayes Nearest Neigh
(2012) [41]
Mining Actionlet Ensemble (2012) [38]
7. DISCUSSIONS
Our best result for the KINECTUofA dataset was 93.1%; for the MSRAction3D benchmarking dataset it
was 90.0%; and for the DARPA Mind’s Eye dataset,
54.2%. The large number of people, noisy signal, different view angles, self-occlusion and high intraclass variability in the DARPA dataset clearly hurt. That said, the DARPA dataset is the least contrived, most natural of the three.One compelling lesson of this study is that some datasets are in a sense too easy to serve as indications of how algorithms will work on natural, real-world activity identification problems. We compared our methods to other published results on the cross-subject test. The results are shown in Table 3. Our methods outperform four other approaches. Wang et al. [38] achieve considerably higher recognition accuracy than ours. This is probably because they use not only skeletal joints but also incorporate occupancy (LOP) features that capture information regarding action-object relationship.
[image:7.595.310.541.500.675.2]The confusion matrices tell us a lot about the sources of errors in our classifications. The KINECTUofA dataset indicates confusion between lift a box from a chair, put a box on a chair, and put a box on a table. These confusions arise because we do not detect objects. Also, the difference between putting a box on chair or putting a box on a table depends on the height of the box and how much a person needs to bend or stretch the body to perform the action. The confusion between lift one hand and put a box on a table is due to the fact that the actor performed these actions in a very similar way. The actor lifted a small box from the table using one hand and left his arm in a nearly straight horizontal position. This looks very much like the actor is going to put a small object on a table.
For the MSRAction3D dataset, the action bend is confused with action pick up and throw. The bend action starts with the body upright in a standing position. Then the body bends and returns to the initial position. These motions resemble the pick up portion of pick up and throw. The action hammer is confused with the draw tick action. The forward punch action is confused with both the horizontal arm wave and high throw actions, and the horizontal arm wave action is confused with the high arm wave action for the SSPA approach. In the last four actions it seems that SSPA can recognize a wave action but is not able to recognize if the action occurs in front of the body or above the human trunk; in both cases most of the movement is done in the horizontal direction.
In the DARPA Mind’s Eye dataset the biggest confusion occurs between carry, run, and walk. By visual inspection of the movies we found it is difficult to distinguish carry from walk if one cannot detect objects. We tried it ourselves: We superimposed the derived 2D skeletons onto a white background and tried - without success - to classify carry and walk. One needs to see an object, or strong skeleton cues that an object is there, to make this distinction with reliable accuracy. As to run vs. walk and run vs. carry, our approach is based on pose, not velocity, because symbolic sequences are ordinal representations that lose velocity information. The
confusion matrix in Figure-7 also shows the difficulty we had distinguishing throw from jump. Again, by visual inspection of skeletons on a white background we observed that when the actors were going to throw an object, they crouch and then stretch their bodies, much as they do when they jump.
Both the SSPA and SSSK approaches have free parameters. We ran extensive experiments to determine whether performance was robust over ranges of these parameters. We found that a PPA window size near 1 often yielded the best accuracy, while varying the alphabet size (for a fixed PPA window) had negligible effects. For the spectrum kernel, our experiments suggest that accuracy peaks with k = 5 and performance drops significantly for k > 10.
8. CONCLUSIONS
The methods presented here, SSPA and SSSK, are simple, quite efficient, moderately accurate, and work with 3D skeletons obtained from Kinect sensors and 2D skeletons obtained from vision algorithms. They are not the most accurate methods in the comparison in Table 3, but one important lesson of this study is that accuracy depends as much or more on the training and test corpora - on the degree to which activities include other activities, and the variability in view angle, and self-occlusion and related factors - and on exogenous abilities such as recognizing objects, as it does on the algorithm. For the time being, algorithms like SSPA and SSSK, which work with different input devices and have been tested on widely different data sets, have a role in helping the field of activity recognition establish some standard test corpora and benchmark results, even if other algorithms outperform SSPA and SSSK on particular corpora.
Figure-9. Aggregated confusion matrix for the MSRAction3D dataset across 10 different
cross-validation runs using SSPA.
labelingboth carry is asking for trouble. An important source of inter-class variability is what we call the prefix problem: Someactivities have others as prefixes. For example, throwing a ball has raising an arm as a prefix. The prefix problem is a methodological problem, having to do with how we assess accuracy, not a technical problem having to do with how we represent or detect activities. The right solution, we think, is to give credit for the detection of prefixes. When throwing a ball contains raising an arm, the detector should get credit for both answers. More sophisticated scoring schemes might upweight the containing activity (throwing a ball), but none should penalize a system for detecting both activities, as we currently do.
In extensive experiments with seven approaches to activity recognition, we found SSPA to be the best-performing over all the corpora we tested [24], while SSSK also yielded reliable performance across the board. In other words, they are robust. Much work remains to identify the reasons they are robust. It seems counterintuitive that the first step of both approaches is to throw away metric information, and yet both can perform as well or better than methods that keep real-valued information, such as dynamic time warping. We also experimented with approaches that map real-valued joint
locations to semantic features, such as ”left hand above head,” and found, again, that SSPA outperformed them
with SSSK not far behind.
In one respect, this is good news: SSPA and SSSK borrow from sequence analysis methods in computational biology, where the state of the art is advancing very quickly. As activity recognition scales up from short videos to continuous monitoring over long intervals, efficient sequence analysis methods fromcomputational biology will find a new home. One immediate application of these methods is to the problem of covariance or coarticulation between joints. We and other researchers treat joint locations as independent across joints, which, of course, lose a lot of information about coarticulation. We think that multiple sequence alignment methods such as MUSCLE [8] will recover coarticulation information and improve performance.
In conclusion, the contribution of this work is two algorithms that perform well and efficiently on data sets with very different characteristics, derived from RGBD (e.g., Microsoft Kinect) and conventional computer vision technology. To our knowledge, this paper is first to establish performance measures for such a variety of test corpora. While the performance of our algorithms is not the best in comparisons on the MSRAction3D dataset, the performance of SSPA and SSSK can serve as an easily understood benchmark over several corpora.
ACKNOWLEDGEMENTS
This work was partially supported by the DARPA
Mind’s Eye program. The U.S. Government is authorized
to reproduce and distribute reprints for Governmental purposes notwithstanding any copyright annotation thereon. The views and conclusions contained herein are those of the authors and should not be interpreted as
necessarily representing the official policies or endorsements, either expressed or implied, of DARPA or the U.S. Government.
REFERENCES
[1] Aggarwal J. 2004. Human motion: modeling and recognition of actions and interactions, Proceedings. 2nd International Symposium on 3D Data Processing, Visualization and Transmission, 2004. 3DPVT. pp.
640-647 (online), DOI:
10.1109/TDPVT.2004.1335299 (2004).
[2] Aggarwal J. and Cai Q. 1999. Human Motion Analysis: A Review, Computer Vision and Image Understanding. 73(3): 428-440 (online), DOI: 10.1006/cviu.1998.0744.
[3] Aggarwal J. and Ryoo M. 2011. Human activity analysis, ACMComputing Surveys. 43(3): 1-43 (online), DOI:10.1145/1922649.1922653.
[4] Bloom V., Argyriou V. and MakrisD. 2016. Hierarchical transfer learning for online recognition of compound actions: Computer Vision and Image Understanding. 144(C): 62-72.
[5] Buxton H. 2003. Learning and understanding dynamic scene activity: a review, Image and Vision Computing. 21(1): 125-136 (online), DOI: 10.1016/S0262-8856(02)00127-0.
[6] Campbell, L. and Bobick, A. 1995. Recognition of human body motion using phase space constraints, Computer Vision. (309): 624-630 (online), available from
http://ieeexplore.ieee.org/xpl/login.jsp?tp=&arnumber =466880.
[7] Chapelle O., Vapnik V., Bousquet O. and Mukherjee S. 2002. Choosing Multiple Parameters for Support. 46(1): 131-159.
[8] Edgar R. C. 2004. MUSCLE: multiple sequence alignment with high accuracy and high throughput. Nucleic acids research. 32(5): 1792-7 (online), DOI: 10.1093/nar/gkh340.
[10]Gavrila D. 1999. The Visual Analysis of Human Movement: A Survey, Computer Vision and Image Understanding. 73(1): 82-98 (online), DOI: 10.1006/cviu.1998.0716.
[11]Gavrila D. and Davis L. 1995. Towards 3-d model-based tracking and recognition of human movement: a multi-view approach, on automatic face-and gesture-recognition, pp. 3-8 (online), available from http://citeseerx.ist.psu.edu/viewdoc/download?doi=10 .1.1.56.5329&rep=rep1& type=pdfi.
[12]Gavrila D. and Davis L. 1996. 3-D model-based tracking of humans in action: a multi-view approach, Proceedings CVPR IEEE Computer Society Conference on Computer Vision and Pattern Recognition. pp. 73-80 (online), DOI: 10.1109/CVPR.1996.517056.
[13]Ju S., Black M. and Yacoob Y. 1996. Cardboard people: a parameterized model of articulated image motion, Proceedings of the Second International Conference on Automatic Face and Gesture Recognition, pp. 38-44 (online), DOI: 10.1109/AFGR.1996.557241.
[14]Junejo I. N. and Aghbari Z. A. 2012. Using SAX representation for human action recognition, Journal of Visual Communication and Image Representation.
23(6): 853-861 (online),
DOI:10.1016/j.jvcir.2012.05.001).
[15]Leslie C. and Eskin E. 2002. The spectrum kernel: A string kernel for SVM protein classification, of the Pacific Symposium on. 575: 564-75 (online),
available from
http://www.ncbi.nlm.nih.gov/pubmed/11928508http:// tangra.si.umich.edu/radev/767w10/papers/Week05/Si milarityKernels/leslie.pdfi.
[16]Leslie C. S., Eskin E., Cohen A., Weston J. and Noble W. S. 2004. Mismatch string kernels for discriminative protein classification. Bioinformatics (Oxford, England), Vol. 20, No. 4, pp. 467–76 (online), DOI: 10.1093/bioinformatics/btg431.
[17]Li W., Zhang Z. and Liu Z. 2010. Action recognition based on a bag of 3d points.Vision and Pattern Recognition. (Online), available from http://ieeexplore.ieee.org/xpls/absall.jsp?arnumber=55 43273.
[18]Li W., Zhang Z. and Liu Z. 2008. Expandable Data-Driven Graphical Modeling of Human Actions Based on Salient Postures. 18(11): 1499-1510.
[19]Lin J., Keogh E., Lonardi S. and Chiu B. 2003. A symbolic representation of time series, with implications for streaming algorithms, Proceedings of the 8th ACM SIGMOD workshop on Research issues in data mining and knowledge discovery - DMKD
’03, p. 2 (online), DOI:10.1145/882085.882086.
[20]Lin J., Keogh E., Patel P. and Lonardi S. 2002. Finding motifs in time series, Proc. of the 2nd Workshop on Temporal Data, (online), available from http://citeseerx.ist.psu.edu/viewdoc/download?doi=10 .1.1.19.6629&rep=rep1&type=pdf.
[21]Lin J., Keogh E., Wei L. and Lonardi S. 2007. Experiencing SAX: a novel symbolic representation of time series, Data Mining and Knowledge Discovery. 15(2): 107-144 (online), DOI: 10.1007/s10618-007-0064-z.
[22]Lv F. and Nevatia R. 2006. Recognition and segmentation of 3-d human action using hmm and multi-class adaboost, ComputerVisionECCV 2006, pp. 359-372 (online), available from http://www.springerlink.com/index/ekg4662x4478023 2.pdf.
[23]Martens J. and Sutskever I. 2011. Learning recurrent neural networks with Hessian-free optimization, Proc. ICML, (online), available from http://www.icml-2011.org/papers/532_icmlpaper.pdf.
[24]Mejía M. 2016. Action Recognition on Videos: Different Approaches, PhD Thesis, and University of Arizona (2012). (Online), available from http://citeseerx.ist.psu.edu/viewdoc/download?doi=10 .1.1.474.7255&rep=rep1&type=pdf.
[25]M¨uller M. and R¨oder T. 2006. Motion templates for automatic classification and retrieval of motion capture data, Proc. of the 2006 ACM SIGGRAPH.
(online), available from
http://www.mpiinf.mpg.de/mmueller/publications/200 6 MuellerRoederMotionTemplates SCA.pdf.
[27]Needleman S. B. and Wunsch C. D. 1970. A general method applicable to the search for similarities in the amino acid sequence of two proteins., Journal of molecular biology. 48(3): 443-53 (online), available from http://www.ncbi.nlm.nih.gov/pubmed/5420325.
[28]Pirsiavash H. and Ramanan D. 2011. Globally-optimal greedy algorithms for tracking a variable number of objects, Computer Vision and, pp. 1201-1208 (online), DOI: 10.1109/CVPR.2011.5995604.
[29]Rao C. and Shah M. 2001. View-invariance in action recognition, Proceedings of the 2001 IEEE Computer Society Conference on Computer Vision and Pattern Recognition. CVPR 2001, Vol. 2, pp. II–316–II–322 (online), DOI: 10.1109/CVPR.2001.990977.
[30]Sadanand S. and Corso J. J. 2012. Action bank: A high-level representation of activity in video, 2012 IEEE Conference on Computer Vision and Pattern Recognition, No. May, pp. 1234-1241 (online), DOI: 10.1109/CVPR.2012.6247806.
[31]Sheikh Y., Sheikh M. and Shah M. 2005. Exploring the space of a human action, Computer Vision, 2005. ICCV. pp. 1-6 (online), available from http://ieeexplore.ieee.org/xpls/abs%20all.jsp?arnumbe r=1541250.
[32]Shotton J., Fitzgibbon A., Cook M., Sharp T., Finocchio M.,Moore R., Kipman A. and Blake A. 2011. Real-time human pose recognition in parts from single depth images, Cvpr 2011, IEEE. pp. 1297-1304 (online), DOI: 10.1109/CVPR.2011.5995316.
[33]Sung J. and Ponce C. 2012. Unstructured human activity detection from rgbd images, Robotics and Automation. pp. 842-849 (online), DOI: 10.1109/ICRA.2012.6224591.
[34]Tsang I., Kwok J. and Cheung P. 2006. Core vector machines: Fast SVM training on very large data sets, Journal of Machine Learning Research. 6: 363-392
(online), available
fromhttps://www.cse.ust.hk/jamesk/papers/jmlr05.pdf .
[35]Turaga P. and Chellappa R. 2008. Machine recognition of human activities: A survey, Circuits and Systems. 18(11): 1473-1488 (online), available fromhttp://ieeexplore.ieee.org/xpls/abs%20all.jsp?arn umber=4633644.
[36]Vidhyapathi C. M. and Alex Noel Joseph Raj. 2016. Advances in the Analysis of Human Gesture Recognition Using Kinect Sensor: A review, ARPN Journal of Engineering and Applied Sciences. 11(11): 147-7154 (online), available from http://www.arpnjournals.org/jeas/research_papers/rp_ 2016/jeas_0616_4403.pdf.
[37]Wang J. J. and Singh S. 2003. Video analysis of human dynamicsa survey, Real-Time Imaging. 9(5): 321-346 (online), DOI:10.1016/j.rti.2003.08.001.
[38]Wang J., Liu Z., Wu Y. and Yuan J. 2012. Mining actionlet ensemble for action recognition with depth cameras.
[39]Xia, L., Chen, C.-c. and Aggarwal, J. K.: View Invariant Human Action Recognition Using Histograms of 3D Joints The University of Texas at Austin, International Workshop on Human Activity Understanding from 3D Data (2012).
[40]Yacoob Y. and Black M. 1998. Parameterized modeling and recognition of activities, Computer Vision, 1998. Sixth, (online), available from http://www.cs.cmu.edu/~dgovinda/pdf/recog/eigenCu rveCVIU.pdf.
[41]Yang X. and Tian Y. 2012.EigenJoints-based Action
Recognition Using Na¨ıve-Bayes-Nearest-Neighbor, Computer Vision and Pattern Recognition. (Online), available
fromhttp://ieeexplore.ieee.org/xpls/abs%20all.jsp?arn umber=6239232.
[42]Yang Y. and Ramanan D. 2011. Articulated pose estimation withflexible mixtures-of-parts, Computer Vision and Pattern, (online), available fromhttp://ieeexplore.ieee.org/xpl/login.jsp?tp=&arnu mber=5995741&url=http%3A%2F%2Fieeexplore.iee e.org%2Fxpls%2Fabs%2520all.jsp%3Farnumber%3D 5995741.
Appendix
A.1 Action keys for Results
Tables A-1, A-2, and A-3 contain key-action mapping for results presented in Section 6.
Table-A-1. Action keys for KINECTUofA.
Keys Actions
a1 Carry
a2 climb a chair
a3
climb a table
a4 crawl under a table
a5 lift a box from a chair
a6 lift one hand
a7 put a box on a chair
a8 put a box on a table
a9 sit on a chair
a10 sit on a table
a11 step over an object
Table-A-2. Action keys for MSRAction3D.
Keys Actions
a1 high arm wave
a2 horizontal arm wave
a3 Hammer
a4 hand catch
a5 forward punch
a6 high throw
a7 draw x
a8 draw tick
a9 draw circle
a10 hand clap
a11 two hand wave
a12 side boxing
a13 bend
a14 forward kick
a15 side kick
a16 jogging
a17 tennis swing
a18 tennis serve
a19 golf swing
a20 pick up and throw
Table-A-3.Action keys for DARPA Mind’s Eye.
Keys Actions
a1 carry
a2 dig
a3 fall
a4 jump
a5 kick
a6 pick up
a7 put down
a8 run
a9 stand
a10 throw
a11 turn