INTRODUCTION
Pollen allergy is associated with significant morbidity world-wide. The prevalence of pollen allergy appears to be on the
rise due to the impact of climate change.1,2 The distribution and prevalence of pollen allergy are subject to both geograph-ical and chronologgeograph-ical variations. In Australia, pollen from rye grass (Lolium perenne) is the most common sensitizing aller-gen among all pollen; 56.3% of Australians are sensitive to it.3 Pollen from Gramineae and olive is the most common type of sensitizing pollen in Spain; 79% and 58%, respectively, of the Spanish in Toledo are sensitive to them.4 In addition to these geographic differences, prevalence of pollen allergy undergoes changes with time. In Croatia, grass pollen had been reported as the most common sensitizing agent with a prevalence of 17.9% in 1992. However, weed pollen outnumbered grass pol-len in 1997 with a reported prevapol-lence of 29.0%. This was be-cause of an explosive increase in the number of airborne rag-weed pollen.5
Awareness of the temporal variation in airborne pollen
cou-A Six-Year Study on the Changes in cou-Airborne Pollen
Counts and Skin Positivity Rates in Korea: 2008–2013
Hye Jung Park
1,2, Jae-Hyun Lee
1,2, Kyung Hee Park
1,2, Kyu Rang Kim
3, Mae Ja Han
3, Hosoeng Choe
3,
Jae-Won Oh
4, and Chein-Soo Hong
1,21Division of Allergy and Immunology, Department of Internal Medicine, Yonsei University College of Medicine, Seoul; 2Institute of Allergy, Yonsei University College of Medicine, Seoul;
3Applied Meteorology Research Division, National Institute of Meteorological Science, Jeju; 4Department of Pediatrics, Hanyang University College of Medicine, Seoul, Korea.
Purpose: The occurrence of pollen allergy is subject to exposure to pollen, which shows regional and temporal variations. We eval-uated the changes in pollen counts and skin positivity rates for 6 years, and explored the correlation between their annual rates of change.
Materials and Methods: We assessed the number of pollen grains collected in Seoul, and retrospectively reviewed the results of 4442 skin-prick tests conducted at the Severance Hospital Allergy-Asthma Clinic from January 1, 2008 to December 31, 2013.
Results: For 6 years, the mean monthly total pollen count showed two peaks, one in May and the other in September. Pollen count for grasses also showed the same trend. The pollen counts for trees, grasses, and weeds changed annually, but the changes were not significant. The annual skin positivity rates in response to pollen from grasses and weeds increased significantly over the 6 years. Among trees, the skin positivity rates in response to pollen from walnut, popular, elm, and alder significantly increased over the 6 years. Further, there was a significant correlation between the annual rate of change in pollen count and the rate of change in skin positivity rate for oak and hop Japanese.
Conclusion: The pollen counts and skin positivity rates should be monitored, as they have changed annually. Oak and hop Japa-nese, which showed a significant correlation with the annual rate of change in pollen count and the rate of change in skin positivity rate over the 6 years may be considered the major allergens in Korea.
Key Words: Allergy, change, correlation, pollen, skin positivity rate, Seoul
Yonsei Med J 2016 May;57(3):714-720
http://dx.doi.org/10.3349/ymj.2016.57.3.714 pISSN: 0513-5796 · eISSN: 1976-2437
Received: July 20, 2015 Revised: September 2, 2015
Accepted: September 20, 2015
Co-corresponding authors: Dr. Chein-Soo Hong, Severance Health Check-up, 10 Tongil-ro, Jung-gu, Seoul 04257, Korea.
Tel: 82-2-1588-7757, Fax: 82-2-393-6884, E-mail: [email protected] and
Dr. Jae-Won Oh, Department of Pediatrics, Hanyang University Guri Hospital, 153 Gyeongchun-ro, Guri 11923, Korea.
Tel: 82-31-560-2254, Fax: 82-31-552-9493, E-mail: [email protected]
•The authors have no financial conflicts of interest.
© Copyright: Yonsei University College of Medicine 2016
nts and skin positivity rates in Seoul is invaluable in the man-agement of Korean patients with pollen allergy. Although there are many studies concerning the skin positivity rates in Korea, two studies showed significant changes in skin positivity rates with large-sized sample. The first study reviewed the changes in skin positivity rates over the past 30 years in Korea. The rate of skin positivity to house dust mite, which is the most com-mon indoor allergen, showed no changes over time. However, the rate of skin positivity to tree pollen has significantly incre-ased over the past 30 years. Rates of skin positivity to grass and weed registered a significant decrease in the 2010s compared to the 1990s.6-8 Another study demonstrated the correlation be-tween pollen counts and skin positivity rates in Busan over a period of 15 years.9 Because the skin positivity rates keep cha-nging geologically and chronologically, up-to-date reports of these changes for each region are essential.
Prior exposure to allergen is an essential prerequisite for an allergic reaction to occur, and the amount of pollen is a key fac-tor for inducing an allergic reaction.10-12 However, a direct corre-lation between pollen count and skin positivity rate is still sub-ject to controversy.13 We assessed the changes in the rate of skin positivity to pollen in Seoul over a 6-year period, and investigat-ed its correlation with the environmental pollen count.
MATERIALS AND METHODS
Participants
A total of 4442 patients treated at the Severance Hospital Aller-gy-Asthma Clinics in Seoul between January 2008 and Decem-ber 2013 served as the study subjects. The enrolled subjects had allergic symptoms and wanted to undergo allergic evalu-ation. They lived almost in Seoul or Gyeonggi-do, a province very close to Seoul. The results of their skin-prick test (SPT) in response to 33 inhalant allergens and their electronic medical records were retrospectively reviewed. This retrospective study was approved by the Institutional Review Board, Severance Hospital, Yonsei University Health System (approval number: 4-2015-0541).
Measurements of airborne pollen count
The airborne pollen count was monitored on a daily basis us-ing a Burkard Seven-day recordus-ing volumetric spore trap (Burkard Manufacturing Co. Ltd., Hertfordshire, UK) from Jan-uary 2008 through December 2014. For this purpose, samples were collected by the sampler for 144 minutes each day. The pollens accumulated on the glass stick were stained with Cal-berla’s fuchsin (10 mL glycerin, 20 mL 95% alcohol, 30 mL dis-tilled water, 0.2 mL basic fuchsin), covered with a cover glass, and histomorphometrically analyzed. Tree, grass, and weed pollens were collected from the observational field of the Kore-an Meteorological Administration in Seoul. The species of col-lected tree and weed pollen are listed in Table 1. Of note, we
could not classify grass pollen into subgroups on the basis of microscopic examination.
Skin-prick test
All subjects underwent a SPT for 33 allergens [alder, birch, oak, elm, pine, ragweed, Humulus japonicus (hop Japanese), walnut, plane tree, willow, mulberry, elder, white ash, acacia, poplar, Bermuda grass, cocksfoot, ryegrass, timothy, meadow grass, sagebrush, dandelion, Chenopodium spp., plantain, Der-matophagoides farinae, DerDer-matophagoides pteronyssinus, As-pergillus fumigatus, Candida albicans, Alternaria spp., cat hair, dog hair, German cockroach, and American cockroach], which were obtained from 3 companies (Allergopharma, Reinbek, Germany; Hollister-Stier, Spokane, WA, USA; Bencard, Lon-don, England).
[image:2.595.314.552.376.593.2]The SPT was conducted by a well-trained nurse. The stan-dard time-point for recording of the results was 15 minutes af-ter the SPT. A wheal ≥3 mm in size was defined as a “positive” response to a specific pollen. No steroid or antihistaminic drug was administered in the 7-day period immediately prior to the test. Atopy was defined as a positive response in the SPT to any one of the 33 inhalant allergens. We analyzed the correlation
Table 2. The Number of Enrolled Patients Underwent Skin Prick Test
Yr Total number of patients (male/female)
[image:2.595.315.553.618.734.2]Mean age (±standard deviation) 2008 612 (258/354) 42.7±16.5 2009 825 (345/480) 43.4±16.1 2010 754 (328/426) 40.8±16.5 2011 707 (312/395) 40.3±16.3 2012 703 (281/422) 41.0±15.8 2013 841 (352/489) 42.8±16.3 Total 4442 (1876/2566) 41.9±16.3 Table 1. The Species of Collected Pollen
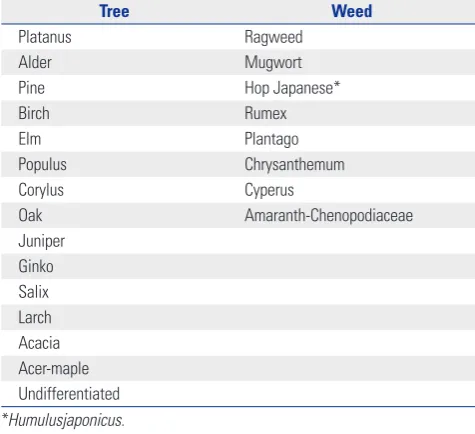
Tree Weed
Platanus Ragweed
Alder Mugwort
Pine Hop Japanese*
Birch Rumex
Elm Plantago
Populus Chrysanthemum Corylus Cyperus
Oak Amaranth-Chenopodiaceae Juniper
Ginko Salix Larch Acacia Acer-maple Undifferentiated
between the changes in pollen count and the skin positivity rate, as measured by the SPT, from January 2009 through De-cember 2013.
Statistical analysis
All statistical analyses were performed using SPSS version 18.0 (SPSS Inc., Chicago, IL, USA). A linear trend test within the ANOVA model was used to determine if there was any signifi-cant yearly change in the pollen count over the 6 years. Co-chran-Mantel-Haenszel statistics were applied to examine if there were any significant yearly changes in the skin positivity rate. The correlation between the rate of change in pollen count and the rate of change in the skin positivity rate was assessed using Pearson’s test. The criterion for determining statistical significance was a p-value of <0.05.
RESULTS
Patient demography
Patient enrollment was evenly distributed over the 6 years (Table 2). The average age (±standard deviation) of the
en-rolled patients was 41.9±16.3 years. Women comprised 57.7% of the study subjects. The demographics of enrolled subjects did not change over time.
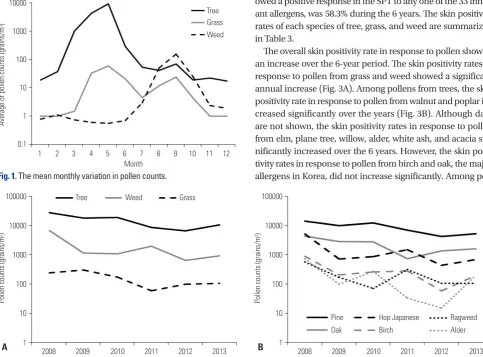
The mean monthly variation in pollen count
Fig. 1 shows the mean monthly variation in pollen counts for tree, grass, and weed for the 6 years (2008–2013). Tree pollen count showed a major peak in May and a minor peak in Sep-tember. Grass pollen count also showed two peaks, one in May and the other in September, although the total grass pollen count was low. In contrast to tree and grass pollen, weed pol-len counts showed only one peak in September (Fig. 1).
The changes in pollen counts over 6 years
The pollen counts of trees, grasses, and weeds showed yearly variations, but without any statistically significant trend (Fig. 2A). The pollen counts for all species, including pine, oak, birch, hop Japanese, ragweed, and alder, showed yearly variations, but these variations were not statistically significant (Fig. 2B).
Skin positivity rates in Korea in response to pollen during the 6-year study period
The total rate of atopy, i.e., the percentage of subjects who sh-owed a positive response in the SPT to any one of the 33 inhal-ant allergens, was 58.3% during the 6 years. The skin positivity rates of each species of tree, grass, and weed are summarized in Table 3.
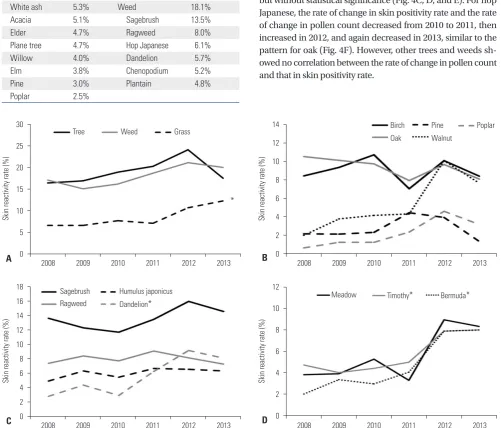
The overall skin positivity rate in response to pollen showed an increase over the 6-year period. The skin positivity rates in response to pollen from grass and weed showed a significant annual increase (Fig. 3A). Among pollens from trees, the skin positivity rate in response to pollen from walnut and poplar in-creased significantly over the years (Fig. 3B). Although data are not shown, the skin positivity rates in response to pollen from elm, plane tree, willow, alder, white ash, and acacia sig-nificantly increased over the 6 years. However, the skin posi-tivity rates in response to pollen from birch and oak, the major allergens in Korea, did not increase significantly. Among pol-Fig. 1. The mean monthly variation in pollen counts.
10000
1000
100
10
1
0.1
Month
Tree Grass Weed
1 2 3 4 5 6 7 8 9 10 11 12
Average of pollen counts (grains/m
[image:3.595.45.529.365.722.2]3)
Fig. 2. The changes of pollen counts for 6 years. (A) In tree, grass, and weed, (B) according to species.
100000
10000
1000
100
10
1
100000
10000
1000
100
10
1 Tree Weed Grass
Pine Oak
Ragweed Alder Hop Japanese
Birch
2008 2009 2010 2011 2012 2013 2008 2009 2010 2011 2012 2013
Pollen counts (grains/m
3)
Pollen counts (grains/m
3)
[image:3.595.44.277.365.533.2]lens from weeds, the skin positivity rate in response to pollens from dandelion increased significantly (Fig. 3C). Although data are not shown, the skin positivity rates in response to pollen from Chenopodium spp. and plantain increased significantly. However, skin positivity rates in response to pollen from other weeds, including sagebrush, ragweed, and hop Japanese, which are known as important allergens in Korea, showed no signifi-cant trend. Among pollens from grasses, the skin positivity rates in response to pollens from timothy, Bermuda grass, and
mea-dow grass significantly increased, whereas those in response to pollens from other grasses, including ryegrass, showed no significant change (Fig. 3D).
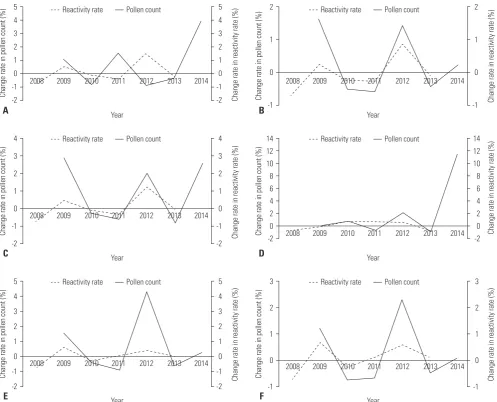
The correlation between changes in pollen counts and changes in skin positivity rates
Because pollen counts and skin positivity rates changed an-nually, we analyzed the correlation between them. Among pol-lens from trees, the rate of change in alder pollen count showed a pattern similar to the rate of change in the skin positivity rate, but without statistical significance (Fig. 4A). Both the pollen count for oak and the skin positivity rate in response to it de-creased simultaneously from 2009 to 2010, then inde-creased in 2012, again followed by a decrease in 2013. The correlation be-tween the rate of change in skin positivity rate and the rate of change in oak pollen count was statistically significant (Fig. 4B). Birch, elm, and ragweed also showed a similar pattern, but without statistical significance (Fig. 4C, D, and E). For hop Japanese, the rate of change in skin positivity rate and the rate of change in pollen count decreased from 2010 to 2011, then increased in 2012, and again decreased in 2013, similar to the pattern for oak (Fig. 4F). However, other trees and weeds sh-owed no correlation between the rate of change in pollen count and that in skin positivity rate.
Table 3. The Overall Mean Skin Positivity Rates to Pollen during 6 Years in Korea
Pollen Skin positivity rates Pollen Skin positivity rates
Tree 19.1% Grass 8.7%
[image:4.595.55.557.291.719.2]Oak 10.3% Timothy 6.3% Birch 10.0% Cocksfoot 6.1% Alder 9.0% Ryegrass 5.4% Walnut 6.0% Bermuda 5.3% White ash 5.3% Weed 18.1% Acacia 5.1% Sagebrush 13.5% Elder 4.7% Ragweed 8.0% Plane tree 4.7% Hop Japanese 6.1% Willow 4.0% Dandelion 5.7% Elm 3.8% Chenopodium 5.2% Pine 3.0% Plantain 4.8% Poplar 2.5%
Fig. 3. Changes of skin positivity rates to pollens. (A) Total, (B and C) tree, (D) weed. *The skin reactivity rate showed significant increase (p<0.05).
30 25 20 15 10 5 0
Tree Weed Grass
2008 2009 2010 2011 2012 2013
Skin reactivity rate (%)
*
A
18 16 14 12 10 8 6 4 2 0
Sagebrush Ragweed
Humulus japonicus Dandelion*
2008 2009 2010 2011 2012 2013
Skin reactivity rate (%)
C
14 12 10 8 6 4 2 0
Birch Oak
Poplar Pine
Walnut
2008 2009 2010 2011 2012 2013
Skin reactivity rate (%)
B
12 10 8 6 4 2 0
Meadow Timothy* Bermuda*
2008 2009 2010 2011 2012 2013
Skin reactivity rate (%)
DISCUSSION
During the pollination season, anemophilous plants produce small, lightweight pollen grains that may be disseminated by air currents over a large geographical area, sometimes exceed-ing 100 km. Inhalation of pollen causes allergic sensitization and leads to allergic symptoms. A minimum pollen count of 20–100 grains/m3 is necessary for most types of pollen to ex-hibit allergenic behavior.14 The allergenic potential of pollen grains depends on certain physical characteristics and air-borne behavior, including ease of dispersion, buoyant density, and pollen count. The amount of airborne pollen is also affect-ed by environmental factors such as temperature, humidity, wind speed, accumulated sunshine hours, rainfall, and atmo-sphere CO2 concentration.15-18 Therefore, geographical and temporal variations in pollen count play an important role in determining the allergenic potential and pattern of occurrence of pollen allergy.
In Korea, it is well known that the pollen count peaks once in spring (from March to June) and then again in autumn (from August to December).19 The majority of the pollen in spring come from trees and that in autumn from weeds. In contrast to the pollen count for trees, the count for grasses shows simi-lar peaks in May and September. The major cause of these two peaks is considered to be the rainfall occurring around July. Additionally, we can assume that these two peaks are due to different species of grasses, although we could not distinguish the species by microscopic analysis. The majority of pollen in September may be from reed and silver grass, which are wide-ly distributed in Korea. Further study is needed to definitivewide-ly prove this.
The pollen counts for trees, grasses, and weeds showed a yearly change over the 6 years, spanning from 2008 to 2013. In fact, all data regarding pollen counts in Korea have been ob-tained from the National Institute of Meteorological Research. The institute reported that pollen count does not show any
sta-Fig. 4. The correlation between changes of pollen counts and changes of skin positivity rates. (A) Alder, (B) birch, (C) oak, (D) elm, (E) ragweed, (F) hop japanese. Oak and hop Japanese showed statistical significance (p<0.05).
5 4 3 2 1 0 -1 -2 3 2 1 0 -1 5 4 3 2 1 0 -1 -2 3 2 1 0 -1 Year Year
2008 2009 2010 2011 2012 2013 2014 2008 2009 2010 2011 2012 2013 2014
Change rate in pollen count (%) Change rate in reactivity rate (%) Change rate in pollen count (%) Change rate in reactivity rate (%)
E F 4 3 2 1 0 -1 -2 14 12 10 8 6 4 2 0 -2 4 3 2 1 0 -1 -2 14 12 10 8 6 4 2 0 -2 Year Year
2008 2009 2010 2011 2012 2013 2014
2008 2009 2010 2011 2012 2013 2014
Change rate in pollen count (%) Change rate in reactivity rate (%) Change rate in pollen count (%) Change rate in reactivity rate (%)
C D 5 4 3 2 1 0 -1 -2 2 1 0 -1 5 4 3 2 1 0 -1 -2 2 1 0 -1 Year Year
2008 2009 2010 2011 2012 2013 2014 2008 2009 2010 2011 2012 2013 2014
Change rate in pollen count (%) Change rate in reactivity rate (%) Change rate in pollen count (%)
Change rate in reactivity rate (%)
[image:5.595.44.542.306.708.2]tistically significant trend in Korea (1998–2012).9 We also ob-tained similar results to previous reports concerning insignifi-cant pattern of pollen count changes. Especially, pollen counts for the major allergens such as oak, birch, alder, ragweed, and hop Japanese showed no significant changes over the 6 years (Fig. 2B).
The overall skin positivity rate increased during the study period. Although the skin positivity rate in response to pollens from trees did not increase significantly, those in response to pollens from grass and weed significantly increased annually during the study period. However, on a closer view, the skin positivity rate in response to major allergens, including birch, oak, mugwort, ragweed, and hop Japanese, showed no signifi-cant increase. These patterns of overall increase may be due to the increase of pollen counts or the changes in allergenicity of pollen. This study revealed that the pollen count showed yearly variations during the study period, but without statistical sig-nificance. Therefore, follow-up research with a longer study period and analysis of allergenicity is warranted to evaluate if the increase in skin positivity rate was due to long-term chang-es in pollen counts or due to changchang-es in allergenicity of pollen.
The skin positivity rate in response to pollens from grasses and weeds showed a step-up increment in 2012–2013 com-pared to 2008–2011. We could not find the causes underlying this rapid increase in the skin positivity rate. Further long-term studies should be conducted to evaluate whether this increase is transient or not. These recent increases in skin positivity rate might have been due to changes in climate, environment, and pollen counts. According to the Korean Forest Service report, the total forest cover has increased over the last 40 years. The extent of forest cover in 2010 was eleven times higher than that in 1973, and registered a 14% increase as compared to the pre-ceding year. Moreover, the distribution of vegetation has been changing due to environmental factors, such as climate chang-es, amount of rainfall, and levels of CO2. These changes are expected to have effects on the pollen count and also on the skin positivity rate in response to pollen. Therefore, a careful observation of minute changes in plants due to climatic and environmental changes (construction of pastures and parks, afforestation, planting within the stream, etc.) is needed.
In the present study, we demonstrated that the changes in pollen counts and those in skin positivity rate in the same year might be closely associated with each other. In particular, data pertaining to oak and hop Japanese showed a statistically sig-nificant correlation between the two. These results are concor-dant with those of many previous studies that showed that en-vironmental factors affect symptom provocation, sensitization rates and/or disease development.11,12,20,21 The observation that there is a significant correlation between the rate of change in pollen counts and the rate of change in skin positivity rate am-ong patients admitted to the institute in the same year, is very significant. Our findings provide an indirect evidence that oak in spring and hop Japanese in autumn are likely to be the major
allergens causing allergic symptoms in Korea, the severity of which would be dependent on their pollen counts.
However, overall skin positivity rate in response to pollens from trees, grasses, and weeds found in this study was not in agreement with the results of our earlier study,8 which involved the same study period (2010–2011). In the earlier study, the skin positivity rates in response to pollens from trees, grasses, and weeds were 34.1%, 14.1%, and 28.7%, respectively. We at-tribute this discrepancy to the difference in inclusion criteria between these two studies: all patients who underwent allergy skin test were included in the present study (1461 cases), where-as only patients with respiratory allergy disewhere-ases were includ-ed in the previous study (1135 cases).
Our study has some limitations. This study included patients with some allergic symptoms who visited an allergy clinic and underwent the allergy skin prick test, but did not yet have con-firmed allergic diseases. We did not look into their allergic dis-eases in detail. Therefore, a selection bias may exist. Second, we reviewed SPTs conducted at one institute only. Larger multi-center studies and population-based studies conducted on a nationwide scale are warranted.
In conclusion, the pollen counts from trees, grasses, and weeds changed annually during our study period, but without any statistical significance. The mean monthly pollen counts for grasses showed two peaks in a year, similar to total pollen count, even though the pollen count from grasses was low. The skin positivity rates in response to some types of pollen showed an increase over the 6 successive years. A significant correla-tion between annual rate of change in pollen count and the rate of change in skin positivity rate in the corresponding year was observed in case of oak and hop Japanese. Long-term studies are needed for definitively confirming the correlation between pollen counts and skin positivity rates.
ACKNOWLEDGEMENTS
Pollen data used in this study were collected through the finan-cial support of the National Institute of Meteorological Sciences and the Korean Academy of Pediatric Allergy and Respiratory Disease.
REFERENCES
1. Bajin MD, Cingi C, Oghan F, Gurbuz MK. Global warming and al-lergy in Asia Minor. Eur Arch Otorhinolaryngol 2013;270:27-31. 2. D’Amato G, Cecchi L, Bonini S, Nunes C, Annesi-Maesano I,
Beh-rendt H, et al. Allergenic pollen and pollen allergy in Europe. Al-lergy 2007;62:976-90.
3. Sercombe JK, Green BJ, Rimmer J, Burton PK, Katelaris CH, Tovey ER. London plane tree bioaerosol exposure and allergic sensitiza-tion in Sydney, Australia. Ann Allergy Asthma Immunol 2011;107: 493-500.
4. Subiza Garrido-Lestache J. [Allergenic pollens in Spain]. Allergol Immunopathol (Madr) 2004;32:121-4.
et al. Changing pattern of sensitization in Croatia to aeroallergens in adult population referring to allergy clinic during a period of 15 years. Coll Antropol 2011;35:529-36.
6. Kim CW, Lee JH, Jung HW, Choi SR, Cheong JW, Park JW, et al. Changing patterns of skin reactivity to inhalant allergens in asth-matic patients. Korean J Asthma Allergy Clin Immunol 2001;21: 205-15.
7. Yoon YW, Lee MK, Park HS, Park SS, Hong CS. The skin test reac-tivity and the level of the total IgE in the allergic patients. J Asthma Allergy Clin Immunol 1989;9:385-98.
8. Park HJ, Lim HS, Park KH, Lee JH, Park JW, Hong CS. Changes in allergen sensitization over the last 30 years in Korea respiratory al-lergic patients: a single-center. Allergy Asthma Immunol Res 2014; 6:434-43.
9. Sung MS, Park YJ, Park GH, Oh JW, Kim SW. The correlation be-tween allergy sensitization rate in pediatric and aerobiological study for airborne pollen in Busan for 15 years. Allergy Asthma Respir Dis 2014;2:38-47.
10. Lin RY, Clauss AE, Bennett ES. Hypersensitivity to common tree pollens in New York City patients. Allergy Asthma Proc 2002;23: 253-8.
11. Ariano R, Passalacqua G, Panzani R, Scordamaglia A, Venturi S, Zoccali P, et al. Airborne pollens and prevalence of pollenosis in Western Liguria: a 10-year study. J Investig Allergol Clin Immunol 1999;9:229-34.
12. Honda K, Saito H, Fukui N, Ito E, Ishikawa K. The relationship be-tween pollen count levels and prevalence of Japanese cedar polli-nosis in Northeast Japan. Allergol Int 2013;62:375-80.
13. Gautrin D, Vandenplas O, DeWitte JD, L’Archevêque J, Leblanc C, Trudeau C, et al. Allergenic exposure, IgE-mediated sensitization, and related symptoms in lawn cutters. J Allergy Clin Immunol 1994;93:437-45.
14. Adkinson NF Jr, Bochner BS, Burks AW, Busse WW, Holgate ST, Lemanske RF, et al. Middleton’s allergy: principles and practice. 8th ed. Philadelphia: Elsevier Saunders; 2013.
15. Oh JW. Development of pollen concentration prediction models. J Korean Med Assoc 2009;52:579-91.
16. Kim JH, Oh JW, Lee HB, Kim SW, Kang IJ, Kook MH, et al. Changes in sensitization rate to weed allergens in children with increased weeds pollen counts in Seoul metropolitan area. J Korean Med Sci 2012;27:350-5.
17. D’Amato G, Cecchi L. Effects of climate change on environmental factors in respiratory allergic diseases. Clin Exp Allergy 2008;38: 1264-74.
18. Singer BD, Ziska LH, Frenz DA, Gebhard DE, Straka JG. Research note: increasing Amb a 1 content in common ragweed (ambrosia artemisiifolia) pollen as a function of rising atmospheric CO2 con-centration. Funct Plant Biol 2005;32:667-70.
19. Oh JW, Lee HB, Kang IJ, Kim SW, Park KS, Kook MH, et al. The re-vised edition of Korean calendar for allergenic pollens. Allergy Asthma Immunol Res 2012;4:5-11.
20. Ariano R, Canonica GW, Passalacqua G. Possible role of climate changes in variations in pollen seasons and allergic sensitizations during 27 years. Ann Allergy Asthma Immunol 2010;104:215-22. 21. Lee JU, Kim JD, Park CS. Gene-environment interactions in