PC-MATLAB based Signal Generator Development
Ariffuddin bin Joretl, Nur Artikah binti Mohd Rashidl, Nor Ashidi Mat 1sa2,
Jiwa Abdullahl, Kamal Zuhairi Zamli2, Muhammad Faiz Liew Abdullahl,
Asmarashid ~onniran',
'Department of Electrical Engineering, Universiti Tun Hussein Onn Malaysia 2School of Electrical and Electronic Engineering, Universiti Sains Malaysia
1. Introduction
In practical implementation electronic circuit, each experiment has conditions that must be met to comply with the procedure which is only the input signal to be provided on the network. This input signal can vary . , ' depending on the experiment performed, such as signal in sinusoidal, triangular, or square. To generate these signals, the practicum used a device called a function generator. In educational field, especially for electrical engineering course, the function of function generator is very important to the student. A lot of assessment are using function generator to generate pulse and signal; completing their syllabus that were applied in industries and engineering field. But there is a limitation of spaces, time and devices that can interrupt the teaching and learning process. Also the function generators itself is that costing in the term of its value and maintenances. An alternative for this situation, within this Engineering Project the title 'PC-MA TLAB based Signal Generator Development' is proposed.
This Project will use MATLAB@ Graphical User Interface (GUI) as main engine to generate signal that can replace the application of function generator. Wider awareness of these new methods of generating signal will be of great benefit to those who work in the area of signal processing especially to student and industry. Besides, it also has commercialized value.
these applications will greatly increase, to the benefit users.
Within this project, a GUI is created for generating signal which are the sinusoidal, triangle and square signal. The signal, which is in digital form, will be mathematically manipulated through a technique of Digital Signal Processing. In general, Digital Signal Processors (DSPs) take real-world signals like voice, audio, video, temperature, pressure, or position that have been digitized and then mathematically manipulate them [I]. Signals need to be processed so that the information that they contain can be displayed, analyzed, or converted to another form that may be of use [2]. To obtain the output, signals will be generated in MATLAB environment and, then by using the soundcard of the Personal Computer (PC), it will be converted to analogue. The analogue output signal will be measured by using oscilloscope for the comparison and verification.
In developing this project, there is some other's project that becomes part of guidance as it has several similarities that related to this project [3-61. The project created by Debraj [3] having similarity with this project as it generates signal using personal computer software. Referring to Harry Jacobs [4], he creates a system that was designed using MAX038 high frequency waveform integrated circuit (IC) as the primary signal source. On the other hand, Diana L. Matcovich [5] used MATLAB Graohical User Interface (GUI) to demonstrate the , ,
Proceeding of National Conference of Electric and Electronic Engineering 2012
that has similarity with this project had been created by C. Dughir [7], as he develop a complex mathematical signals generator by using the software of Visual C++ that can generate a combination of mathematical signals at the output of a PC sound card.
2. Methodology
Function Generator is an expensive electrical device whether its price or maintenance. Thus this soft function generator is software without costing of maintenance because it can be easily duplicated and modify make it has high commercialized value. Although the manual function generator is simple and easy to use, there are several weaknesses which limit its applications and its usage. It is often difficult for the users to adjust the frequency and amplitude of the waveforms to the exact value required because of the tuning difficulty using potentiometers.
There are three types of signal which will be focused on which are sinusoidal waveform, rectangular waveform and triangular waveform. For the validation purpose, each of the signals developed from the PC will be analyzed by using Oscilloscope.
To create this project, MATLAB 7.8.0 (R2009a) is used to generate the signal. MATLAB M-file is used to write the script and function files, interface boxes, function for user application to generate desired signal. Mathematical functions syntax is written at the functions for callback function and generating signal. The generated signal wave form will be displayed at GUI window after the user clicking the selected button. Graphical User Interface, (GUI) which is one of the tools in MATLAB is use to be the interface between the system and the user. Technique of Digital Signal Processing is used to manipulate the signals that are generated in MATLAB. The digital signal will be transferred to the Dell Inspiron 1420 Sigmatel C-Major HD Audio Sound Card to be converted from digital signal to analogue signal as the output.
2.1 Project Flowchart
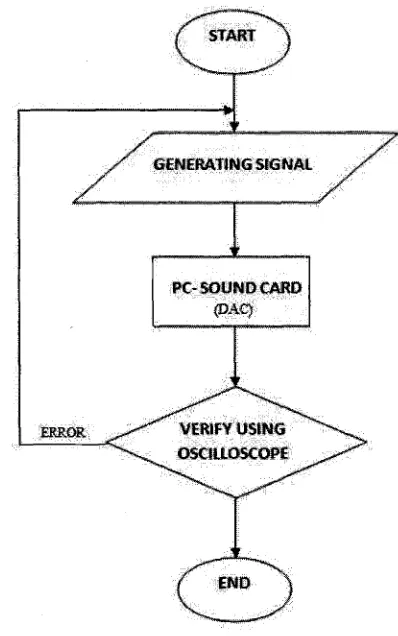
Figure 2.0 reports a scheme of the approach that aims to generate signal using PC-Matlab as a based. Generally, there are three main steps that have been done during completing this project. By referring Figure 2.0;
Figure 2.0: Methodology of the Project
2.1.1 Digital Signal Processing
Going through the first step (Fig.2.0), program is written in the Matlab M-File. The program will generate different types of signals which are sinusoidal waveform, triangle waveform and rectangular waveform according to the coding and equation given. At this point, the signal is in digital form. Digital Signal Processing technique will performs the encoding of the signal. After that, all the data will be stored in a built memory in the PC. This memory will gone through the technique of Digital Signal Processing again to decoding all the data back before the signal being converted from digital to analogue.
2.1.2
Digital to Analogue Converter
[image:2.538.297.496.71.389.2]2.1.3 Verification
At the third step (Fig.2.0), the process of verification is done to the analogue signal. The analogue signal will be passed to the Oscilloscope by using an interface between the audio jack and the probe of the Oscilloscope. If the signals generated are not as preferred, the step of second block will be done again and again until the preferred signal is developed.
3.
Results
3.1 Triangular Wave
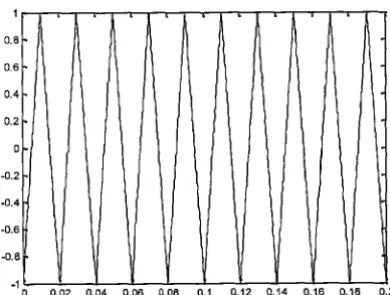
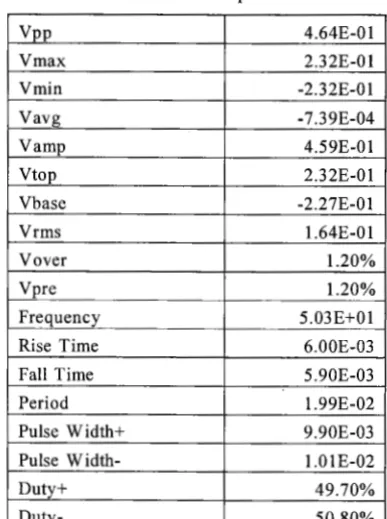
Figure 3.1.1 shows the output result of triangle wave from the Matlab window with the input frequency of 50Hz and amplitude of 1 and -1. On behalf, Figure 3.1.2 shows the validation result of triangle wave as viewed from an Oscilloscope.
Figure 3.1.1: Triangle wave shown from Matlab
Value obtains from the Oscilloscope:
Based on Figure 3.1.1 and Figure 3.1.2, it could be seen that the shape for Triangular wave is same.
As the signal being validate using the Oscilloscope, the actual value of the frequency drop a little bit from the given frequency which is 50Hz to 49.80Hz. Meaning that; Percentage of error = 5 0 Hz - 49.80Hz x 100%
50 Hz
= 0.4%
However, the Amplitude of the signal generated in Matlab is 1V and -lV. As viewed from the Oscilloscope, it becomes 0.232V and -0.232V
3.2 Sinusoidal Wave
Figure 3.2.1 shows the output result of sinusoidal wave from the Matlab window with the input frequency of 50Hz and amplitude of 1 and -1. Figure 3.2.2 shows the validation result of sinusoidal wave as viewed from an Oscilloscope.
[image:3.554.273.475.82.343.2] [image:3.554.42.237.317.464.2] [image:3.554.31.244.495.651.2]Proceeding of National Conference of Electric and Electronic Engineering 2012
Figure 3.2.1: Sinusoidal wave shown from Matlab
3.3
Rectangular wave
Based on Figure 3.2.1 and Figure 3.2.2, it could be seen
Figure 3.2.2: Sinusoidal Wave shown from the Oscilloscope
Value obtains from the Oscilloscope: o
-0.2
Figure 3.3.1 shows the output result of rectangular wave from the Matlab window with the input frequency of 150Hz and amplitude of 1 and -1. Then, Figure 3.3.2 shows the validation result of rectangular wave as viewed from an Oscilloscope.
= -0.6%
-0.4
-
-0.6-
On the other hand, the Amplitude of the signal generated in Matlab is lV, -lV. As viewed from the Oscilloscope, it becomes 0.232V and -0.232V.
0 0.01 0.02 0.03 0.04 0.05 006 0.07 0.08 0.09 0.1
that the shape for Sinusoidal wave is same.
-
-
-1.5
0 0.01 0.02 0.03 0.04 0.05 0.06 0.07 0.08 0.09 0.1
Figure 3.3.1: Triangular wave shown from Matlab
I
Figure 3.3.2: Rectangular wave shown from the Oscilloscope
As the signal being validate using the Oscilloscope, the actual value of the frequency increase a bit from the given frequency which is 50Hz to 50.30Hz. Meaning that; Percentage of error = 50 Hz - 50.3Hz x 100%
[image:4.540.54.252.81.241.2] [image:4.540.45.258.271.426.2] [image:4.540.287.491.353.512.2] [image:4.540.52.246.484.744.2] [image:4.540.280.494.543.701.2]Value read from the Oscilloscope:
Based on Figure 3.3.1 and Figure 3.3.2, it could be seen that the shape for Rectangular wave is same.
As the signal being validate using the Oscilloscope, the actual value of the frequency drop a little bit from the given frequency which is 150Hz to 149Hz. Meaning that; Percentage of error = 150Hz - 149.00Hz x 100%
150Hz
= 0.67%
In addition, the Amplitude of the signal generated in Matlab is 1V and -lV. As viewed from the Oscilloscope, it becomes 0.216V and -0.224V.
4.0 Discussion
A signal generator could be developed by using a PC-MATLAB. The shapes for the three signals generated in this project are same as it has been verified using Oscilloscope. The frequency differs of each signals generated in Matlab also not too differed from the actual frequency that are validate in Oscilloscope. With a small percentage of error of frequency which are 0.4% for triangular waveform, 0.17% for rectangular waveform, and 0.67% for sinusoidal waveform. However, there is a small distortion happen at the signal due to the PC- soundcard noises and other errors for the rectangular waveform. The plotted graphs shown in Matlab are only diagrammatic representation of the actual values shown in Oscilloscope. As it could only be a representation, the amplitude of plotted graphs which is 1 is representing for 0.232V and -1 is representing for -0.232V. Without any distortion or noises, the voltage supply from the audio jack gives out the value of 0.232VI-0.232V for a wave's
amplitude of 11 -1. This is because the peak amplitude of Dell Inspiron 1420 Sigmatel C-Major HD Audio Sound Card approximately 0.464Volts. As the line level signal is an alternating current signal, meaning that its voltage varies from -0.232 V to +0.232 V.
5.0 Conclusion
As a conclusion, signals which are sine wave, triangular wave and rectangular wave could be generated by using PC-Matlab based. With this soft function generator, user are much more easier to applied the signal in their experiments; just run the program in user personal computer; the user interface at the desktop and clicking the mouse rather than setting function generator manually at the lab. Besides, the user has no need to buy expensive signal generators or expensive signal generation systems
in order to generate the desired waveforms. It could also be simply duplicates and consume low cost in maintenance.
6.0 References
[I] Steven W. Smith, "The Scientist and Engineer's
Guide to Digital Signal Processing ", 1'' ed. California
Technical Publishing, 1997.
[2] http:l/www.analog.com/en/content/beginners~gu
ide-to-dsp/fca.html
[3] Debraj, "PC-Based Signal Generator", 2010.
[4] Harry Jacobs, "PC-Based Function Generator", Indiana University
-
Purdue University Fort Wayne, 2002.[5] Diana L. Matcovich, "Development of
MATLABB GUI for Signal Processing Methods for
the Extraction of Non-Stationary Sinusoids " 2005.
[61 Denis Pavliha, Matej ReberSek, Damijan MiklavEiE, " A Graphical User-interface Controller
for the Biomedical High-voltage Signal Generator",
University of Ljubljana, Faculty of Electrical Engineering, TriaSka 25, SI-1000 Ljubljana, Slovenia. [7] C. Dughir, "Visual C++ Complex Mathematical
Signal Generator ' ', "Politehnica" University of