NUMERICAL ANALYSIS ON THE EFFECTS
OF AIR FLOW IN THE WAKE OF A LARGE
VEHICLE ON TRAILING A PASSENGER
CAR
SHAHRIN HISHAM AMIRNORDIN
MALAYSIAN TECHNICAL UNIVERSITIES
CONFERENCE ON ENGINEERING AND
TECHNOLOGY
28-29 JUNE 2010
BAYVIEW HOTEL
Proceedings of MUCET2010 Malaysian Technical Universities Conference on Engineering and Technology June 28-29, 2010, Bayview Hotel, Melaka, Malaysia MUCET2010
Numerical Analysis on the Effects of Air Flow in the Wake of a Large Vehicle
on Trailing a Passenger Car
S h a h r i n H i s h a m A m i r n o r d i n * , W a n S a i f u l - I s l a m W a n S a l i m * * , M o h d F a i z A r i f f i n , , Suzairin M d Seri, A k m a l N i z a m M o h a m a d , H a m i m a h A b d R a h m a n , Ishkrizat T a i b , A h m a d Jais A l i m i n
Abstract
— This study focuses on the relative
values of drag and lift forces acting on a passenger
trailing a large vehicle (drafting) under unsteady
conditions. The simulation is conducted using
FLUENT CFD software for a two-dimensional
flow domain at Re 3.65x10
6for a trailing distance
of 0 to 30 meters. The unsteady effect is studied at
15 time intervals for each time step. Turbulence is
simulated using the RANS k-epsilon model.
Results show that aerodynamically, the critical
drafting distance is between four to five meters
where a sharp peak is observed for drag at five
meter distance. The lowest drag is found to occur
at four meters. The results show the suitable
distance for drafting which may serve as useful
information for vehicle fuel economy and
stability.
Keywords: aerodynamics, drafting, drag, lift
I. INTRODUCTION
D
rafting or slipstreaming is a technique where two vehicles or objects align in a close group reducing the overall effect of drag due to exploiting the lead object's slipstream. Especially when high speeds are involved, large vehicles such as busses and trucks traveling at high speeds results in the formation of a large turbulent flow in the wake region. This turbulent flow is very unsteady in nature hence its influence on the air flow within its vicinity will also be unsteady. In high speed roads such as the national highways where large vehicles travel at high speeds, it is important for us to understand the extent as to how the air flow behavior around these large vehicles affect other vehicles.• S h a h r i n Hisham A m i r n o r d i n in A u t o m o t i v e Research Group ( A R G ) , Faculty o f Mechanical and M a n u f a c t u r i n g Engineering, Universiti T u n Hussein Onn Malaysia, 8 6 4 0 0 , Parit Raja, Batu Pahat, Johor (Phone' + 6 0 7 - 4 5 3 8 4 5 3 ; fax: 0 7 - 4 5 3 6 0 8 0 ; e - m a i l : s h a h r i n @ u t h m . e d u . m y ) .
* * W a n Saiful-lslam W a n Salim in A u t o m o t i v e Research Group ( A R G ) Faculty o f Mechanical and M a n u f a c t u r i n g Engineering, Universiti T u n Hussein Onn Malaysia, 8 6 4 0 0 , Parit Raja, Batu Pahat, Johor. (e-mail [email protected]. my).
In aerodynamics study, experiments mainly involve the measurement of the aerodynamic coefficients and flow visualization over vehicles. The same measurements and flow visualizations can also be done using numerical methods through Computational Fluid Dynamics (CFD) without having to undergo rigorous and costly wind tunnel tests.
Ahmed [1,2] performed a series of wind-tunnel experiments in order to examine the wake structure around typical automobile geometries. The study focused on the time averaged structure obtained from visualizations of flow in the wake region for smooth quarter scale automobile models. Experiments were also performed with a bluff-body, "generic" vehicle geometry where pressure measurements, wake surveys and force measurements for different angles of base-slant are presented. Results indicated that almost 85% of total aerodynamic resistance is contributed by pressure drag and most of this drag is generated at the rear end.
Han [3] performed a numerical study over a three-dimensional bluff-body in proximity to the ground. Due to the lack of detailed velocity measurements over this body, this work compared qualitatively the formation of the vortices in the wake and the drag coefficient for different slant angles. The author used two different RANS based turbulence models namely the k-6 and the RNG k-e. It was reported that the overall validity of the computations was dependent on the turbulence model and the accuracy of the discretisation scheme.
Sinisa and Davidson [4] stated that the consideration was not only the drag and lift coefficients that describe the aerodynamic properties of the body, but also the flow structures responsible for these properties. The forces acting on the surface of the body as a result of the surface pressure were studied both time averaged and instantaneously in the study. So, while the flow around the bodies is highly unsteady, our knowledge of this flow is based primarily on experimental and numerical studies of time averaged observations. The study has shown that the instantaneous flow is very different from the time averaged one, not only in the wake region but also along the entire body.
concept of travelling in a convoy is being explored among trucks as the drag reduction between 10-40% was observed.
time steps to see whether there are any obvious fluctuations of CD and CL.
II. METHODOLOGY
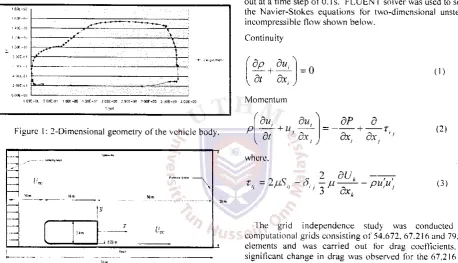
[image:3.595.308.556.104.177.2]The present numerical study is conducted on a two-dimensional car model as shown in Figure 1. A model of a passenger bus is also constructed and located upstream from the car in the flow domain. The body takes the shape of a hatchback passenger car with dimensions of 4.325 m in the stream wise direction and 1.353 m in height. The geometry of the computational domain is given in (Figure 2) which shows the bus being placed in a tunnel which is 20 m in height and 70 m in length which accounts for six times the overall length of the bus with one length upstream and five lengths downstream.
Figure 1: 2-Dimensional geometry of the vehicle body.
U
m\
Figure 2: Geometry of computational domain.
Table 1: Drafting position of the car.
Srtof
Simulation
I - -1 <s - s 0 10 11Drafting
Position
[in]
Sniffle
cm
0 1 0.5 1 0 :.o j 0 4.0 5 0 10 o 20 0 ! 0 0
' dp <9w, ^
dt dx.
- 0
du, 8u,
— - + u, —
-dt 'dx,
j j
dP
|d
dx, dx, ''
where.
2
dU
k—
r„ = 2uSh
- o, . — u - puu,
"
h" " 3
Hdx
L.
y' '
(D
(2)
(3) A uniform velocity of 30 m/s was set at the flow inlet. A pressure based solver was used along with the RANS k-e turbulence model. Standard wall functions were used for near wall treatment. T h e transient computation was carried out at a time step of 0.1 s. F L U E N T solver was used to solve the Navier-Stokes equations for two-dimensional unsteady incompressible flow shown below.
Continuity
The grid independence study was conducted for computational grids consisting of 54.672, 67.216 and 79.761 elements and was carried out for drag coefficients. No significant change in drag was observed for the 67,216 and 79.761 grids.
I I I . RESULT AND DISCUSSION
In this work, the incoming mean velocity, U, was set at 30 m/s. No-slip boundary conditions were used at the walls. The conditions result in Reynolds N u m b e r of 3 . 6 5 x l 06
based on inlet velocity and vehicle length. Airflow was assumed to be incompressible and adiabatic. T h e conditions at the outlet were left as "outflow" and were automatically obtained from the computation. T h e computational domain was constructed with unstructured Tri-Mesh (with meshing spacing 0.1 and the mesh type was TGrid).
Initially, the simulation of the bus and car was conducted separately for validation and grid dependence study check. Afterwards, the passenger car was positioned at different locations within this distance in the trailing wake as shown in Table I. The resulting drag and lift forces at these different locations were obtained. Since the simulation was unsteady, the drag and lift forces were determined at several
3.1 Flow Analysis around the Bus and Passenger Car
[image:3.595.61.520.240.503.2]with pressure contour in figure 4. T h e car produces counter rotating vortices (figure 5) at the near end similar to that produced by the bus.
P
i l
» _ »*>t
.et* <i:r*<i t, o;n, uaj. »•» *»*. .n..-iao>rtn. cwt».»» FlUe*T»j01U>K Up.ltl*Mi>
rotating vortex formed on the roof of the trailing vehicle (numbered as " 3 " in figure 6). The direction of rotation in vortex 2 and 3 plays an important role in reducing the drag of the trailing vehicle.
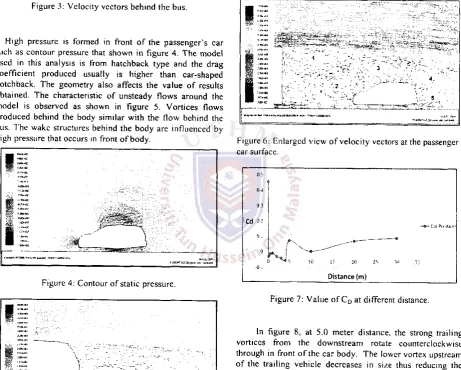
Based on the graph in figure 7, the relative value of CD
decreases from 0.1 to 4.0 meters. The relative value in that drafting distance is around 0.0464 until 0.51. The result shows that the passenger car seems to be sucked forward at close distance. The value of drag coefficient (CD) suddenly
[image:4.594.68.289.85.209.2]increases as much as 0.128 when the drafting position is increased to 5.0 meters. The increment of this value is caused by a change of pressure force produced around the body surface. In other word, drafting position at 4.0 to 5.0 meter is a critical position to be discussed further.
Figure 3: Velocity vectors behind the bus.
[image:4.594.67.529.217.587.2]High pressure is formed in front of the passenger's car such as contour pressure that shown in figure 4. The model used in this analysis is from hatchback type and the drag coefficient produced usually is higher than car-shaped notchback. The geometry also affects the value of results obtained. T h e characteristic of unsteady flows around the model is observed as shown in figure 5. Vortices flows produced behind the body similar with the flow behind the bus. The wake structures behind the body are influenced by high pressure that occurs in front of body.
Figure 4: Contour of static pressure.
Figure 5: Velocity vectors behind the passenger (
3.2 Flow Analysis in Drafting Condition
1
:r:;
V* • •.'•,. ' 3
-1 -1
1
- ' V > .
• f
±
;4.
1
"
:5
- —»
Figure 6: Enlarged view of velocity vectors at the passenger car surface.
3.5
0.4
0.3
Cd 0 :
0.1
—*— Car J'o>iliot;
M
10 If. 20 2', 30 33
D i s t a n c e ( m )
Figure 7: Value of CD at different distance.
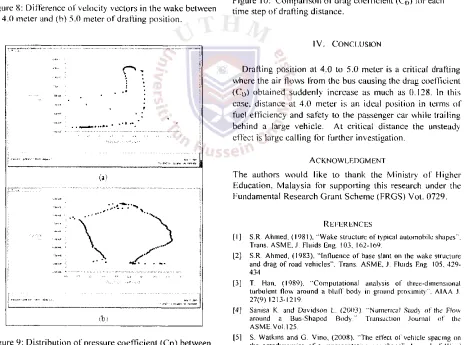
In figure 8, at 5.0 meter distance, the strong trailing vortices from the downstream rotate counterclockwise through in front of the car body. The lower vortex upstream of the trailing vehicle decreases in size thus reducing the suction effect, hence the higher drag. The entire observation for this analysis shows the drag coefficient (CD) is low at 4.0
meter of the drafting distance. Based on the pressure distribution in figure 9, high pressure is produced at the top and behind the passenger car while low pressure is produced in front of the body. At 5.0 meter, the pressure force produced acting on the entire car body. The effects of distribution show the higher pressure is produced at front and behind the body.
[image:4.594.67.296.368.633.2]3.3 Drag Forces at Different Time Intervals
An unsteady simulation is carried out for 7 time intervals with 0.7 seconds. T h e early analysis indicates that for 5 meters drafting distance, the drag varies significantly with time compared to drag for shorter drafting distances. This indicates that at critical drafting distances the flow and the wake structure is highly unsteady in nature and further investigation into this phenomenon is required. The value of drag force varies as much as 0.328.
m. m m m
^
u\
0 0,1 \ 0 . 2 0.3 0.4 0.5 0.6 0.7 0.8
\
3meter
- 4meter \ - Smeter
IOmeter
[image:5.595.81.268.44.308.2]Time Step (s)
Figure 8: Difference of velocity vectors in the wake between (a) 4.0 meter and (b) 5.0 meter of drafting position.
„ [
V * l
t
.»* «• •• \
( a )
::
\
! ii A ,
..3
(bf
[image:5.595.312.522.182.306.2]Figure 9: Distribution of pressure coefficient (Cp) between (a) 4.0 meter and (b) 5.0 meter of drafting position.
Figure 10: Comparison of drag coefficient (CD) for each
time step of drafting distance.
I V . CONCLUSION
Drafting position at 4.0 to 5.0 meter is a critical drafting where the air flows from the bus causing the drag coefficient (CD) obtained suddenly increase as much as 0.128. In this
case, distance at 4.0 meter is an ideal position in terms of fuel efficiency and safety to the passenger car while trailing behind a large vehicle. At critical distance the unsteady effect is large calling for further investigation.
ACKNOWLEDGMENT
The authors would like to thank the Ministry of Higher Education, Malaysia for supporting this research under the Fundamental Research Grant Scheme (FRGS) Vot. 0729.
REFERENCES
[ I ] S R. A h m e d , ( 1 9 8 1 ) , " W a k e structure o f typical automobile shapes Trans. A S M E , .1. Fluids Eng. 103, 162-169.
[ 2 ] S R. A h m e d , ( 1 9 8 3 ) , " I n f l u e n c e o f base slant on the wake structure and drag o f road vehicles", Trans. A S M E , J. Fluids Eng. 105, 4 2 9 -4 3 -4 .
[3] T. Han. ( 1 9 8 9 ) , " C o m p u t a t i o n a l analysis o f three-dimensional turbulent flow around a b l u f f body in ground proximity", A I A A J 2 7 ( 9 ) 1 2 1 3 - 1 2 1 9 .
[ 4 ] Sanisa K . a n d D a v i d s o n L.. ( 2 0 0 3 ) " N u m e r i c a l Stud)' o f the Flow around a Bus-Shaped B o d y . " Transaction Journal o f the A S M E . V o l . 1 2 5 .
[image:5.595.75.539.323.668.2]