ESCORT (Enterprise Services Cross-sell Optimization
Using Rigorous Tests of Association)
Nishant Saxena
Hewlett Packard Enterprise, India
Copyright©2017 by authors, all rights reserved. Authors agree that this article remains permanently open access under the terms of the Creative Commons Attribution License 4.0 International License
Abstract
Cross Selling has been used successfully by many organizations historically. The core idea behind cross selling is the consumer behavior of buying a product or service along with another product or service; which he or she may not have bought otherwise. Traditionally cross selling has been done using the gut feeling and common sense. With advent of statistic many organizations in retail industry started using analytical methods to identify cross sell opportunities. The key to their success was predominantly the robust historical sales database built over time and the option to choose from endless permutations and combinations of products which they could sell. But the enterprise or B2B businesses, especially in services industry, have not been so lucky; as the biggest challenge for them has been the lack of sufficient data and the high price of enterprise service offerings. We would like to share through this paper that how we succeeded in solving these problems and how one can apply market basket analysis on their sales pipeline data to not only improve revenue but to also cut down the operating cost. We strongly believe that this approach could be very useful for a lot of B2B organizations in the services industry with multiple offerings and limited budget to pursue all possible cross sell opportunities.Keywords
Cross Sell, Optimization, Sales Pipeline, Association Rules, Apriori Algorithm, Test of Association, Sales Lead Generation1. Introduction
HPE Enterprise Services (ES) had been challenged with its reduced sales opportunity wins across globe for last few years. HPE ES Leadership had been aggressively looking for every possible opportunity to boost its sales, with a lot of focus on winning new business and ensuring full and on time renewals; still the results had been less than expected. In the process of looking for alternative approaches, we realized that cross sells have taken a back seat and were being done
intuitively. We showcased that HPE ES could not only increase its revenue but can also increase its ROI, by using an analytical approach to cross sell.
2. Materials and Methods
2.1. Objectives
1. Use scientific optimization technique to boost the Sales of HPE Enterprise Services business, instead of just relying on intuition/ instinct of sales person.
2. Study if Statistical Cross Sell techniques can be applied to Enterprise Business Successfully, where data is not sufficient to use traditional techniques.
2.2. Related Work
Association mining or cross sell optimization is not new in the market. Many organizations have succeeded in past and continue to do so using various analytical approaches. Lots of researches have also been done on choosing the right objective measure for association rules. But all the research and work on cross sell has historically been done in the retail industry. Cross sell has been the key to success for many organizations which have huge volume of sales and who have good practice of historical sales record keeping. The application of cross sell optimization in Enterprise world is niche. In enterprise business, the transactions are not that frequent, resulting in lesser data points. On top of that, the high price of offerings limits organizations in terms of bundled purchases, resulting into a need to keep an eye on the budget or total addressable market. We could not find much information online on the application of cross sell optimization in enterprise business or B2B stratosphere.
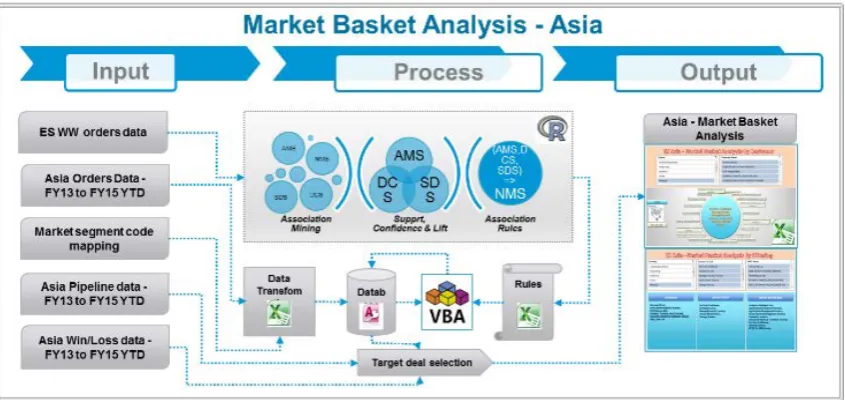
2.3. High Level Design
Figure 1. High Level Design
2.4. Data
We used the WW Orders, Sales Pipeline and Finance Data from Enterprise Data Warehouse for our study. As we are bound by ‘No Disclosure Policy’ so we won’t be able to share the actual data used in our analysis, but we would try to give as clear picture as possible of the type and kind of data used by us.
Once the sales is done the Purchase Order (PO) or Order is issued by the buyer to a seller, indicating type, quantity and agreed price for the product or service sold. All the seller organizations maintain a database which keeps a record of all such purchase orders raised in past (based on organization’s records management policy); which is called Orders database. Before a sale is done or a deal is signed the opportunities/ deals are generally recorded in every organization in a database which is called Sales Pipeline Database. The Sales Pipeline, as described above, keeps track of all the opportunities pursued by an organization and helps the organization track it pursuit and do self-appraisal say in terms of its win rate (how many opportunities were won out of all the opportunities that an organization pursued). Last but not the least the Official book keepers of any organization are their finance team, and they maintain their own database in terms of revenue, margin, FFYR (First Fiscal Year Revenue), etc. This database generally has the most reliable numbers, and also becomes a differentiator when it comes to finding out what was agreed upon in sales deals versus what actual cash flow happened.
So essentially, from the data bases described above, one needs to find out the product/service that was sold, to who that was sold, at what price was the product/ service sold, when did the sale happen, what was the quantity of the sale, what was the cost of the product/ service sold, which products/ services were sold together, the cash flows, etc. 2.5. Cross Sell Optimization
Cross Selling is the action or practice of selling an
additional product or service to an existing customer. The objective of cross selling could be either to increase the income derived from the clients or to protect the relationship with them. But cross selling comes with its own risk and if not done intelligently then it could also have various negative results. Traditionally cross selling has been done using the gut feel of the sales representative or at times as random trials. But lately businesses have started understanding its value more and are building wider strategies around cross sell. As much as 50% of enterprise revenue could come from cross sell, and that in itself is a great indicator of the attention which cross sell deserve in today’s world.
and it did help boost the sale. The logical argument supporting this association could be something like people waiting in line to buy diapers tends to drink beer; but that was post the discovery of the association not something which would come to the mind of an average seller.
Let us elucidate the concept of “Association Rule Mining”. The concept essentially revolves around finding out what can possible sell with a particular item say X. In other words, what is the probability that a person buying X would also buy Y. One example from day to day life could be bread and butter; if one buys bread, most probably he/ she would buy butter as well. So keeping butter across bread in a shop can result in cross sell. The concept though simple, is not so easy to apply. There are two key issues which need to be addressed when applying association analysis to market basket data. First, discovering patters from a large transactional data set can be computationally expensive. Second, some of the discovered patterns are potentially spurious because they may happen simply by chance. 2.5.1. The Apriori Algorithm
An association rule is an implication expression of the form X --->Y, where X and Y are disjoint itemsets. There are various ways to measure the strength of the association rule like Support, Confidence, Lift, etc. A brute force
approach for mining association rules is to calculate the Support, Confidence, Lift, etc. for every possible rule. This approach though would be very expensive as there are exponentially many rules which can be extracted from a dataset. One of the common strategies adopted by many is to decompose the problem into two major tasks [1, 2]: 1. Frequent Itemset Generation, whose objective is to
find all the itmesets that satisfy the minimum support threshold. These itemsets are called frequent itemsets. 2. Rule Generation, whose objective is to extract all the
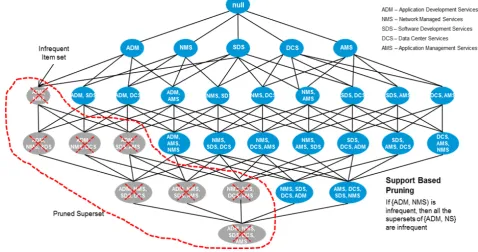
[image:3.595.63.542.421.673.2]high confidence rules from the frequent itemsets found in the previous step. These rules are called strong rules. The computational requirements for generating frequent itemsets are generally more expensive than those of rule generation. We would describe one of the more commonly used optimization techniques called the Apriori principle. It says that if an itemset is frequent, then all of its subsets must be frequent. Conversely, if an itemset is infrequent, then all of its supersets must be infrequent too. Thus the frequent itemsets generation can limited by pruning the infrequent itemsets. This strategy of trimming the exponential search space based on the support measure is known as support-based pruning, guided by the anti-monotone property of the support measure. Support based pruning is explained below (Figure 2).
The Apriori algorithm uses a level wise approach for generating association rules, where each level corresponds to the number of items that belong to the rule consequent. Initially, all the high-confidence rules that have only one in the rule consequent are extracted. These rules are then used to generate new candidate rules. Using this, if any node in the lattice has low confidence then the entire subgraph spanned by the node can be pruned immediately. Here we do not have to make additional pass across the datasets to compute the confidence of the candidate rule, instead we determine the confidence of each rule by using the support counts computed during frequent itemset generation. 2.5.2. Algorithm Optimization
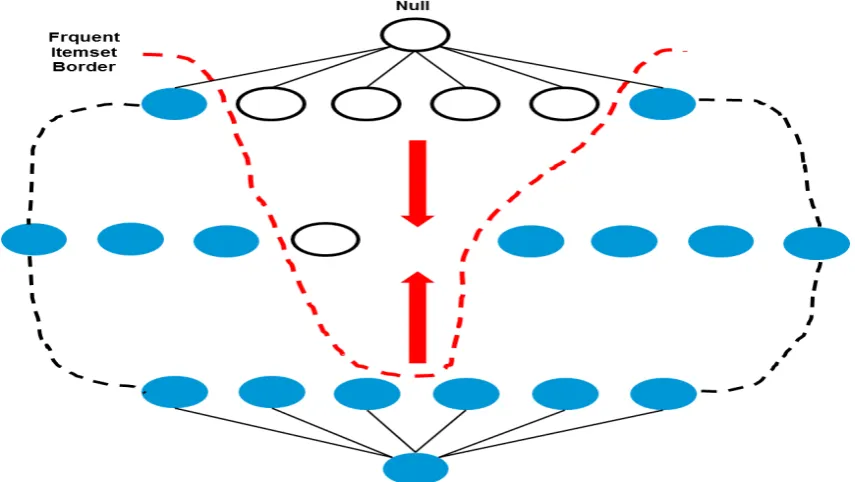
Apriori is one of the earliest algorithms to have successfully addressed the combinatorial explosion of frequent itemset generation; by applying the Aproiri principle to prune the exponential search space. But this algorithm still incurs considerable I/O overheads. We used one of the methods to improve its efficiency, namely Bidirectional Lattice Traversal strategy. A search for frequent itemsets can be conceptually thought of as a traversal on the itemset lattice. The search strategy employed by an algorithm dictates how the lattice structure is traversed during the frequent itemset generation process. The Apriori algorithm uses a general-to-specific search strategy, where the pair of frequent (k-1) itemsets are merged to obtain candidate k itemsets. This strategy is effective provided the
maximum length of a frequent itemset is not too long. Alternatively, a specific-to-general search strategy looks for more specific frequent itemsets first, before finding the more general frequent itemset. This strategy is useful to discover maximal frequent itemset in dense transactions, where the frequent itemset border is located near the bottom of the lattice. The bidirectional approach requires more space to store the candidate itemset, but it can help to rapidly identify the frequent itemset border, given the configuration as shown below (Figure 3).
2.5.3. Objective Measures of Interestingness
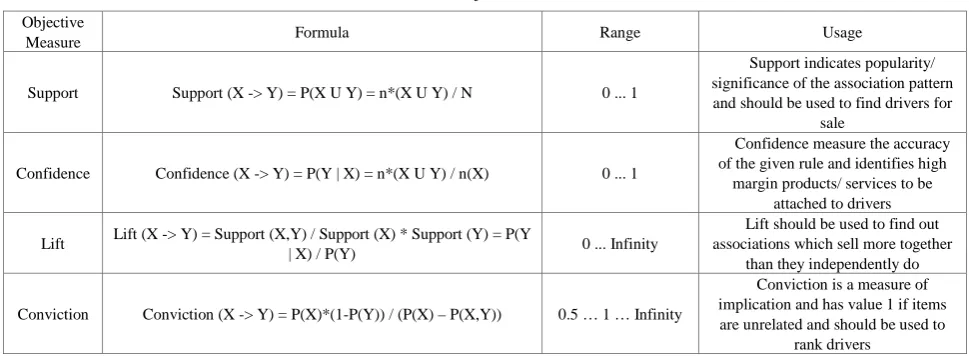
[image:4.595.92.520.449.690.2]As described above the Apriori algorithm relies on support and confidence measures to eliminate uninteresting patterns. The drawback of support is that many potentially interesting patterns involving low support items might be eliminated by the support threshold. The pitfall of confidence is that it could be misleading. There are many examples which could be found online to show how confidence could be misleading, for example the famous Tea ---> Coffee example, where the confidence let you conclude that the 75% of tea drinkers drink coffee as well, contrary to the fact that 80% of non-tea drinkers drink coffee. Because of these drawbacks of Support and Confidence measure, many more objective measures have come up [3, 4]. We used two for our study, Lift and Conviction. Various objective measures are summarized below (Table 1).
Table 1. Objective Measures
Objective
Measure Formula Range Usage
Support Support (X -> Y) = P(X U Y) = n*(X U Y) / N 0 ... 1
Support indicates popularity/ significance of the association pattern and should be used to find drivers for
sale
Confidence Confidence (X -> Y) = P(Y | X) = n*(X U Y) / n(X) 0 ... 1
Confidence measure the accuracy of the given rule and identifies high
margin products/ services to be attached to drivers
Lift Lift (X -> Y) = Support (X,Y) / Support (X) * Support (Y) = P(Y
| X) / P(Y) 0 ... Infinity
Lift should be used to find out associations which sell more together
than they independently do
Conviction Conviction (X -> Y) = P(X)*(1-P(Y)) / (P(X) – P(X,Y)) 0.5 … 1 … Infinity
Conviction is a measure of implication and has value 1 if items are unrelated and should be used to
rank drivers
2.5.4. Significance Test for Association Rules
Due to the complex nature of Association Mining, even with the objective measures of interestingness described above, there can always be a doubt about which is the best rule. Adding a significance test for each rule would provide an additional criterion for judging rule importance [5, 6]. We used the Karl Pearson’s Chi-squared test for the same. For the rule X ---> Y, the chi-squared test for independence evaluates the null hypothesis that the presence or absence of Y is not related to the presence or absence of X. The test is based upon a 2 x 2 contingency table comprised of the cross-tab frequencies of X and Y. The equation for significance test is given below (1).
א2 = n (Lift – 1)2 * ((Supp * Conf) / (Conf – Supp) * (Lift – Conf)) (1) Where,
Supp (X -> Y) = P(X U Y) = n*(X U Y) / N Conf (X -> Y) = P(Y | X) = n*(X U Y) / n(X)
Lift (X -> Y) = Supp (X, Y) / Supp (X) * Supp (Y) = P(Y | X) / P(Y)
2.6. Challenges Faced
The real challenge was to apply the traditional market basket analysis, used in retail industry, for enterprise business. In enterprise business, the transactions are not that frequent, resulting in lesser data points. On top of that, the high price of offerings limits organizations in terms of bundled purchases, resulting into a need to keep an eye on the budget or total addressable market. We would like to share through this paper that how we succeeded in solving these problems and how one can apply market basket analysis on their sales pipeline data to not only improve revenue but to also cut down the operating cost. We strongly believe that this approach could be very useful for a lot of organizations in the services industry with multiple offerings and limited budget to pursue all possible cross sell opportunities.
The key business questions addressed by our research are: 1. Where to play or who should be the targets?
2. What are the Offerings or Solutions to Cross Sell? 3. What are our Risks and Returns?
2.7. Our Approach
We started by collecting historical sales orders data from the HPE Enterprise Data Warehouse. The data was first cleansed and prepared for analysis, using normal outlier detection and imputation techniques. To address the issue of lesser data points, we decided to not only look for services purchased together at one point in time, but to also consider services purchased together over a period of time as equivalent to being purchased together. We then used r apriori algorithm for deriving the association rule. We modified the apriori algorithm to use bi-directional lattice traversal search strategy instead of using the in-built general-to-specific search strategy. It is a combination of general-to-specific and specific-to-general search strategy, which accounts for wiser pruning. We decided to use the four objective measures of association analysis: ‘Support’, ‘Confidence’, ‘Lift’ and ‘Convection’; as we wanted the results to be very robust. We also did significance test for Association Rules using Chi-squared test of independence, as means of additional precaution. The result was a set of nx1 association rules, which could be trusted to be dependable and ready to use. We did not follow the complete nxn approach keeping in mind the price celling for bundled purchase. We finally did the lead generation, by choosing the relevant association rules from all the rules identified above, based on the thresholds set by us for the 4 objective measures of association.
the association rule, so that they could be advised to sell the identified target offering alongside. We also identify the accounts which have sold the left hand side offerings of the association rule in recent past, by looking at the sales orders data, to suggest target offerings that could be sold next.
We even went further to priorities the account wise lead generation, based on the purchase likelihood of HPE ES offerings. Such an approach could be very useful for business in terms of increased ROI or in-case they do not have time and budget to pursue all the identified cross sell opportunities. We used a mixed bag approach of looking at ‘historical win rates of accounts’, ‘Net Promoter Score’, ‘existing install base’, etc. We also analyzed the ‘Total Addressable Market’ and ‘Competitors’ for HPE ES. Though these prioritization approaches are out of scope of this paper but we leave it on the reader to choose a few of them, as per their convenience, in combination with ESCORT to do intelligent targeting.
2.8. Major Results
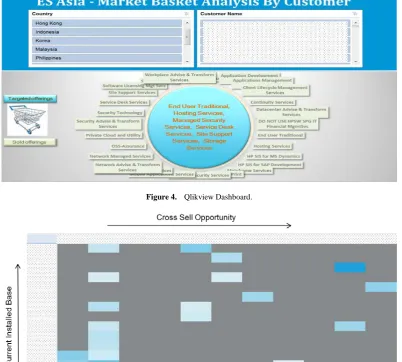
[image:6.595.107.507.310.500.2]The output from ESCORT was incorporated in a Qlikview Dashboard which could be easily used by various SMEs and Leaders. It showcased the Lead generation/ Target offering identification for each country by account, which could be pursued by the sales rep as a cross sell opportunity. A snapshot of the dashboard is shown below (Figure 4).
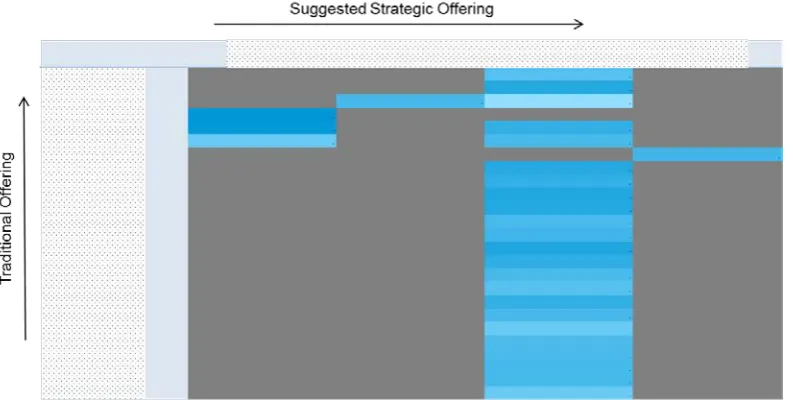
Identification of strategic offerings which could be sold to existing traditional clientele is represented using a heat map as shown below (Figure 5). The darker shades of blue represent higher probability. Due to ‘No Disclosure Policy’ we are sorry to say that we have to hide the offering names.
Next you can see below how offerings heat map based on cross sell score to priorities cross sell opportunity can be created (Figure 6). The darker shades of blue represent higher probability. Due to ‘No Disclosure Policy’ we are sorry to say that we have to hide the offering names.
[image:6.595.105.508.318.680.2]Figure 4. Qlikview Dashboard.
Figure 6. Cross Selling based on Installed Base
3. Implication
Cross-sell lead generation or association rule mining has been there in the industry for quite a long time and has been successfully used by various companies to boost their business. But its usage has been very limited in the Enterprise Business, especially in Services Industry. We want to share our study with them to emphasize the power of analytics and to motivate them to apply cross-sell analytics in their business. Developing and implementing an in-house mechanism like ESCORT can benefit any services organization by ensuring:
1. Optimum usages of Installed Base Accounts 2. Manageable Cost of Pursuit & Higher ROI 3. Increased Add On wins and Higher Revenue
Disclaimer
This document is published only for information purpose. The document is provided without any representation and in no event shall HPE be liable for the use of the information made available in the document. The information has been provided on an "as is" basis without warranty of any kind. Further copying, reproduction or redistribution of the document is expressly prohibited. In no event shall HPE be liable for lost profits or any direct, indirect, special, punitive, incidental or consequential damages arising out of or in
usage of the document. HPE is registered trademark of Hewlett Packard Enterprise and its subsidiary.
REFERENCES
[1] R C Agarwal, C C Agarwal, V V V Prasad. A Tree Projection Algorithm for Generation of Frequent Itemsets, Journal of parallel and distributed computing (special issue on high performance data mining), Vol. 61, 350-371, 2001
[2] R. Agarwal, T. Imielinski, A. Swami. Mining association rules between sets of items in large databases, Proceedings of the ACM SIGMOD International Conference on Management of Data, Vol. 22, 207-216, 1993
[3] Pan-Ning Tan, Vipin Kumar, Jaydeep Srivastava. Selecting the right objective measure for association analysis, Elsevier Information Systems, Vol. 29, 293-313, 2004
[4] Stephane Lallich, Olivier Teytaud, Elie Prudhomme. Association Rule Interestingness: Measure and Statistical Validation, Vol. 43, 251-275, 2007
[5] Michael Faron, Goutam Chakraborty. Easily Add Significance Testing to your Market Basket Analysis, Paper 204, SAS Global Forum 2012