
In situ study of the initial stages of oxidation of alloy u 6wt % nb with angle resolved x ray photoelectron spectroscopy (ARXPS)
14
0
0
Full text
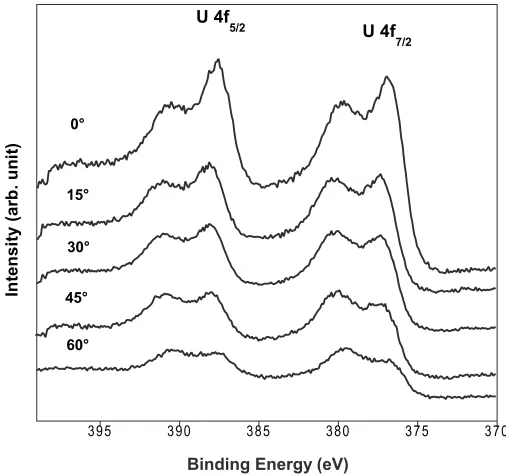
(2) Journal of Science and Technology UTHM. 1. IntroductIon Angle Resolved X-Ray Photoelectron Spectroscopy (ARXPS) is widely used as a non destructive depth profiling analysis together with providing chemical state information for a thin oxide layer on the top surface layer of materials. This technique has been used for investigating the depth profiling analysis for several metals. For this study, Angle Resolved X-ray Photoelectron Spectroscopy (ARXPS) has been used because it is well suited for thin film surface analysis [1, 4, 5, 9]. The use of the ARXPS technique, as illustrated in many texts and reviews, is justified by the fact that a uniform surface layer contributes more to the overall signal as the angle of analysis is changed from perpendicular towards grazing incidence [1-13]. However, not so many works has been reported for the alloy. For an alloy such as U-6Nb, the oxide layer forming on it surface is quite complicated due to the formation of binary oxide system on its surface consisting UO2 and Nb2O5. The study of the oxidation state of a clean surface of this alloy has been reported by W.L Manner et. al and X. Fu et. al. using XPS techniques. They have revealed that the formation of a critical thickness of passive oxide layer of Nb2O5 played an important role as a corrosive resistant barrier on the uranium metal surface [16, 24]. But, further details of the passive oxide position on the metal surface and the mechanism of it growth is still in doubt. Hence, a series of U-6Nb oxidation has been performed at various take-off angle, 0° to 60° that permitted to reveal a further detail of UO2 and Nb2O5 oxide growth from the bulk to the uppermost the alloy surface. Furthermore by varying the signal detection angle, additional depth information can be derived and can be used to reconstruct a depth profile of the interface at the sub-nm level. An oxide doping effects to be relevant one expects improvement in oxidation resistance with the addition of low levels of alloying elements, which is not observed experimentally. It has been shown that the formation of a critical density of Nb2O5 during oxidation of a U6wt.% Nb alloy by O2 and H2O enhances corrosion resistance at temperature up to 500 K [16]. It was postulated that a thin film of Nb2O5 prevents diffusion of reactive anions such as O- or OH-, into the oxide/metal interface region. Similar observations were made in a study of a U-20 at.% Nb using XPS [24]. However, the formation of a complex oxide layer in the sub-surface region as suggested in [14,15] is still in doubt and unclear. Knowledge of the initial stages of oxidation for this alloy is important for a clear understanding of the changes in the surface chemical and physical properties, which reflect the corrosion behaviour of the metal on long exposure to either atmospheric or storage environments. Hence, an attempting to the study of initial stages of oxidation of alloy U - 6 wt.% Nb using Angle Resolved X - Ray Photoelectron Spectroscopy (ARXPS) is carried out. This is to establish a support evidence for the explanation of the native oxide formation on the metaloxide interface for U-6Nb alloy.. 2. ExpErImEntal The experiment are performed in an ultra high vacuum (UHV) equipped with facilities for surface characterization, XPS system (Kratos XSAM 800) system and surface sputtering 44. chap 4.indd 44. 12/13/2009 12:46:27 AM.
(3) Journal of Science and Technology UTHM. treatment, (PHI ion gun). Details of the apparatus and the methods used have been described elsewhere [1, 16-24]. The base pressure of the chamber is less than 1 x 10⁻⁹ Torr, which obtained by a combination of turbomolecular, ion and titanium sublimation pumps. The sample stage-manipulator is also fitted inside the chamber and permitted the X-Y-Z position and rotation of samples to be modified relative to the detector. The analysis area on the sample surface was positioned with respect to the detection column using a laser spotter. The sample could also be rotated eucentrically from 0° to 360° in order to perform analysis at different angles and also known as Angle Resolved X-Ray Photoelectron Spectroscopy (ARXPS). In this work, the sample surface was rotated at a appropriate take-off angle in range of 0° to 60° (respect to the normal surface), which is reasonable for studying the oxidation state of the sample from the top surface down to the bulk of the material. A non monochromatic MgKa sources with incident power of 200 W is used to produce photon energy of 1253.6 eV, which excite X-ray photoemission. Then photoelectrons are detected from various take-off angles by the concentric hemispherical analyzer, CHA operated in the fixed analyzer transmission mode, with pass energy of 40 eV. Compared with normal emission XPS, grazing is much more surface sensitive. Since the attenuation length of photoelectron is very short (10-20 Å), the electron escape depth is limited to the top few atomic layers of the solid grazing angle. For normal angle XPS, a larger fraction of photoelectrons originates deeper in the bulk of the sample. In this work, the range of the exposed surface analysis is covered from the top surface of the samples to the bulk of the samples. The samples used in this work were machined square coupons about 15x15 mm in size and 1 mm thick, taken from uranium-niobium alloy sheet-stocks. The alloy contained 6 wt. % (14.1 at.%) Nb and will be referred to hereafter as U-6Nb alloy. Prior to the exposure experiments, the samples was mechanically polished using successively finer grit SiC pads and 1 μm diamond abrasive paste. After polishing, they were cleaned ultrasonically in ethanol, dried in air and immediately transferred, within 5 min, to the XPS instrument. For the ARXPS study reported hereafter, analysis was performed at various positions of take off angle, between 0 and 60°, under ultra high vacuum (UHV) conditions. The take-off angle of the emitted photoelectron was measured with respect to the normal at the sample surface and the direction toward the detector. This permitted the surface oxide characterisation at each take-off angle position to be considered. Before the UHV exposure, a clean sample should be obtained. To do so, several sequences of 5 keV of Ar+ ion sputtering were applied until no oxygen signal was detected. The UHV exposure depended on the base pressure of the residual gas inside the analysis chamber, which was of the order of 11x10-9 Torr. The nature of the residual gaseous species inside the vacuum chamber was identified using a residual gas mass analyser, Spectramass Selector 100. From the measurement of the residual gasses, it has been revealed that the UHV atmosphere was mainly comprised of H2O with a partial pressure PH2O ≈ 10.0x10⁻⁹ Torr; a measurable quantity of H2 (PH2 ≈ 5.0x10⁻⁹ Torr), CO (PCO ≈ 6.0x10⁻¹⁰ Torr) and a small background of O2 (≈2x10⁻⁹ Torr) and CO2 (≈3.8x10⁻⁹ Torr). 45. chap 4.indd 45. 12/13/2009 12:46:27 AM.
(4) Journal of Science and Technology UTHM. As a clean surface was achieved, the analysis of the exposure surface was carried out by recording the intensity of the emitted photoelectron signals at 0°, 15°, 30°, 45° and 60° take-off angle. During each series of angle resolved measurements, acquisition time and stoppage time were recorded to estimate the rate of oxide growth. The number of recorded measurements or sweeps for each region including wide and narrow scan was set at 3 sweeps with a dwelling time of 100 sec to achieve good statistics. Later a spectral fitting procedure was carried out using curve fitting software, PISCES. For spectral deconvolution, this software package was able to perform multitask manipulation of the raw data to allow a best curve fit. Before curve fitting of the recorded narrow scan spectra, the peaks positions were corrected using the C 1 s photoelectron peak, at a binding energy of 284.6 eV, as a reference. For all of the analysis, the exposure can be also expressed in units of Langmuir (1L = 1 x 10⁻⁶ Torr s). 3. rEsults and dIscussIon Narrow scan ARXPS spectra for uranium, oxygen and niobium at 0° to 60° take-off angles are shown in Figures 1, 2 and 3. The change in shape of the photoelectron signals for the metal and oxide with respect to the change in the take-off angle has been used to characterise the nature of the oxidation process. On the other hand, the O1 s photoelectron region for U-6Nb differed markedly from that recorded for this alloy. At the 0° take-off angle, close to the metal surface, the acquired signal had a single Gaussian shape with binding energy close to 531.0 eV. However, as the surface was titled to 15°, the oxygen 1s peak became distorted with a very pronounced peak to the high binding energy side. This peak became increasingly prominent on further exposure of the sample surface, to the extent that the original peak almost disappeared as shown in Figure 2. As the alloy surface was tilted from 0° to 60° take-off angle during ARXPS measurement, the position of the U 4f5/2 and U 4f7/2 binding energies shifted progressively towards higher binding energy as illustrated in Figure 1. The variation in the value between the initial measurement at 0° and final measurement at 60° was due to two factors. Firstly, the interaction between the metal surface and the residual gas in the analysis chamber between the measurement at each take-off angle, and secondly, the changing depth of analysis. The binding energies of the peaks for the uranium metal (U 4f5/2 and U 4f7/2) and uranium oxide (U 4f5/2 and U 4f7/2) and uranium satellite (U 4f5/2 and U 4f7/2) are listed in Table.1. At the initial state of the first ARXPS analysis recorded at 0° take off angle, the position of uranium metal (U 4f5/2 and U 4f7/2) and uranium oxide (U 4f5/2 and U 4f7/2) binding energies are in good agreement with those reported previously: 377.6 eV (U 4f7/2), 388.4 eV (U 4f5/2) and 380.3 eV (U 4f7/2), 391.2 eV (U 4f5/2) respectively [13, 16, 17, 18].. 46. chap 4.indd 46. 12/13/2009 12:46:27 AM.
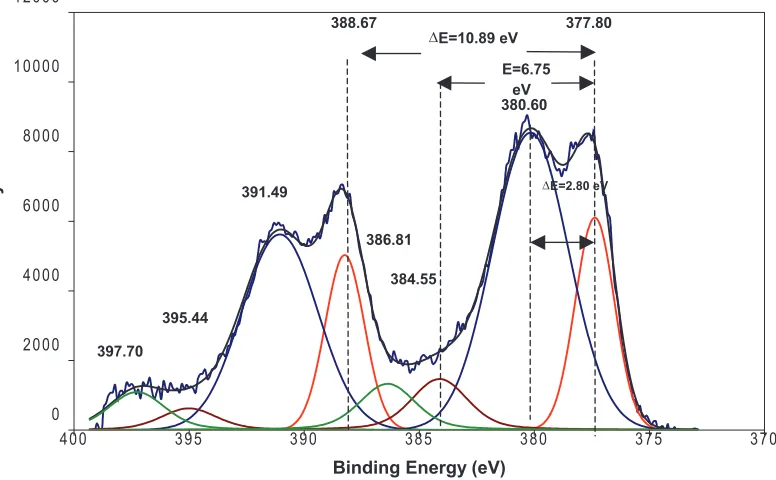
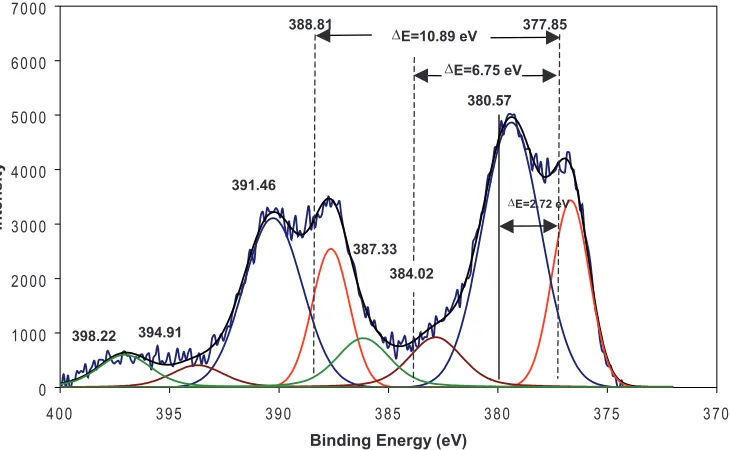
(5) Journal of Science and Technology UTHM. Table 1: The binding energy values of uranium metal, uranium oxide and the corresponding satellites for U 4f5/2 and U 4f7/2 photoelectron peaks [13, 16, 17, 18]. Photoelectron line. U 4f7/2 (eV). U 4f5/2 (eV). Uranium metal. 377.4 ± 0.1. 388.3 ± 0.1. Uranium dioxide (UO2.0). 380.9 ± 0.1. 391.7 ± 0.1. Satellite. 387.6 ± 0.1. 398.0 ± 0.1. The type of oxide layer formed by the UHV exposure during the ARXPS measurements can be identified from the separation between the U 4f7/2 photoelectron peak recorded from oxides and that recorded from U 4f7/2 photoelectron peak from the metal. The binding energy separation between these peaks at 0°, 15°, 30°, 45° and 60° take-off angles were recorded at range of 2.70 eV to 2.80 eV. All of these values indicated that the stoichiometry of uranium oxide species on the uranium metal between the initial state (0°) and the final state (60°) of ARXPS within 5025 sec was close to UO2 [14,17, 20]. The complexity of the oxide layer on niobium metal has been reported elsewhere [15, 21, 22, 23]. The formation of niobium oxides, Nb2O5 and NbOx, including niobium dioxide (NbO2) and niobium monoxide (NbO) on the clean metal surface merited special attention prior to ARXPS analysis. Binding energies of the Nb 3d5/2 peak for Nb2O5, NbO2, NbO and Nb metal have been recorded at 207.5 eV, 205.7 eV, 203.2 eV and 202.0 - 201.5 eV respectively [15, 20, 21, 23]. However, a low concentration of niobium on the uranium metal has lead to a weak niobium metal signal observed from the alloy due to the formation of a thick coating of Nb2O5 oxide on the surface as illustrated in Figure 3. The curve fits of the U-6Nb alloy narrow scan region at each take-off angle were carried out for the narrow scan regions of uranium, niobium and oxygen. The fitting of each window was involving a combination of Gaussian-Lorentzian and Shirley model. Each is represent a deconvolution of photoelectron peak and the background of the XPS spectrum. Here, the photoelectron line assigned for iteration was U 4f5/2, U 4f7/2, Nb 3d3/2, Nb 3d5/2 and O 1s. Example of uranium narrow scan curve fitting at 0°, 45° and 60° take-off angle are illustrated in Figures 4, 5 and 6. It was found that the binding energy shifts for uranium metal in the alloy were similar to those for the pure uranium metal [26]. Each peak shift varied from 2.80 eV to 2.70 eV as the take-off angle was changed from 0° to 60°. However, the gap between the uranium shake-up satellite peaks and the core metal level for U-6Nb was at 6.66 eV to 6.75 eV, which is close to the pure metal (6.3 eV – 6.65 eV) [14, 16, 26]. The change in the shake-up satellite energy may indicate some modification of the electronic structure of the oxide, resulting in slower oxygen transport through the oxide lattice [24]. Analysis of these spectra indicated that the oxidation of U-6Nb occurred more slowly than pure uranium metal. It was not possible to carry out curve fitting of the niobium spectra because the intensities were too low. However, from Figure 3, it is clearly seen that at 0° take-off angle there was an indication of the formation of NbOx and a significant chemical shift was observed between 15° to 60° indicating the formation of a mixture of NbOx and Nb2O5. From the intensity of the Nb 3d photoelectron line in Figure 3, it would 47. chap 4.indd 47. 12/13/2009 12:46:27 AM.
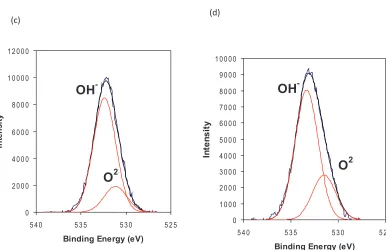
(6) Journal of Science and Technology UTHM. appear that niobium was also oxidised, as the signal was most pronounced at the 0° take-off angle. Thus it appeared NbOx was formed close to the metal surface. The development of a small shoulder to the higher binding energy side of the oxygen 1s peak was observed. This shoulder was characteristic of the hydroxyl ion, OH- on the sample surface. The presence of two main peaks (O2- and OH-) indicated that oxygen was present on the bare metal surface in two distinct forms [18]. The O 1s binding energy shifted to lower values as the surface was tilted from 0° to 60° but the hydroxyl ion binding energies shifted in the opposite direction. At 60°, the low intensity uranium U 4f photoelectron peak was covered by both a uranium oxide layer and hydroxyl species. This is evident from the total intensity of oxide and hydroxyl distribution at various take-off angles illustrated in Figure 7 (a-d). It is noteworthy that the binding energies for both the U 4f photoelectron and O 1s photoelectron peaks were always higher for water than oxygen absorption, a phenomenon also reported by Allen et al. and Nornes et al. [18, 20, 21]. Curve fits for the oxygen signal at 0°, 30°, 45° and 60° take-off angles as illustrated in Figures 7 (a-d) indicated that the take-off angle was changed from 0° to 60°, whereby the alteration of the O2- and OH- components was clearly demonstrated. The presence of O2- was most pronounced at 0° take-off angle, with a small contribution from the OH- signal. As the take-off angle increased from 15° to 60°, the O2- component became less intense and at 60° most of the signal came from OH-. The increase in the OH- was attributed to the capability of NbOx to absorb water vapour and may be taken as further indication of the presence of this oxide at the sample surface. The formation of this oxide, which evolved from NbO to Nb2O5, is responsible for the enhanced corrosion resistance of the alloy by slowing the diffusion of O2- or OH- toward the oxide-metal interface. This finding agrees with that obtained from the AES analyses reported in our pervious work [25]. From this point of view, it is clear when a clean uranium-niobium surface is exposed to oxidising species, the reaction with uranium leads to formation of a UO2 layer and subsequently niobium forms a NbOx sub-layer. On further oxidation the most stable form Nb2O5 is created. This oxide forms on the innermost surface and is capable of protecting the underlying metal substrate. The adsorption of H2O at the alloy surface may lead to decomposition of OH- releasing O2 and H2. Here, H2 may be desorbed and released into the UHV environment and O2 may diffuse into the oxide layer. The increase in the amount of oxygen upon longer exposures may lead to increased thickness of Nb2O5. A schematic diagram of the reaction is shown in Figure 8.. 4. conclusIons The interfacial surface chemistry in the initial stages of oxidation of U-6Nb alloy has been determined in this study. The following points summurise our findings. i). Under the exposure conditions considered in this study, the formation of the UO2 oxide on pure uranium and the formation of UO2 intermixed with NbOx+Nb2O5 on the U-6Nb have been confirmed by ARXPS analysis. 48. chap 4.indd 48. 12/13/2009 12:46:27 AM.
(7) Journal of Science and Technology UTHM. ii) An inner layer consisting of Nb2O5 is produced by the niobium doping of the uranium base metal. This layer does not only play a role as ‘oxygen diffusion barrier’ but also as an ‘absorbent’ of hydroxyl compound from water vapour. Evidence obtained from the narrow scan of the oxygen spectra for U-6Nb at low take-off angle (60°) indicates that during diffusion of O2- and OH- onto the alloy surface, most of these ionic species react with Nb to form a layer of Nb2O5, which increases in thickness on prolonged exposure. By this mechanism, the formation of a critical density of Nb2O5 at the metaloxide interface will increase the capability to absorb more oxygen and hydroxyl, thus enhancing the resistance of the alloy to oxidation and corrosion. iii) The observed changes in U 4f, Nb 3d and O 1s photoelectron spectra during the ARXPS analysis at low take-off angle (45° to 60°) indicate that the adsorption of oxygen on U-6Nb alloy top surface first leads to the formation of UO2 and NbO. Other oxides species including NbO2 and Nb2O5 are detected following prolonged UHV exposure, in agreement with results reported by other workers [16, 24].. acknowlEdgmEnt Zaidi Embong gratefully acknowledges the Ministry of Higher Education of Malaysia, the Malaysian Public Service Department and Universiti Tun Hussien Onn, Malaysia (UTHM) for providing financial support throughout the duration of his studies at the University of Bristol.. 5. rEfErEncEs 1. 2.. 3. 4.. 5.. J.F. Watts and J. Wolstenholme, An Introduction to Surface Analysis by XPS and AES. John Wiley and Sons, 2003. F. Verpoort, G. De Doncker, A.R. Bossuyt, L. Fiermans and L.Verdonck, AngleResolved and Depth Profiling XPS Investigation of a Monolayer Niobium Oxide Catalyst. Journal of Electron Spectroscopy and Related Phenomena, 1995. 73(3): p. 271-281. K.N. Piyakis, D.-Q. Yang and E. Sacher, The Applicability of Angle-Resolved XPS to the Characterization of Clusters on Surfaces. Surface Science, 2003. 536(1-3): p. 139144. L.P.H. Jeurgens, M.S. Vinodh and E.J. Mittemeijer, Quantitative Analysis of Multi-Element Oxide Thin Films by Angle-Resolved XPS: Application to UltraThin Oxide Films on MgAl Substrates. Applied Surface Science, 2006. 253(2): p. 627-638. M. Zier, S. Oswald, R. Reiche and K. Wetzig, XPS and ARXPS Investigations of Ultra Thin Films Deposited On SiO2 and Si. Applied Surface Science. 13th Applied Surface Analysis Workshop - AOFA 13, 2005. 252(1): p. 234-239. 49. chap 4.indd 49. 12/13/2009 12:46:27 AM.
(8) Journal of Science and Technology UTHM. 6. 7. 8. 9.. 10. 11.. 12. 13. 14. 15. 16.. 17. 18. 19.. P.J. Cumpson, Angle-Resolved XPS and AES: Depth-Resolution Limits and a General Comparison of Properties of Depth-Profile Reconstruction Methods. Journal of Electron Spectroscopy and Related Phenomena, 1995. 73(1): p. 25-52. P.J. Cumpson, Angle-Resolved XPS Depth-Profiling Strategies. Applied Surface Science, 1999. 144-145: p. 16-20. P. Mack, R.G. White, J. Wolstenholme and T. Conard, The Use of Angle Resolved XPS to Measure the Fractional Coverage of High-K Dielectric Materials on Silicon and Silicon Dioxide Surfaces. Applied Surface Science, 2006. 252(23): p. 8270-8276. S. Shinagawa, H. Nohira, T. Ikuta, M. Hori, M. Kase and T. Hattori, Angle-Resolved XPS Study on Chemical Bonds in Ultrathin Silicon Oxynitride Films. Microelectronic Engineering 14th biennial Conference on Insulating Films on Semiconductors, 2005. 80: p. 98-101. S. Ye, G. Li, K. Noda, K. Uosaki and M. Osawa, Characterization of Self-Assembled Monolayers of Alkanethiol on GaAs Surface by Contact Angle and Angle-Resolved XPS Measurements. Surface Science, 2003. 529(1-2): p. 163-170. T. Hattori, K. Azuma, Y. Nakata, H. Nohira, H. Okamoto, E. Ikenaga, K. Kobayashi, Y. Takata and S. Shin, Angle-Resolved XPS Studies on Transition Layers at SiO2/Si Interfaces. Journal of Electron Spectroscopy and Related Phenomena Proceeding of the Fourteenth International Conference on Vacuum Ultraviolet Radiation Physics, 2005. 144-147: p. 457-460. Z. Bastl and S. Pick, Angle Resolved X-Ray Photoelectron Spectroscopy Study of Au Deposited on Pt and Re Surfaces. Surface Science Proceedings of the 22nd European Conference on Surface Science, 2004. 566-568(Part 2): p. 832-836. G.C. Allen, An Angle Resolved X-Ray Photoelectron Spectroscopic Study of AirOxidized UO2 Pellet Surfaces. Philosophical Magazine B, 1985. 51: p. 465-473. G.C. Allen, J.A. Crofts, M.T Curtis and P.M. Tucker, X-Ray Photoelectron Spectroscopy of some Uranium Oxide Phases. Journal Society Chemistry Dalton, 1974: p. 12961301. M. Grundner and J. Halbritter, XPS and AES Studies on Oxide Growth and Oxide Coating on Niobium. Journal of Applied Physics, 1980. 51(1). W.L. Manner, J.A. Lloyd, R.J. Hanrahan and M.T. Paffett, An Examination of the Initial Oxidation of a Uranium-Base Alloy (U-14.1 at.% Nb) by O2 and D2O Using Surface-Sensitive Techniques. Applied Surface Science, 1999. 150(1-4): p. 73-88. G.C. Allen and P.M. Tucker, Surface oxidation of uranium metal as studied by X-ray Photoelectron Spectroscopy. Journal of the Chemical Society Dalton, 1973: p. 470-474. G.C. Allen, P.M. Tucker and R.A. Lewis, X-Ray Photoelectron Spectroscopy Study of Initial Oxidation of Uranium Metal in Oxygen + Water-Vapour Mixtures. Journal of the Chemical Society, Faraday Trans, 1984. 80(2): p. 991-1000. J.J. Pireaux, J. Riga, E.C. Thibaut, C. Tenret-Noel, R. Caudano and J.J. Verbist, ShakeUp Satellites in the X-Ray Photoelectron Spectra of Uranium Oxides and Fluorides. A Band Structure Scheme for Uranium Dioxide, UO2. Chemical Physics, 1977. 22(1): p. 113-120. 50. chap 4.indd 50. 12/13/2009 12:46:27 AM.
(9) Journal of Science and Technology UTHM. 20. S.B. Nornes and R.G. Meisenheimer, X-Ray Photoelectron Spectroscopy Study of the Chemisorption on Water on Uranium and Thorium and Oxygen on Uranium. Surface Science, 1979. 88: p. 191-203. 21. I. Arfaoui, C. Guillot, J. Cousty and C. Antoine, Evidence for a Large Enrichment of Interstitial Oxygen Atoms in the Nanometer-Thick Metal Layer at the NbO/Nb (110) Interface. Journal of Applied Physics, 2002. 11: p. 9319-9323. 22. E.Z. Kurmaev, A. Moewes, O.G. Bureev, I.A. Nekrasov, V.M. Cherkashenko, M. A. Korotin and D. L. Ederer, Electronic Structure of Niobium Oxides. Journal of Alloys and Compounds, 2002. 347(1-2): p. 213-218. 23. A. Dacca, G. Gemme, L. Mattera and R. Parodi, XPS Analysis of the Surface Composition of Niobium for Superconducting RF Cavities. Applied Surface Science, 1998. 126(3-4): p. 219-230. 24. X. Fu, K. Liu, X. Wang, Z. Zhao and Y. Fu, X-ray Photoelectron Spectroscopic Study of the Surface Reaction of Uranium-Niobium Alloy with O2. Surface Review and Letters, 2003. 10: p. 381-386. 25. C.M. Younes, G.C. Allen and Z. Embong, Auger Electron Spectroscopic Study of the Surface Oxidation of Uranium-Niobium Alloy {U-6 wt.% Nb} in a UHV Environment Containing Primarily H2, H2O and CO. Surface Science, 2007. 601(15): p. 32073214. 26. Zaidi Embong, A Spectroscopic Study of the Oxidation of Uranium and its Alloy U6%Nb, PhD Thesis, University of Bristol, 2007. U 4f. U 4f. 5/2. 7/2. Intensity (arb. unit). 0°. 15° 30° 45° 60°. 395. 390. 385. 380. 375. 370. Binding Energy (eV). Figure 1: A series of ARXPS uranium 4f5/2 and 4f7/2 photoelectron peaks on the U 6Nb surface.. 51. chap 4.indd 51. 12/13/2009 12:46:28 AM.
(10) Journal of Science and Technology UTHM. O 1s. Intensity (arb. unit). 0° 15° 30° 45° 60°. 541. 536. 531. 526. Binding Energy (eV). Figure 2: A series of ARXPS O 1s photoelectron peaks region on the U-6Nb alloy surface.. Nb 3d3/2. Nb 3d5/2. Intensity (arb. unit). 0° 15° 30° 45° 60°. 213. 211. 209. 207. 205. 203. 201. 199. Binding Energy (eV). Figure 3: A series of ARXPS Nb 3d3/2 and Nb 3d5/2 photoelectron peaks on the U 6Nb surface.. 52. chap 4.indd 52. 12/13/2009 12:46:28 AM.
(11) Journal of Science and Technology UTHM. 30000 388.53 25000. ∆E=6.66. 20000. Intensity. 377.64. ∆E=10.89 eV. 380.44. 15000. ∆E=2.80. 391.33 386.79 384.3. 10000 395.2. 5000. 397.6. 0 400. 395. 390. 385. 380. 375. 370. Binding Energy (eV). Figure 4: Curve fitting of uranium 4f5/2 and 4f7/2 peaks for the U-6Nb surface at 0° take-off angle. 12000 388.67. 377.80. ∆E=10.89 eV. 10000. E=6.75 eV 380.60. Intensity. 8000 ∆E=2.80 eV. 391.49. 6000. 386.81. 4000. 384.55 395.44. 2000. 397.70. 0 400. 395. 390. 385. 380. 375. 370. Binding Energy (eV). Figure 5: Curve fitting of uranium 4f5/2 and 4f7/2 peaks for the U-6Nb surface at 45° take-off angle.. 53. chap 4.indd 53. 12/13/2009 12:46:28 AM.
(12) Journal of Science and Technology UTHM. 7000. 388.81. 6000. ∆E=6.75 eV 380.57. 5000. Intensity. 377.85. ∆E=10.89 eV. 4000. 391.46. ∆E=2.72 eV. 3000 387.33 384.02. 2000 1000. 394.91. 398.22. 0 400. 395. 390. 385. 380. 375. 370. Binding Energy (eV). Figure 6: Curve fitting of uranium 4f5/2 and 4f7/2 peaks for the U-6Nb surface at 60° take-off angle.. (a). (b). 3000. 7000. O. 2500. 26000 5000. Intensity. Intensity. 2000 1500. -. OH. 1000. 4000. -. OH. O. 3000. 2-. 2000. 500. 1000. 0. 536. 534. 532. 530. 528. 526. 0 540. Binding Energy (eV). 535. 530. 525. Binding Energy (eV). (d). (c). 54. 12000 10000. chap 4.indd 54. 8000. -. OH. 10000 9000 8000 7000. -. OH. 12/13/2009 12:46:28 AM.
(13) Intensity. Intensit. 1500. -. OH. 1000. OH. 4000. O. 3000. 2-. 2000. 500. 1000. 0. 536. 534. 532. 530 528 526 0 Journal of Science and Technology UTHM 540 Binding Energy (eV). 535. 530. 525. Binding Energy (eV). (d). (c) 12000. 10000. 10000. 9000. -. OH. 8000. 7000. Intensity. Intensity. -. OH. 8000. 6000 4000. O. 2000. 6000 5000 4000. O. 3000. 2-. 2-. 2000 1000. 0 540. 535. 530. 0. 525. 540. Binding Energy (eV). 535. 530. 525. Binding Energy (eV). Figure 7: A series of oxygen 1s narrow scan curve fits for an oxide, O2-, and hydroxide, OH-, component on U-6Nb surface at the take-off angles (a) 0°, (b) 30°, (c) 45° and (d) 60°.. Water vapour O2- + OH-. H2 O2UO2. O2UO2 NbOx. NbO2 Nb2O5 U-6Nb. U-6Nb. Figure 8: A schematic diagram of the formation of oxide layers on the U-6Nb alloy surface.. 55. chap 4.indd 55. 12/13/2009 12:46:28 AM.
(14) Journal of Science and Technology UTHM. 56. chap 4.indd 56. 12/13/2009 12:46:28 AM.
(15)
Figure
![Table 1: The binding energy values of uranium metal, uranium oxide and the corresponding satellites for U 4f5/2 and U 4f7/2 photoelectron peaks [13, 16, 17, 18].](https://thumb-us.123doks.com/thumbv2/123dok_us/8781102.904266/5.612.104.501.170.240/table-binding-values-uranium-uranium-corresponding-satellites-photoelectron.webp)

+3
Related documents
Here data will be converted into binary which will be plain text and converted into cipher text to hide data. Here steganography is used to encrypt so as to hide
Twenty-five percent of our respondents listed unilateral hearing loss as an indication for BAHA im- plantation, and only 17% routinely offered this treatment to children with
Similar to spine patients, fixation performed within 36 h of injury was associated with fewer compli- cations in patients treated for fractures of the pelvis, acetabulum, and/or
At present, legislation in Britain gives employees various rights which enable them to challenge managerial decisions to terminate the employment relationship, or to make the loss of
ings were observed in the renal tissue of the Cis group with significantly increased levels of oxidants and IL-1β, such as wide hemorrhage areas, dilated and congested blood
Anti-inflammatory effects of the preparation were studied according to the below methods: S.Salamon– burn induced inflammation of the skin, caused by hot water (80 0 C) in white
fections predispose smokers to emphysema. Unless an ass ociated bronchitis is present, cough and sputum production do not occur. Physical ex- amination reveals a thin,
Experiments were designed with different ecological conditions like prey density, volume of water, container shape, presence of vegetation, predator density and time of
