© 2016, IRJET | Impact Factor value: 4.45 | ISO 9001:2008 Certified Journal | Page 1
Stability Analysis of Multi-story building with underneath Satellite Bus
Stand having intermediate soft-story and Floating columns
Maheshraddy
1, Prof. Vishwanath. B. Patil
21
MTech Structural Engg. Student,
2Associate Professor
1,2
Department of Civil Engineering
PoojyaDoddappaAppa College of Engineering Kalaburagi-585102
Abstract -
The masonry infill walls are considered as non-structural element and their stiffness contribution are ignored in the analysis when building is subjected to seismic loads, but it is considered while we studying stability analysis. RC frame building with open ground story, and similar soft story effect can be observed when soft story at different levels of structure are constructed. The method used for stability analysis of columns, shear walls, coupled and coupled components, cores, single story and multi-story structures are studying. Buildings and structures are considering stable with lateral supports by using either bracing systems or shear system or both such as wall to ensure the stability of the building. One of the problems is affected from wind load. The calculation methods are computer assisted through the use of the software, ETAB. Comparisons of results are made between the methodologies, and different models with different parameters. This is how the soft story effects are managed to overcome the future damages of the storied structures.Key words: Satellite Bus Stop, Soft-Story, Non-Linear Time History Analysis, P-Delta, Floating Columns.
1. INTRODUCTION
Satellite bus stop is the new term that has come in the recent years in cities like Bengaluru because, due to increasing population and the land value since the past few years’ bus stands in populated cities is a matter of major problem. So that constructions of multi-Storyed buildings with open first story. Hence it has been utilizing for the
moment of the buses and people can use this as bus terminals. These type of buildings having no infill walls in ground story, but all upper storys infilled with masonry walls. Soft stories at different levels of structure are constructed for other purposes like lobbies conference halls and for the service storys. This story is known as weak story because story stiffness is lower compare to above storys. So, importance to be given for the earthquake resistant design.
2. DESCRIPTION OF STRUCTURAL MODEL
2.1 Geometry
For the study, four different models of a 12 story building are considered. The building has four bays in X direction with spacing of 11m and seven bays in Y direction with spacing of 7m. The plan dimension 44 m × 49 m. Typical story height is 3.65 m for each floor up to intermediate soft story their after that 3.2 m for remaining storys and bottom soft-story and intermediate soft-storys are of height 7m and 3m respectively. Floating columns are used after intermediate soft story as shown in figure below. This geometry remains same throughout the study. The only influencing factor is change in the models and parameters, dimensions remains same. The column size decreases from Bottom to Top.
Column size
From Story 1 to Story 6 1.5m x 0.6m
Story 7 to Story 10 1.2m x 0.8m
Story 11 to Story 15 0.8m x 0.4m
Floating columns 0.8m x 0.4m
Beam size
From story 1to story7 0.4m x 0.8 m
Story 7th in X direction 1m x 1m
Slab thickness
Story 1 to 7 0.150m
Story 8 to 12 0.125m
Following 2 models are analyzed by equivalent static method, response spectrum method and Non-Linear Time History analysis using ETABS software.
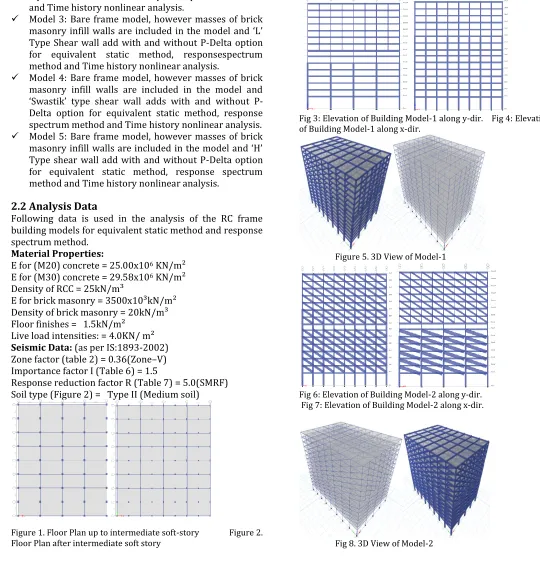
Model 1: Bare frame model, however masses of brick masonry infill walls are included in the model with and without P-Delta option for equivalent static method, response spectrum method and Time history nonlinear analysis.
© 2016, IRJET | Impact Factor value: 4.45 | ISO 9001:2008 Certified Journal | Page 2
equivalent static method, response spectrum method and Time history nonlinear analysis.
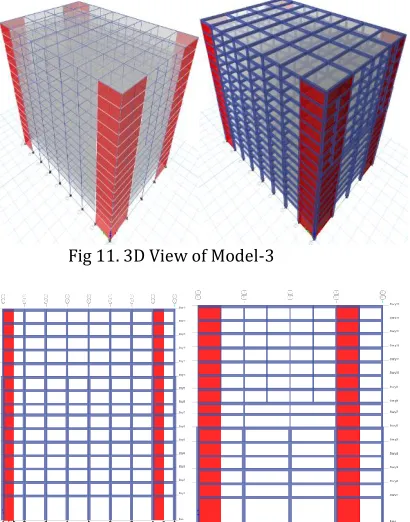
Model 3: Bare frame model, however masses of brick masonry infill walls are included in the model and ‘L’ Type Shear wall add with and without P-Delta option for equivalent static method, responsespectrum method and Time history nonlinear analysis.
Model 4: Bare frame model, however masses of brick masonry infill walls are included in the model and ‘Swastik’ type shear wall adds with and without P-Delta option for equivalent static method, response spectrum method and Time history nonlinear analysis.
Model 5: Bare frame model, however masses of brick masonry infill walls are included in the model and ‘H’ Type shear wall add with and without P-Delta option for equivalent static method, response spectrum method and Time history nonlinear analysis.
2.2 Analysis Data
Following data is used in the analysis of the RC frame building models for equivalent static method and response spectrum method.
Material Properties:
E for (M20) concrete = 25.00x10⁶ KN/m²
E for (M30) concrete = 29.58x10⁶ KN/m²
Density of RCC = 25kN/m³
E for brick masonry = 3500x10³kN/m² Density of brick masonry = 20kN/m³ Floor finishes = 1.5kN/m²
Live load intensities: = 4.0KN/ m²
Seismic Data: (as per IS:1893-2002) Zone factor (table 2) = 0.36(Zone–V) Importance factor I (Table 6) = 1.5
[image:2.612.316.565.103.537.2]Response reduction factor R (Table 7) = 5.0(SMRF) Soil type (Figure 2) = Type II (Medium soil)
Figure 1. Floor Plan up to intermediate soft-story Figure 2.
Floor Plan after intermediate soft story
Fig 3: Elevation of Building Model-1 along y-dir. Fig 4: Elevation of Building Model-1 along x-dir.
Figure 5. 3D View of Model-1
Fig 6: Elevation of Building Model-2 along y-dir. Fig 7: Elevation of Building Model-2 along x-dir.
[image:2.612.25.565.111.673.2]© 2016, IRJET | Impact Factor value: 4.45 | ISO 9001:2008 Certified Journal | Page 3
Fig 9: Elevation of Building Model-3 along y-dir. [image:3.612.35.574.49.626.2]Fig 10: Elevation of Building Model-3 along x-dir.
Fig 11. 3D View of Model-3
Fig 12: Elevation of Building Model-4 along x-dir. Fig 13: Elevation of Building Model-4 along y-dir.
Fig 14. 3D View of Model-4
Fig 15: Elevation of Building Model-5 along y-dir. Fig 16: Elevation of Building Model-5 along x-dir.
Fig 17. 3D View of Model-5
3. RESULTS AND DISCUSSIONS
Most of the past studies on different buildings such symmetrical and unsymmetrical have adopted idealized structural systems without considering the effect of concrete shear and core walls. Although these systems are sufficient to understand the general behaviour and dynamic characteristics, it would be interesting to know how real building will respond to Earthquake forces and Wind forces. For this reason, a hypothetical building, located on a plane ground having similar ground floor plan have been taken as structural systems for the study.
In this chapter, the results of natural period of vibration, base shear, lateral displacements, story drifts of different building models are presented and compared. An effort has been made to study the effect of shear wall both at Centre and corners on exterior side in longitudinal & transverse direction respectively.
3.1 Fundamental Natural Time Period
[image:3.612.38.243.266.527.2]© 2016, IRJET | Impact Factor value: 4.45 | ISO 9001:2008 Certified Journal | Page 4
5.45% as compared to model-1 without P-delta. Similarly, for model-2, 3, 4, and 5 are 2.47%, 1.03%, 0.725 and 0.88% respectively. From that it can be clear that the presence of p-delta in the building will increases the time period and decreases the frequency of the structure. Thus it can be clearly understanding that, presence of brick infill wall stiffness and shear wall considerably reduces the time period of building.
PERIOD IN SEC FREQUENCY IN
CYC/SEC
MODEL Without
P-Delta With
P-Delta
Without
P-Delta With
P-Delta
1 3.266 3.444 0.306 0.290
2 1.257 1.288 0.796 0.776
3 1.645 1.662 0.608 0.602
4 1.537 1.548 0.651 0.646
[image:4.612.36.278.535.675.2]5 1.484 1.497 0.674 0.668
Table 3.1: Fundamental natural time period and Frequency using ETABS software for various models.
Chart 3.1.2: Model Vs Time period for Different models without and with P-delta.
Chart 3.1.2: Model Vs frequency for Different models without and with P-delta.
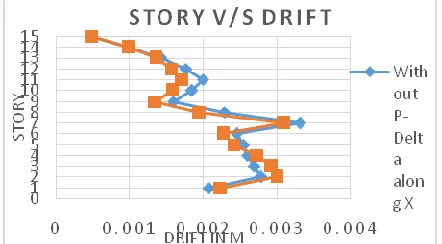
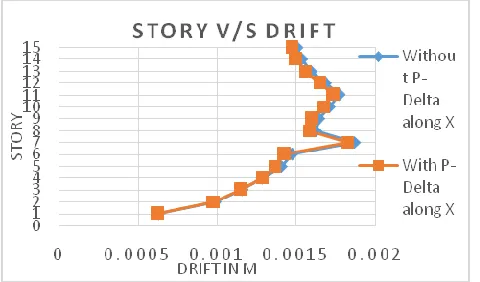
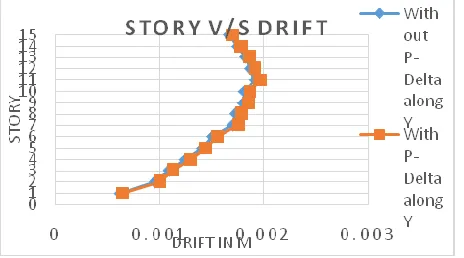
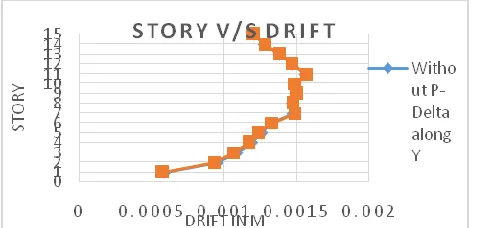
3.2 Story Drifts
The permissible story drift according to IS1893(part1)-2002 is limited to 0.004 times the story height. The maximum story drifts for various building models along longitudinal and transverse direction obtained from Non-linear time history analysis from ETABS are shown in tables below, from the table 3.2.1 to 3.2.5 and chart 3.2.1 to 3.2.10. From that it can be seen that the story drift in all story for model-1 has higher values as compare to other models. The drift values gradually decrease from story 1 to 15thstory in both directions. All the values of drift are
within the limit as per IS:1893-2002 i.e., 0.004x3.5=0.014m, 0.004x3=0.012m and 0.004x7=0.028m.
Story No
Without P-Delta along X
With P-Delta along X
Without P-Delta along Y
With P-Delta along Y
1 0.002079 0.002235 0.002257 0.002178 2 0.002785 0.002998 0.003316 0.003170 3 0.002693 0.002931 0.003270 0.003163 4 0.002594 0.002735 0.003062 0.003081 5 0.002549 0.002413 0.002919 0.002918 6 0.002453 0.002270 0.002727 0.002775 7 0.003313 0.003099 0.002822 0.003080 8 0.002287 0.001945 0.002867 0.003066 9 0.001589 0.001347 0.003098 0.003226 10 0.001845 0.001574 0.003254 0.003335 11 0.001992 0.001709 0.003723 0.003789 12 0.001761 0.001563 0.003498 0.003527 13 0.001415 0.001355 0.002968 0.002959 14 0.000970 0.000971 0.002189 0.002163 15 0.000479 0.000480 0.001366 0.001340 Table 3.2.1: Comparison of Story Drifts for with and without P-Delta Non-Linear Time History analysis of Model-1 in x and y-direction.
[image:4.612.323.544.571.693.2]© 2016, IRJET | Impact Factor value: 4.45 | ISO 9001:2008 Certified Journal | Page 5
Chart 3.2.2: Story drift Vs Story for model-1 along Y-direction byTHNA with and without P-delta.
Story No
Without P-Delta along X
With P-Delta along X
Without P-Delta along Y
With P-Delta along Y
1 0.008407 0.008102 0.006174 0.006152 2 0.000627 0.000545 0.000691 0.000692 3 0.000426 0.000369 0.000368 0.000364 4 0.000403 0.000358 0.000348 0.000346 5 0.000392 0.000374 0.000311 0.000312
6 0.000409 0.000387 0.00031 0.000305
7 0.000423 0.000416 0.000341 0.000345 8 0.006916 0.006683 0.002136 0.002099 9 0.000302 0.000300 0.000436 0.000431 10 0.000291 0.000288 0.000318 0.000315 11 0.000287 0.000284 0.000295 0.000296 12 0.000277 0.000274 0.000265 0.000266 13 0.000268 0.000266 0.000247 0.000248 14 0.000262 0.000259 0.000233 0.000233 15 0.000258 0.000255 0.000228 0.000227 Table 3.2.2: Comparison of Story Drifts for with and without P-Delta Non-Linear Time History analysis of Model-2 in x and y-direction.
Chart 3.2.3: Story drift Vs Story for model-2 along X-direction by THNA with and without P-delta.
Chart 3.2.4: Story drift Vs Story for model-2 along Y-direction by THNA with and without P-delta.
Chart 3.2.5: Story drift Vs Story for model-3 along X-direction by THNA with and without P-delta.
Story No
Without P-Delta along X
With P-Delta along X
Without P-Delta along Y
With P-Delta along Y
1 0.000633 0.000626 0.000730 0.000732
2 0.000988 0.000980 0.001157 0.001160
3 0.00116 0.001155 0.001273 0.001269
4 0.001289 0.001286 0.001363 0.001392
5 0.001406 0.001363 0.001536 0.001572
6 0.001472 0.001429 0.001670 0.001710
7 0.001871 0.001825 0.001842 0.001889
8 0.001626 0.001583 0.001872 0.001920
9 0.001644 0.001603 0.001923 0.001972
10 0.00171 0.001672 0.001952 0.002002
11 0.001774 0.001736 0.002039 0.002090
12 0.001687 0.001650 0.001943 0.001992
13 0.001595 0.001559 0.001849 0.001896
14 0.001536 0.001501 0.001762 0.001805
[image:5.612.324.564.288.429.2]© 2016, IRJET | Impact Factor value: 4.45 | ISO 9001:2008 Certified Journal | Page 6
Table 3.2.3: Comparison of Story Drifts for with and withoutP-Delta Non-Linear Time History analysis of Model-3 in x and y-direction.
Story No
Without P-Delta along X
With P-Delta along X
Without P-Delta along Y
With P-Delta along Y
1 0.000907 0.000871 0.000625 0.000640 2 0.001435 0.001433 0.000953 0.000998 3 0.001658 0.001665 0.001094 0.001129 4 0.001841 0.001852 0.001254 0.001294 5 0.001993 0.002009 0.001403 0.001447 6 0.002092 0.002113 0.001507 0.001554 7 0.002300 0.002329 0.001703 0.001755 8 0.002234 0.002262 0.001729 0.001781 9 0.002226 0.002257 0.001808 0.001860 10 0.002248 0.002282 0.001817 0.001868 11 0.002241 0.002277 0.001918 0.001971 12 0.002173 0.002207 0.001865 0.001914 13 0.002098 0.002130 0.001822 0.001869 14 0.002027 0.002057 0.001744 0.001789 15 0.001978 0.002006 0.001661 0.001703 Table 3.2.4: Comparison of Story Drifts for with and without P-Delta Non-Linear Time History analysis of Model-4 in x and y-direction.
Story No
Without P-Delta along X
With P-Delta along X
Without P-Delta along Y
With P-Delta along Y
1 0.000713 0.000708 0.000589 0.000575
2 0.001161 0.001165 0.000951 0.000931
3 0.001385 0.001395 0.001085 0.001064
4 0.001581 0.001597 0.001190 0.001169
5 0.001721 0.001742 0.001258 0.001236
6 0.001804 0.001827 0.001326 0.001333
7 0.002137 0.002174 0.001479 0.001487
8 0.001944 0.001977 0.001469 0.001474
9 0.001998 0.001996 0.001501 0.001505
10 0.002093 0.002030 0.001489 0.001490
11 0.002180 0.002119 0.001564 0.001566
12 0.002157 0.002099 0.001467 0.001467
13 0.002130 0.002075 0.001383 0.001382
14 0.002046 0.001992 0.00128 0.001281
[image:6.612.30.260.137.362.2]15 0.002031 0.001977 0.001206 0.001207
Table 3.1.5: Comparison of Story Drifts for with and without P-Delta Non-Linear Time History analysis of Model-5 in x and y direction.
Chart 3.2.6: Story drift Vs Story for model-3 along Y-direction by THNA with and without P-delta.
Chart 3.2.7: Story drift Vs Story for model-4 along X-direction by THNA with and without P-delta.
Chart 3.2.8: Story drift Vs Story for model-4 along Y-direction by
[image:6.612.323.558.268.382.2] [image:6.612.325.557.425.554.2]P-© 2016, IRJET | Impact Factor value: 4.45 | ISO 9001:2008 Certified Journal | Page 7
delta.Chart 3.2.9: Story drift Vs Story for model-5 along X-direction by THNA with and without P-delta.
Chart 3.2.10: Story drift Vs Story for model-5 along Y-direction by THNA with and without P-delta.
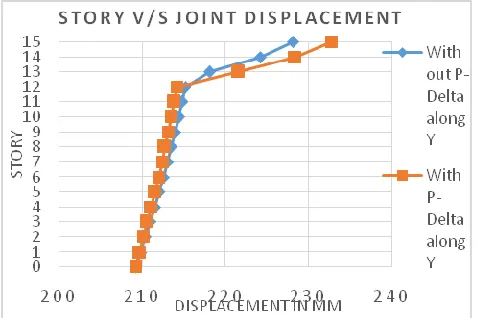
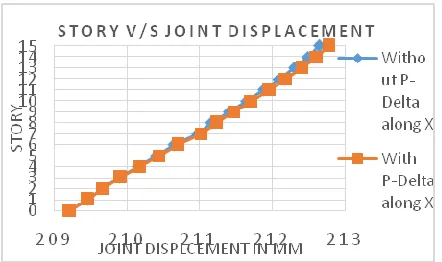
3.3 Story Displacements
The maximum displacement at each story with respective to ground level are presented in tables obtained from Non-Linear Time history analysis for different models. To understand in a better way, the displacements for each model along the longitudinal direction and transverse direction are plotted in charts below. Table 3.3.1 to 3.3.5 and chart 3.3.1 to 3.3.10 shows all Model story displacements. The bare frame model-1 has highest story displacement values as compared to model-2.
Story No
Without P-Delta along X
With P-Delta along X
Without P-Delta along Y
With P-Delta along Y
0 209.208 209.208 209.208 209.208
1 211.299 210.505 209.809 209.701
2 213.074 212.04 210.346 210.132
3 214.846 213.667 210.916 210.606
4 216.568 215.255 211.481 211.079
5 218.209 216.752 212.029 211.536
6 219.773 218.161 212.557 211.973
7 221.785 219.941 213.077 212.399
8 222.715 220.714 213.464 212.714
9 223.346 221.183 213.916 213.087
10 224.002 221.641 214.350 213.450
11 224.65 222.064 214.807 213.835
12 225.186 222.387 215.207 214.169
13 225.597 222.621 218.062 221.600
14 225.872 222.772 224.179 228.414
15 226.011 222.851 228.136 232.740
Table 3.3.1: Comparison of Story Displacement for with and without P-Delta Non-Linear Time History analysis of Model-1 in x and y-direction.
Story No
Without P-Delta along X
With P-Delta along X
Without P-Delta along Y
With P-Delta along Y
0 209.208 209.208 209.208 209.208
1 210.424 210.477 209.349 209.349
2 210.447 210.5 209.355 209.356
3 210.474 210.527 209.359 209.361
4 210.5 210.553 209.364 209.367
5 210.525 210.578 209.369 209.372
6 210.55 210.603 209.374 209.378
7 210.576 210.628 209.38 209.384
8 211.137 211.206 209.433 209.435
9 211.161 211.231 209.44 209.442
10 211.184 211.254 209.447 209.449
11 211.209 211.279 209.453 209.455
12 211.233 211.303 209.459 209.461
13 211.258 211.328 209.465 209.467
14 211.282 211.352 209.471 209.473
15 211.306 211.376 209.477 209.478
Table 3.3.2: Comparison of Story Displacement for with and
without P-Delta Non-Linear Time History analysis of Model-2 in
x and y-direction.
[image:7.612.36.274.113.239.2] [image:7.612.36.275.282.396.2]© 2016, IRJET | Impact Factor value: 4.45 | ISO 9001:2008 Certified Journal | Page 8
Chart 3.3.1: Story Displacement Vs Story for model-1 along X-direction by THNA with and without P-delta.
Chart 3.3.2: Story Displacement Vs Story for model-1 along Y-direction by THNA with and without P-delta.
Chart 3.3.3: Story Displacement Vs Story for model-2 along X-direction by THNA with and without P-delta.
Chart 3.3.4: Story Displacement Vs Story for model-2 along Y-direction by THNA with and without P-delta.
Story No
Without P-Delta along X
With P-Delta along X
Without P-Delta along Y
With P-Delta along Y
1 209.458 209.462 209.298 209.311
2 209.661 209.672 209.426 209.454
3 209.89 209.909 209.573 209.618
4 210.14 210.166 209.727 209.792
5 210.399 210.434 209.881 209.969
6 210.651 210.694 210.03 210.141
7 210.959 211.013 210.174 210.311
8 211.164 211.225 210.278 210.435
9 211.394 211.461 210.395 210.579
10 211.633 211.709 210.5 210.709
11 211.868 211.955 210.598 210.834
12 212.087 212.183 210.686 210.944
13 212.293 212.401 210.78 211.048
14 212.485 212.606 210.894 211.159
15 212.639 212.771 211.007 211.271
Table 3.3.3: Comparison of Story Displacement for with and without P-Delta Non-Linear Time History analysis of Model-3 in x and y-direction.
Story No
Without P-Delta along X in mm
With P-Delta along X
Without P-Delta along Y in mm
With P-Delta along Y
1 209.352 209.351 209.34 209.335
2 209.469 209.47 209.467 209.46
3 209.603 209.607 209.606 209.596
4 209.751 209.758 209.749 209.735
5 209.91 209.92 209.888 209.871
[image:8.612.36.277.275.434.2]© 2016, IRJET | Impact Factor value: 4.45 | ISO 9001:2008 Certified Journal | Page 9
7 210.27 210.285 210.152 210.122
8 210.417 210.434 210.253 210.215
9 210.594 210.613 210.386 210.335
10 210.786 210.807 210.542 210.474
11 210.982 211.006 210.747 210.662
12 211.173 211.2 210.968 210.87
13 211.357 211.387 211.191 211.083
14 211.532 211.565 211.404 211.288
15 211.676 211.712 211.589 211.465
Table 3.3.4: Comparison of Story Displacement for with and without P-Delta Non-Linear Time History analysis of Model-4 in x and y-direction.
Story No
Without P-Delta along X
With P-Delta along X
Without P-Delta along Y
With P-Delta along Y
1 209.329 209.329 209.426 209.401
2 209.438 209.439 209.627 209.586
3 209.572 209.572 209.845 209.784
4 209.724 209.724 210.067 209.986
5 209.890 209.889 210.287 210.185
6 210.058 210.057 210.500 210.376
7 210.264 210.262 210.713 210.565
8 210.418 210.413 210.872 210.708
9 210.600 210.595 211.067 210.884
10 210.796 210.788 211.257 211.062
11 210.995 210.985 211.466 211.264
12 211.189 211.176 211.678 211.473
13 211.378 211.363 211.892 211.685
14 211.561 211.544 212.100 211.889
15 211.717 211.698 212.277 212.062
Table 3.3.5: Comparison of Story Displacement for with and without P-Delta Non-Linear Time History analysis of Model-5 in x and y-direction.
Chart 3.3.5: Story Displacement Vs Story for model-3 along X-direction by THNA with and without P-delta.
Chart 3.3.6: Story Displacement Vs Story for model-3 along
X-direction by THNA with and without
P-delta.
Chart 3.3.7: Story Displacement Vs Story for model-4 along
X-direction by THNA with and without
P-delta.
Chart 3.3.8: Story Displacement Vs Story for model-4 along
[image:9.612.32.246.254.500.2] [image:9.612.36.257.545.676.2]P-© 2016, IRJET | Impact Factor value: 4.45 | ISO 9001:2008 Certified Journal | Page 10
delta.Chart 3.3.9: Story Displacement Vs Story for model-5 along X-direction by THNA with and without P-delta.
Thus it can be concluded that concrete shear wall act as drift and displacement controlled elements in RC buildings. Therefore, it can be concluded that as far as tall buildings are concerned, different types of Shear walls can be a good solution to minimize the effect of soft stories. And use of P-delta in the model is effects more for displacement values (refer tables and charts).
Chart 3.3.10: Story Displacement Vs Story for model-5 along Y-direction by THNA with and without P-delta.
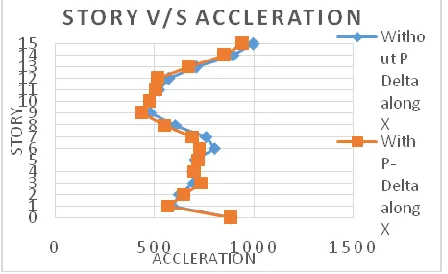
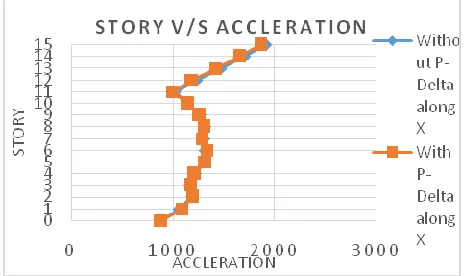
3.4 Story Acceleration
The maximum acceleration at each floor level with respect to ground are presented in tables from 3.4.1 to 3.4.5 obtained from Non-Linear Time History Analysis along x-direction and y-x-direction. The acceleration value is lower for the bare frame model as compare to the other models. When masonry infill stiffness taken into consideration, Model-2 (full brick infill) shows considerable increase in story acceleration than model-1. It is observed that, the model with shear wall yields comparatively greater story acceleration which is represented in chart 3.4.1 to 3.4.10.
Hence it can be concluded that by providing shear walls at corners in X and Y direction significantly increases the story acceleration in the storys. ‘L’ type shear wall reduces the story acceleration compared to all other models. Andconsideration of P-delta will reduce the acceleration values in all the models.
Chart 3.4.1: Story Acceleration Vs Story for model-1 along X-direction by THNA with and without P-delta.
Story No
Without P-Delta along X
With P-Delta along X
Without P-Delta along Y
With P-Delta along Y
1 591.25 563.22 821.52 812.32
2 623.68 646.94 888.62 862.64
3 695.74 734.02 878.00 879.84
4 688.18 702.42 1026.46 881.8
5 699.34 719.59 1046.07 860.88
6 799.86 723.57 996.86 893.27
7 759.04 692.67 1041.48 955.3
8 605.07 551.53 1011.93 955.94
9 475.67 432.74 960.95 937.52
10 472.81 472.19 939.36 885.99
11 519.66 506.69 848.07 887.96
12 569.96 517.35 1015.53 1004.21
13 707.94 672.51 958.89 917.23
14 894.47 850.5 1246.19 1114.32
15 997.43 944.24 1484.50 1340.36
[image:10.612.324.548.185.322.2]© 2016, IRJET | Impact Factor value: 4.45 | ISO 9001:2008 Certified Journal | Page 11
StoryNo
Without P-Delta along X
With P-Delta along X
Without P-Delta along Y
With P-Delta along Y
1 1705.3 1451.75 2784.01 2799.85
2 1749.62 1493.75 2834.52 2850.21
3 1775.21 1521.74 2875.79 2891.19
4 1799.42 1549.73 2912.84 2927.49
5 1821.37 1575.32 2947.38 2960.62
6 1843.62 1600.5 2979.6 2990.64
7 1874.31 1631.82 3010.75 3018.56
8 2385.78 2247.88 3095.99 3047.87
9 2405.16 2261.66 3136.23 3068.28
10 2422.11 2274.45 3176.94 3091.1
11 2438.54 2286.65 3219.04 3116.98
12 2454.43 2299.27 3262.49 3146.06
13 2470.03 2312.38 3306.79 3177.88
14 2485.08 2325.79 3352.3 3211.99
15 2499.69 2339.96 3398.25 3248.22
Table 3.4.2: Comparison of Story Acceleration for with and without P-Delta Non-Linear Time History analysis of Model-2 in x and y-direction
Chart 3.4.2: Story Acceleration Vs Story for model-1 along
Y-direction by THNA with and without
P-delta.
Chart 3.4.3: Story Acceleration Vs Story for model-2 along
X-direction by THNA with and without
P-delta.
Chart 3.4.4: Story Acceleration Vs Story for model-2 along Y-direction by THNA with and without P-delta.
Chart 3.4.5: Story Acceleration Vs Story for model-3 along X-direction by THNA with and without P-delta.
Story No
Without P-Delta along X
With P-Delta along X
Without P-Delta along Y
With P-Delta along Y
1 1065.07 1088.15 1041.79 1042.48
2 1184.81 1191.33 1223.86 1216.71
3 1162.58 1175.79 1335.02 1329.45
4 1222.07 1216.57 1188.54 1203.31
5 1317.28 1319.53 1172.79 1177.17
6 1318.9 1332.6 1288.09 1297.25
7 1304.49 1288.35 1281.5 1295.14
8 1316.69 1305.52 1213.63 1248.73
9 1268.78 1264.13 1233.91 1271.86
10 1150.91 1148.61 1139.07 1169.23
11 1022.31 996.13 993.78 989.93
12 1233.6 1187.13 1044.99 1031.87
13 1472.78 1421.42 1231.58 1224.74
14 1706.81 1654.99 1460.17 1509.05
[image:11.612.323.558.311.449.2]© 2016, IRJET | Impact Factor value: 4.45 | ISO 9001:2008 Certified Journal | Page 12
Table 3.4.3: Comparison of Story Acceleration for with andwithout P-Delta Non-Linear Time History analysis of Model-3 in x and y-direction.
Story No
Without P-Delta along X
With P-Delta along X
Without P-Delta along Y
With P-Delta along Y
1 1065.73 1077.30 1171.55 1177.18
2 1058.29 1068.29 1260.32 1269.72
3 1113.43 1124.67 1331.74 1343.82
4 1270.90 1292.63 1402.28 1421.64
5 1311.66 1319.41 1414.66 1440.58
6 1450.70 1435.23 1369.17 1398.39
7 1576.24 1565.07 1216.89 1245.36
8 1658.21 1641.37 1090.48 1111.18
9 1737.39 1717.03 1082.09 1099.38
10 1819.32 1806.83 1055.58 1077.44
11 1927.41 1921.05 987.27 1014.68
12 2093.00 2095.96 1153.88 1186.62
13 2349.45 2372.75 1413.32 1451.92
14 2695.41 2739.93 1663.11 1705.93
15 3034.78 3093.37 1924.77 1971.16
Table 3.4.4: Comparison of Story Acceleration for with and without P-Delta Non-Linear Time History analysis of Model-4 in x and y-direction.
Story No
Without P-Delta along X
With P-Delta along X
Without P-Delta along Y
With P-Delta along Y
1 1107.20 1102.88 1034.67 1030.33
2 1263.00 1240.26 1170.17 1158.06
3 1605.12 1576.92 1171.42 1156.23
4 1853.08 1822.42 1149.09 1135.24
5 2047.66 2026.97 1192.08 1186.60
6 2206.70 2191.66 1130.81 1131.24
7 2206.34 2193.58 1137.61 1117.31
8 2044.42 2028.24 1090.01 1071.44
9 2126.95 2089.97 920.78 916.69
10 2198.86 2160.07 961.30 979.06
11 2088.46 2038.52 997.76 1017.99
12 2278.34 2295.84 1147.07 1125.61
13 2536.14 2568.99 1194.49 1188.06
14 3065.72 3029.34 1400.89 1390.31
15 3556.43 3497.62 1585.33 1571.64
Table 3.4.5: Comparison of Story Acceleration for with and without P-Delta Non-Linear Time History analysis of Model-5 in x and y-direction
Chart 3.4.6: Story Acceleration Vs Story for model-3 along
Y-direction by THNA with and without
P-delta.
Chart 3.4.7: Story Acceleration Vs Story for model-4 along X-direction by THNA with and without P-delta.
Chart 3.4.8: Story Acceleration Vs Story for model-4 along
[image:12.612.323.572.101.438.2] [image:12.612.30.245.405.614.2] [image:12.612.323.566.483.622.2]© 2016, IRJET | Impact Factor value: 4.45 | ISO 9001:2008 Certified Journal | Page 13
Chart 3.4.9: Story Acceleration Vs Story for model-5 alongX-direction by THNA with and without
P-delta.
Chart 3.4.10: Story Acceleration Vs Story for model-5 along Y-direction by THNA with and without P-delta.
[image:13.612.322.557.302.460.2] [image:13.612.33.255.606.699.2]3.5 Seismic Base Shear
Table 3.5.1 shows comparison of highest values of seismic base shear of different models by Non-linear time history analysis using Bhuj Earthquake data. From the table it can be seen that the seismic base shear for all model-2 has larger values then model-1(bare frame).Model-2 increased by 85.9% along x-direction and 85.32% along y-direction as compared to bare frame model-1. The use of p-delta in the analysis increases the base shear value by 4.5% to 17% in longer direction and decreases 1.5% to 12% in shorter direction when compared without p-delta values.
Story No
Without P-Delta along X
With P-Delta along X
Without P-Delta along Y
With P-Delta along Y
1 13236 12353 24997 21449
2 93870 84144 131205 131828
3 29592 29488 33064 31581
4 60176 58209 32496 32810
5 78535 77176 29978 30939
Table 3.5.1: Seismic Base shear by Non-linear Time-History analysis
Chart 3.5.1: Model Vs Base shear for different models along x-direction by NTHA.
Chart 3.5.1: Model Vs Base shear for different models along y-direction by NTHA.
4. CONCLUSIONS
1) Time period of the structure increases with use of p-delta in the analysis and frequency of the structure decreases.
2) Time period decreases when the stiffness of masonry infill wall stiffness and shear wall are considered. 3) Story drift of all the storys found within the limit. 4) Story drift increases in longer direction and decreases
© 2016, IRJET | Impact Factor value: 4.45 | ISO 9001:2008 Certified Journal | Page 14
5) Story displacement are decreases when infill wall stiffness and shear walls are considered in to the building.
6) Story acceleration are increases when infill wall stiffness and shear walls are added to the structure. 7) Base shear decreases when p-delta is considered in
the building along shorter direction and increase in longer direction.
8) The soft story effect is less at intermediate location of the building. A service story of lesser height can be safer for building at higher level.
9) Models with soft stories have got highest story drift values at soft stories levels, which leads to dangerous sway mechanism. Therefore, providing shear wall is essential so as to avoid soft story failure.
10)The use of P-delta can be included in the building for the analysis and design purposes
5. REFERENCE
1) Stability of Tall Buildings, Daivd Gustafsson & Joseph Hehir Department of Civil and Environmental Engineering Master’s Thesis 2005:12 Division of Structural Engineering Concrete Structures, Chalmers University of Technology Goteborg, Sweden 2005 2) IJRET: International Journal of Research in
Engineering and Technology eISSN: 2319-1163 pISSN: 2321-7308. Stability Analysis of Steel Frame Structures: P-Delta Analysis.
3) IJSRD - International Journal for Scientific Research & Development| Vol. 3, Issue 05, 2015 | ISSN (online): 2321-0613. Seismic Analysis of Multi-Storyed Building with Underneath Satellite Bus Stop and Intermediate Service Soft Story Having Floating Columns.
4) Structural Engineering and Structural Mechanics- Structural Stability - Eric M. Luis Encyclopedia of Life Support Systems (EOLSS) Structural Stability.
5) IJSRD - International Journal for Scientific Research & Development| Vol. 2, Issue 06, 2014 | ISSN (online): 2321-0613 all rights reserved by www.ijsrd.com 648. Seismic Evaluation of Multi-Storyed RC Framed Structural System with The Influence of Different Shear Walls and Soft Storys.
6) International Journal of Solids and Structures 37 (2000) 55±670020-7683/00/$ - see front matter # 1999 Elsevier Science Ltd. All rights reserved. PII: S00
2 0- 6 8 3(99)0 00 7 8- 5
www.elsevier.com/locate/ijsolstr. Structural stability 7) International Journal of Allied Practice, Research and
Review Website: www.ijaprr.com (ISSN 2350-1294) Study of P-Delta Effect on Tall Steel Structure
8) Stability Analysis of Frame Tube Tall Buildings by Amit Urs Masters of Science Department of Civil and Environmental Engineering Worcester Polytechnic Institute. Worcester, MA. 01609. Oct, 2002
9) Story-Based Stability Analysis for Multi-Story Unbraced Frames Subjected to Variable Loading by Xiaohong Wang a thesis presented to the University of Waterloo, Ontario, Canada, 2008
10)Nonlinear Stability Analysis of Frame-Type Structures with Random Geometric Imperfections Using a Total-Lagragian Finite Element Formulation. By J.E. Warren. 11)www.csietabs.com