NOV-DEC 2016, VOL-4/27 www.srjis.com Page 4522 A STUDY OF CREATIVITY IN RELATION TO PERSONALITY TRAITS OF HIGH
SCHOOL STUDENTS
Satish Kumar Kalhotra, Ph. D.
Associate Professor, Rajiv Gandhi University, Itanagar.
The present study made an attempt t compare the mean score of students with high and low scores on different dimensions of Verbal Creativity with regard to their scores on Emotional Stability, Curiosity and Self-Concept. In the present study, random sampling technique was employed for collecting the data from 150 students. Descriptive Survey Method was used for the present study. „Verbal Tests of Creativity‟ by Prof. B.K Passi and Emotional Stability,Curiosity and Self-Concept „Singh‟s Differential Personality Inventory‟ by Arun Kumar Singh (2002) was employed. This shows that there exist no significant differences between students with high and low Verbal Fluency, Verbal Flexibility, Verbal Originality and Verbal Creativity with regard to their scores on Emotional Stability, Curiosity and Self-Concept respectively. Hence the Hypothesis namely- “Students in the high and low scores of Verbal Fluency, Verbal Flexibility, Verbal Originality and Verbal Creativity differ with respect to Emotional stability, Curiosity and Self-Concept” stand rejected at the high school stage.
Keywords: creativity, Personality and self concept
Introduction
Meaning and Definitions of Creativity Creativity
Creativity is an essential factor in thinking and learning which cuts across all disciplines. It is a central factor in driving the birth of new knowledge and innovation, and as such is a vital construct for the field of education. Over the past several decades creativity has become a trait of increasing interest in fields such as education and psychology (Plucker, Beghetto, and Dow, 2004). Creativity is the central source of meaning in our lives. Most of the things that are interesting, important and humane in life are the results of creativity. What makes us different from apes our language, values, artistic expression, scientific understanding and technology are the results of individual ingenuity that was recognized, rewarded and transmitted though creative potential of human race.
Creativity is a process which results in novel work that is accepted as useful or satisfying by a group at some point of time. It is a process whereby something new and valuable is created. Z Scholarly Research Journal's is licensed Based on a work at www.srjis.com
NOV-DEC 2016, VOL-4/27 www.srjis.com Page 4523 The ideas and concepts so conceived can then manifest themselves in any number of ways, but most often they become something we can see, hear, and smell touch or taste use, exhibit and preserve. Creativity is the capacity of a person to produce composition, products or ideas which are essentially new or novel and previously unknown to the producer. Creativity is the power of the human mind to create new contents by transforming relations and thereby generating new correlates. The phenomenon of creativity is so complex and multidimensional that it has proved to be one of the most troublesome concepts in the literature of measurement with no universally accepted definition.
The creative potential is mostly defined in term of, one of the cognitive abilities namely- “Divergent Thinking”. Divergent thinking is the ability to generate a number of alternative decisions of problem solving. Divergent thinking is the ability to produce many ideas in a short span of time. These ideas/solutions/response are scored in term of four major dimensions i.e. Originality, Fluency, Flexibility and Elaboration. However, many thinkers point out that divergent thinking is only a part of creativity and should not be treated as equivalent of creativity.
Personality
Personality is the particular combination of emotional, attitudinal, and behavioral response patterns of an individual. Different personality theorists present their own definitions of the word based on their theoretical positions. Personality is the sum of activities that can be discovered by actual observations over a long enough period of time to give reliable about individual information. It is the sum total of all biological, innate dispositions, impulses, tendencies, appetites and instincts of the individual and the dispositions and tendencies acquired by him through experience. Personality is the stable set of characteristics and tendencies that determine those commonalities and differences in the psychological behaviour (thought, feelings, and actions) of people that have continuity in time and that may or may not be easily understood in terms of the social and biological pressure of the immediate situation alone.
Relationship between Creativity and Personality
NOV-DEC 2016, VOL-4/27 www.srjis.com Page 4524 individual attempts to realize his full potential during his/her interaction with the environment. In the words of Rogers, “the main spring of creativity appears to be man‟s tendency to actualize himself, to become his potentiality. By this, I mean the urge to expand, extend, develop, mature the tendency to express and activate all capacities of the organisium. Several psychologists have studied the relationship between Creativity and Personality. Getzels and Jackson(1962) have pointed out that the highly creative adolescents differ not only in mental processes but also in their temperaments. The first systematic idea of the relationship between Creativity and Personality is found in the works of Sigmund Freud. In 1952, Kris supported the idea of Frued that creativity is inborn mental conflict. In 1965, Berlyne pointed out that more mental conflict leads to higher creativity and more creative person is determined to solve more different difficult problems. In 1937, Earlier Allport had pointed out that creativity is expressed in functional autonomy in the individual. In 1937, Goldstein maintained that there is an effective tendency of self-expression through creative processes found among creative person.
REVIEW OF RELATED LITERATURE
Devi, Dr. Nirmala (2011). It is found achievement motivation has no effect on the adjustment, Extraversion has positive effect on social, educational and general adjustment and Neuroticism has negative effect on the emotional, social, educational and general adjustments. Effect of other secondary aspects on adjustment like sex and school location are also anlaysed and found that rural students proved better than the urban students on social, Educational and General/Total adjustment.
Kalita,Sima (2016).The study also depicted that high level of emotional stability leads to high academic achievement and low emotional stability leads to low level of academic achievement.
Lee, Kyung-Hwa (2005). It was found that creative thinking ability was partly related to creative personality and that there was a difference between creative thinking ability and creative personality. This researcher believes that teaching 4 to 5 year-old preschoolers in educational programs designed with consideration of these study results will be much more effective than in the past.
NOV-DEC 2016, VOL-4/27 www.srjis.com Page 4525 Verma Anju (2016). There exist no significant difference between variable academic achievement and personality characteristic. Further said that there exist no significant relationship between variable academic achievement and personality characteristic.
Objectives of the study
1. To Study the nature of Scores of Verbal Fluency, Verbal Flexibility, Verbal Originality,
Verbal Creativity.
2. To Study the nature of Scores of Personality traits namely- Emotional stability, Curiosity
and Self-Concept.
3. To Study the relationship between Verbal Fluency, Verbal Flexibility, Verbal Originality
and Verbal Creativity.
4. To Study of the relationship between scores obtained on different dimensions of Verbal
Creativity with scores on Emotional Stability, Curiosity and Self-Concept among boys and girls at high school stage.
5. To Study the differences between Male and Female students with regard to their scores on
Verbal Fluency, Verbal Flexibility, Verbal Originality and Verbal Creativity respectively at high school stage.
6. To compare the mean score of students with high and low scores on different dimensions
of Verbal Creativity with regard to their scores on Emotional Stability, Curiosity and Self-Concept.
HYPOTHESES OF THE STUDY
1. The scores on variables namely Verbal Fluency, Verbal Flexibility, Verbal Originality,
Verbal Creatively, Emotional stability, Curiosity, Self-Concept are normally distributed.
2. There is significant correlations between scores on different dimensions of Verbal
Creativity.
3. There is significant correlation between scores on different dimensions of Verbal
Creativity with Emotional Stability, Curiosity and Self-Concept.
4. Male and Female students do not differ significantly with regard to their mean scores on
different dimensions of Verbal Creativity.
5. Students with high and low Scores on Verbal Fluency, Verbal Flexibility, Verbal
NOV-DEC 2016, VOL-4/27 www.srjis.com Page 4526 Method
In order to achieve the objectives of present study, Descriptive Survey Method was used. Use of inferential statistics was made to derive results from the data collected.
Sample
In the present study, random sampling technique was employed for collecting the data from 150 students from 6 schools of Jammu District. The sample comprised of 75 male and 75
female students studying at the secondary level i.e. 9th and 10th classes. Boys and Girls
selected for the study belonged to the age group 14-16 years. Tools used
The data was collected by administering the following two tools
1. For studying the status on different dimensions of Verbal Creativity „Verbal Tests of
Creativity‟ by Prof. B.K Passi was administrated. Passi‟s Tests of Creativity (1971) were standardized for higher secondary pupil population.
2. For studying the status on personality traits namely Emotional Stability, Curiosity and
Self-Concept „Singh‟s Differential Personality Inventory‟ by Arun Kumar Singh (2002) was employed,
ANALYSIS AND INTERPRETATION OF DATA
Study of the nature of scores of verbal fluency, verbal flexibility, verbal originality and verbal creativity: results
Verbal Fluency
Table - 1 shows the values of Mean, Median, S.D, Skewness, and Kurtosis of scores on Verbal Fluency obtained by high school students in the sample
Table - 1 Descriptive Statistics of Scores on Verbal Fluency
Statistic Value Remarks
Mean 14.03 -
Median 14 -
Standard deviation 4.5 -
Skewness 0.676 Positively Skewed
Kurtosis 1.780 Leptokurtic
NOV-DEC 2016, VOL-4/27 www.srjis.com Page 4527 distribution would have more closely resembled the normal probability curve. So it can be said that Verbal Fluency is a normally distributed ability.
Verbal Flexibility
Table - 2 shows the values of Mean, Median, S.D, Skewness, and Kurtosis of scores on Verbal Flexibility obtained by high school students in the sample
Table – 2 Descriptive Statistics of scores on Verbal Flexibility
Statistics Values Remarks
Mean 4.86 -
Median 5 -
Standard deviation 2.9 -
Skewness 0.750 Positively Skewed
Kurtosis 1.449 Leptokurtic
The statistical analysis of the shape indicates that the curve is positively skewed as the value is higher than the normal. It means that higher concentration of scores fall on the right side of the mean. Further, the distribution is Leptokurtic or peaked. It can be due to the fact data has been collected in the present study on a sample of 150 students. If the data had been collected on larger sample, the frequency distribution would have more closely resembled the normal probability curve. So it can be said that Verbal Flexibility is a normally distributed ability. Verbal Originality
Table - 3 shows the values of Mean, Median, S.D, Skewness, and Kurtosis of scores on Verbal Originality obtained by high school students in the sample
Table 4.3 Descriptive Statistics of scores on Verbal Originality
Statistics Value Remarks
Mean 35.43 -
Median 36 -
Standard deviation 13.93 -
Skewness 0.941 Positively Skewed
Kurtosis 2.72 Leptokurtic
The statistical analysis of the shape indicates that the curve is positively skewed as the value is higher than the normal. It means that higher concentration of scores fall on the right side of the mean value. Further, the distribution is Leptokurtic or peaked. It can be due to the fact data has been collected in the present study on a sample of 150 students. If the data had been collected on larger sample, the frequency distribution would have more closely resembled the normal probability curve. So it can be said that Verbal Originality is a normally distributed ability.
Verbal Creativity
NOV-DEC 2016, VOL-4/27 www.srjis.com Page 4528 Table – 4 Descriptive Statistics of scores on Verbal Creativity
Statistics Value Remarks
Mean 54.33 -
Median 55.50 -
Standard deviation 20.43 -
Skewness 0.929 normally skewed
Kurtosis 2.970 Leptokurtic
The statistical analysis of the shape indicates that the curve is not skewed. This means that scores fall eventually on both sides of the mean. At the same time the curve is Platyokurtic. It can be due to the fact data has been collected in the present study on a sample of 150 students. If the data had been collected on larger sample, the frequency distribution would have more closely resembled the normal probability curve. So it can be said that Verbal Creativity is a normally distributed ability.
Study of the nature of scores of personality traits namely emotional stability, curiosity and self-concept: results
Emotional Stability
Table - 5 shows the values of Mean, Median, S.D, Skewness, and Kurtosis of scores on Emotional Stability obtained by high school students in the sample
Table – 5 Descriptive Statistics of scores on Emotional Stability
Statistics Value Remarks
Mean 9.42 -
Median 10 -
Standard deviation 1.69 -
Skewness -0.365 Negatively skewed
Kurtosis 0.154 Platykurtic
The statistical analysis of the shape indicates that the curve is negatively skewed as the value of skewness is lower than the normal. It means that higher concentration of scores fall on the left side of the mean. Further, the shape of the curve is Platykurtic. It can be due to the fact data has been collected in the present study on a sample of 150 students. If the data had been collected on larger sample, the frequency distribution would have more closely resembled the normal probability curve. So it can be said that Emotional Stability is a normally distributed trait among the population.
Curiosity
NOV-DEC 2016, VOL-4/27 www.srjis.com Page 4529 Descriptive Statistics of scores on Curiosity
Statistics Value Remarks
Mean 11.33 -
Median 11 -
Standard deviation 1.59 -
Skewness -0.207 Negatively Skewed
Kurtosis 0.394 Leptokurtic
The statistical analysis of the shape indicates that the curve is negatively skewed i.e. the value of skewness is lower than the normal. It means that higher concentration of scores fall on the left side of the mean. Further the shape of the curve is Leptokurtic or peaked. It can be due to the fact data has been collected in the present study on a sample of 150 students. If the data had been collected on larger sample, the frequency distribution would have more closely resembled the normal probability curve. So it can be said Curiosity is a normally distributed trait among the population.
Self-Concept
Table - 7 shows the value of Mean, Median, S.D, Skewness, and Kurtosis of scores on Self-Concept obtained by high school students in the sample
Table – 7 Descriptive Statistics of scores on Self-Concept
Statistics Value Remarks
Mean 8.59 -
Median 8.50 -
Standard deviation 1.48 -
Skewness 0.194 normally skewed
Kurtosis -0.062 Platykurtic
The statistical analysis of the shape indicates that the curve is not skewed. This means that sores fall eventually on both side of the mean. At the same time the curve is Platykurtic. It can be due to the fact data has been collected in the present study on a sample of 150 students. If the data had been collected on larger sample, the frequency distribution would have more closely resembled the normal probability curve. So it can be said that Self-Concept is a normally distributed ability.
Study of the relationship between verbal fluency, verbal flexibility, verbal originality and verbal creativity: results
NOV-DEC 2016, VOL-4/27 www.srjis.com Page 4530 Table – 8 Coefficients of correlation between Verbal Fluency, Verbal Flexibility, Verbal
Originality, and Verbal Creativity
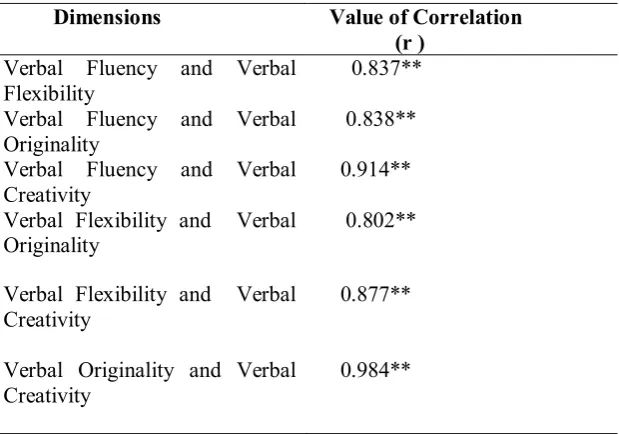
(**) value Significant at 0.01 level. A study of Table - 8 indicates as under:
1. The value of Coefficient of Correlation between Verbal Fluency and Verbal Flexibility
(r= 0.837**) is highly positive and significant at 0.01 level. Hence, Verbal Fluency is highly correlated with Verbal Flexibility.
2. The value of Coefficient of Correlation between Verbal Fluency and Verbal
Originality(r= 0.838**) is highly positive and significant at 0.01 level. Hence, Verbal Fluency is highly correlated with Verbal Originality.
3. The value of Coefficient of Correlation between Verbal Fluency and Verbal Creativity (r=
0.914**) is highly positive and significant at 0.01 level. Hence, Verbal Fluency is highly correlated with Verbal Creativity.
4. The value of Coefficient of Correlation between Verbal Flexibility and Verbal Originality
(r=0.802**) is highly positive and significant at 0.01 level. Hence, Verbal Flexibility is highly correlated Verbal Originality.
5. The value of Coefficient of Correlation between Verbal Flexibility and Verbal
Creativity(r= 0.877**) is highly positive and significant at 0.01 level. Hence, Verbal Flexibility is highly correlated with Verbal Creativity.
6. The value of Coefficient of Correlation between Verbal Originality and Verbal
Creativity(r= 0.984**) is highly positive and significant at 0.01 level. Hence, Verbal Originality is highly correlated with Verbal Creativity.
Dimensions Value of Correlation
(r )
Verbal Fluency and Verbal Flexibility
0.837**
Verbal Fluency and Verbal Originality
0.838**
Verbal Fluency and Verbal Creativity
0.914**
Verbal Flexibility and Verbal
Originality 0.802**
Verbal Flexibility and Verbal Creativity
0.877**
Verbal Originality and Verbal Creativity
[image:9.595.145.455.120.337.2]NOV-DEC 2016, VOL-4/27 www.srjis.com Page 4531 Study of the relationship between scores obtained on different dimensions of verbal creativity with scores on emotional stability, curiosity and self-concept among boys and girls at high school stage: results
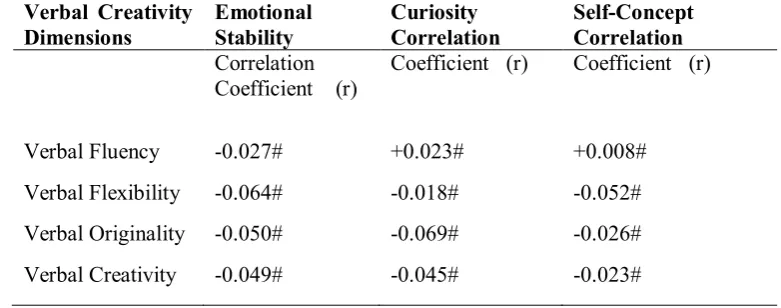
The extent of relationship between the scores on different dimension of Verbal Creativity and scores on Emotional Stability, Curiosity and Self-Concept respectively was studied by computing Pearson‟s Product Moment Correlation Coefficient (Pearson‟s r)
Table - 9 shows the values of coefficients of correlation between scores obtained on different dimensions of Verbal Creativity with Emotional Stability, Curiosity and Self-Concept
Table – 9 Coefficients of Correlation between scores obtained on different dimensions of Verbal Creativity with Emotional Stability, Curiosity and Self-Concept
Verbal Creativity Dimensions
Emotional Stability
Curiosity Correlation
Self-Concept Correlation
Correlation Coefficient (r)
Coefficient (r) Coefficient (r)
Verbal Fluency -0.027# +0.023# +0.008#
Verbal Flexibility -0.064# -0.018# -0.052#
Verbal Originality -0.050# -0.069# -0.026#
Verbal Creativity -0.049# -0.045# -0.023#
(#) value not significant at 0.05 level.
On the basis of results given in the table, it can be concluded as under:
1. The value of correlation coefficient between Verbal Fluency and Emotional
Stability(r=-0.027) is not significant at 0.05 level. Hence, Verbal Fluency is not correlated with Emotional Stability. In other words, Verbal Fluency and Emotional Stability are two more or less independent variables and one is not affected by the other.
2. The value of correlation coefficient between Verbal Fluency and Curiosity(r= 0.023)
is not significant at 0.05 level. Hence, Verbal Fluency is not correlated with Curiosity. In other words, Verbal Fluency and Curiosity are two more or less independent variables and one is not affected by the other.
3. The value of correlation coefficient between Verbal Fluency and Self-Concept(r
[image:10.595.100.491.304.458.2]NOV-DEC 2016, VOL-4/27 www.srjis.com Page 4532
4. The value of correlation coefficient between Verbal Flexibility and Emotional
Stability(r=-0.064) is not significant at 0.05 level. Hence, Verbal Flexibility is not correlated with Emotional Stability. In other words Verbal Flexibility and Emotional Stability are two more or less independent variables and one is not affected by the other.
5. The value of correlation coefficient between Verbal Flexibility and Curiosity(r=
-0.018) is not significant at 0.05 level. Hence, Verbal Flexibility is not correlated with Curiosity. In other words, Verbal Flexibility and Curiosity are two more or less independent variables and one is not affected by the other.
6. The value of correlation coefficient between Verbal Flexibility and
Self-Concept(r=-0.052) is not significant at 0.05 level. Hence, Verbal Flexibility is not correlated with Self-Concept. In other words, Verbal Flexibility and Self-Concept are two more or less independent variables not related to each other.
7. The value of correlation coefficient between Verbal Originality and Emotional
Stability(r= -0.050) is not significant at 0.05 level. Hence, Verbal Originality is not correlated with Emotional Stability. In other words, Verbal Originality and Emotional Stability are two more or less independent variables and not related to each other.
8. The value of correlation coefficient between Verbal Originality and Curiosity(r=
-0.069) is not significant at 0.05 level. Hence, Verbal Originality is not correlated with Curiosity. In other words, Verbal Originality and Curiosity are two more or less independent variables and one is not affected by the other.
9. The value of correlation coefficient between Verbal Originality and Self-Concept
(r=-0.026) is not significant at 0.05 level. Hence, Verbal Originality is not correlated with Self-Concept. In other words, Verbal Originality and Self- Concept are two more or less independent variables and one is not affected by the other.
10.The value of correlation coefficient between Verbal Creativity and Emotional
Stability(r= -0.049) is not significant at 0.05 level. Hence, Verbal Creativity is not correlated with Emotional Stability. In other words, Verbal Creativity and Emotional Stability are two more or less independent variables and one is not affected by the other.
11.The value of correlation coefficient between Verbal Creativity and Curiosity(r=
NOV-DEC 2016, VOL-4/27 www.srjis.com Page 4533 Curiosity. In other words, Verbal Creativity and Curiosity are two more or less independent variables and not related to each other.
12.The value of correlation coefficient between Verbal Creativity and Self-Concept
(r=-0.023) is not significant at 0.05 level. Hence, the Verbal Creativity is not correlated with Self-Concept. In other words, Verbal Creativity and Self-Concept are two more or less independent variables and one is not related to the other.
The results given in the table indicate that even though all the 12 correlation shown in the table are insignificant, yet it can be seen that coefficient 2 correlations are positive and 10 correlations are negative. Thus association between different variables even though not significant in statistical terms does indicate positive or negative association between the variables concerned.
Differences between male and female high school students with regard to scores on verbal fluency, verbal flexibility, verbal originality, verbal creativity: results
In order to examine whether male and female high school students differ significantly with regard to their mean scores on different dimensions of Verbal Creativity, Significance of differences between means scores were worked out and „t‟ values were computed. The results have been given in table - 10 to 13
Verbal Fluency
Table - 10 shows the significance of difference between Male and Female Students with regard to mean Verbal Fluency scores
Table – 10 Significance of Difference Between Male and Female Students on Verbal Fluency
(#) value not significant at 0.05 level.
From Table - 10 it can be seen that t-value computed between male and female students on Verbal Fluency is 1.535 which is not significant at 0.05 level. This shows that there is no significant difference between boys and girls on Verbal Fluency. In other words, boys and girls cannot be statistically differentiated on the basis of their scores on Verbal Fluency. At
Creativity Dimension
Group N Mean SD Calculated
‘t’ value
Verbal Fluency
Male Students
75 14.60 5.15 1.535 #
Female Students
[image:12.595.115.483.536.626.2]NOV-DEC 2016, VOL-4/27 www.srjis.com Page 4534 the same time, the value of„t‟ is large enough to be of symptomatic importance. It can be said that generally, boys are likely to be more fluent than girls at high school stage.
Verbal Flexibility
Table - 11 shows the significance of difference between Male and Female Students with regard to mean Verbal Flexibility scores
Table – 11 Significance of Difference in Male and Female Students on Verbal Flexibility
(#) value not significant at 0.05 level.
From Table - 11 it can be seen that t-value computed for gender difference on Verbal
Flexibility level is 0.945 which is not significant at 0.05 level. This shows that there are no significant difference between boys and girls on Verbal Flexibility.
Verbal Originality
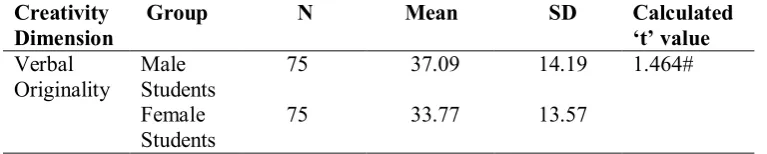
[image:13.595.98.496.211.289.2]Table - 12 shows the significant difference between Male and Female Students with regard to mean Verbal Originality scores
Table - 12
Significance of Difference in Male and Female Students on Verbal Originality
(#) value not significant at 0.05 level.
From Table - 12 it can be seen that t-value computed for gender difference on the basis of
Verbal Originality scores is 1.464 which is not significant at 0.05 level. This shows that there is no significant difference between boys and girls on Verbal Originality. In other words, boys and girls cannot be statistically differentiated on the basis of scores on Verbal Originality. At the same time the value of „t‟ is large enough to be of symptomatic importance. It can be said that generally, boys are likely to have higher Verbal Originality than girls at high school stage.
Creativity Dimension
Group N Mean SD Calculated
‘t’ value
Verbal Flexibility
Male Students
75 5.09 3.20 0.945#
Female Students
75 4.64 2.64
Creativity Dimension
Group N Mean SD Calculated
‘t’ value
Verbal Originality
Male Students
75 37.09 14.19 1.464#
Female Students
[image:13.595.108.492.496.573.2]NOV-DEC 2016, VOL-4/27 www.srjis.com Page 4535 Verbal Creativity
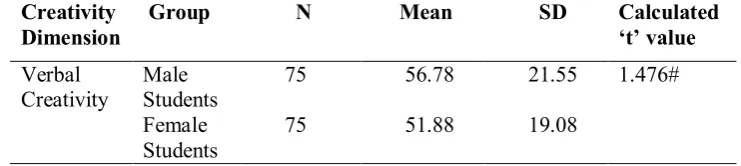
Table - 13 shows the significant difference between Male and Female Students with regard to Verbal Creativity scores
Table – 13 Significance of Difference in Male and Female Students on Verbal Creativity
(#) value not significant at 0.05 level.
From Table - 13 it can be seen that t-value computed for difference between boys and girls on the basis of Verbal Creativity score is 1.476 which is not significant at 0.05 level. This shows that there is no significant difference between boys and girls on Verbal Creativity. In other words, boys and girls cannot be statistically differentiated on the basis of their scores on Verbal Creativity. At the same time the value so „t‟ is large enough to be of symptomatic importance. It can be said that generally, boys are likely to have higher Verbal Creativity than girls at high school stage.
Comparison of the mean scores of students with high and low status on different dimensions of verbal creativity with regard to scores on emotional stability, curiosity and self-concept: results
In order to study whether students with high and low Verbal Fluency, Verbal Flexibility, Verbal Originality and Verbal Creativity differ statistically with regard to their means scores on Emotional Stability, Curiosity and Self-Concept, the investigator first identified students with high and low status on Verbal Fluency, Verbal Flexibility, Verbal originality and Verbal Creativity. This was done by computing Percentile points 27 and Percentile points 73 of the scores on all Verbal Creativity dimensions and then identifying students falling below and above these percentile points. Next, Means, S.D of the students with high and low Verbal Creativity were worked out on Emotional Stability, Curiosity and Self-Concept. Significance of difference between the groups were next computed by computing t-value. Results have been given in Table - 14 to 16
Creativity Dimension
Group N Mean SD Calculated
‘t’ value
Verbal Creativity
Male Students
75 56.78 21.55 1.476#
Female Students
[image:14.595.111.482.165.248.2]NOV-DEC 2016, VOL-4/27 www.srjis.com Page 4536 Emotional Stability
Significance of Differences Between group of Students with High and Low Status on Different Dimensions of Verbal Creativity with regard to scores on Emotional Stability has been given in Table - 14
Table – 14 Differences Between Group of Students with High and Low Scores on Different Dimensions of Verbal Creativity with regard to Emotional Stability
Group N Mean Standard
Deviation
t
High Verbal Fluency 54 9.37 1.67 0.679#
Low Verbal Fluency 43 9.60 1.70
High Verbal
Flexibility
60 9.25 1.62 1.144#
Low Verbal
Flexibility
46 9.60 1.57
High Verbal
Originality 51 9.33 1.59 0.175#
Low Verbal
Originality
44 9.27 1.78
High Verbal
Creativity
41 9.41 1.68 0.619#
Low Verbal
Creativity
39 9.43 1.61
(#) value not significant at 0.05 level.
1. From the Table - 14 it can be seen that the value of „t‟ computed between students with
high and low Verbal Fluency level is 0.679 which is not significant at 0.05 level. This shows that there is no significant difference between students with high and low Verbal Fluency with regard to Emotional Stability.
2. The value of „t‟ computed between students with high and low Verbal Flexibility level is
1.144 which is not significant at 0.05 level. This shows that there is no significant difference between students with high and low Verbal Flexibility with regard to Emotional Stability.
3. The value of„t computed between students with high and low Verbal Originality level is
0.175 which not significant at 0.05 level. This shows that there is no significant difference between students with high and low Verbal Originality with regard to Emotional Stability.
4. The value of„t‟ computed between students with high and low Verbal Creativity level is
[image:15.595.96.502.199.446.2]NOV-DEC 2016, VOL-4/27 www.srjis.com Page 4537 Curiosity
Significance of Differences of Students with High and Low Status on Different Dimensions of Verbal Creativity with Regard to scores on Curiosity
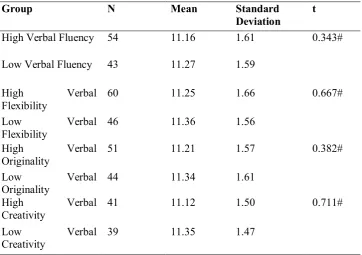
Table – 15 Differences Between mean scores on curiosity of group of Students with High and Low Scores on Different Dimensions of Verbal Creativity
(#) represent not significant at 0.05 level.
1. From the Table - 15 it can be seen that the value of„t‟ computed between students with
high and low Verbal Fluency level is 0.343 which is not significant at 0.05 level. This shows that there is no significant difference between students with high and low Verbal Fluency with regard to Curiosity.
2. The value of „t‟ computed between students with high and low Verbal Flexibility level is 0.667 which is not significant at 0.05 level. This shows that there is no significant difference between students with high and low Verbal Flexibility with regard to Curiosity.
3. The value of„t‟ computed between students with high and low Verbal Originality level is 0.382 which is not significant at 0.05 level. This shows that there is no significant difference between students with high and low Verbal Originality with regard to Curiosity.
4. The value of„t‟ computed between students with high and low Verbal Creativity level is 0.711 which is not significant at 0.05 level. This shows that there is no significant difference between students with high and low Verbal Creativity with regard to Curiosity.
Group N Mean Standard
Deviation
t
High Verbal Fluency 54 11.16 1.61 0.343#
Low Verbal Fluency 43 11.27 1.59
High Verbal
Flexibility
60 11.25 1.66 0.667#
Low Verbal
Flexibility
46 11.36 1.56
High Verbal
Originality
51 11.21 1.57 0.382#
Low Verbal
Originality
44 11.34 1.61
High Verbal
Creativity
41 11.12 1.50 0.711#
Low Verbal
[image:16.595.119.482.189.444.2]NOV-DEC 2016, VOL-4/27 www.srjis.com Page 4538 SELF-CONCEPT
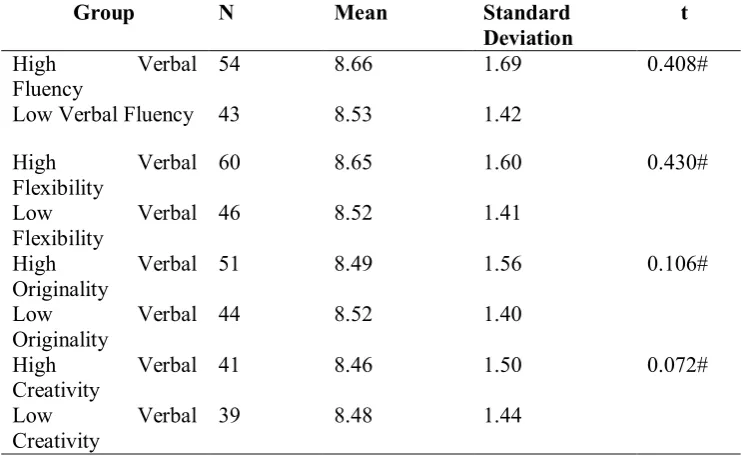
Table - 16 shows the Significant Difference Between Mean on Self-Concept Score of Students with High and Low Scores on Different Dimensions of Verbal Creativity
Table – 16 Differences Between mean scores on Self-Concept of Group of Students with High and Low Scores on Different Dimensions of Verbal Creativity
(#) value not significant at 0.05 level.
1. From the Table - 16 it can be seen that the value of „t‟ computed between students with
high and low Verbal Fluency level is 0.408 which is not significant at 0.05 level. This shows that there is no significant difference between students with high and low Verbal Fluency with regard to Self- Concept.
2. The value of„t‟ computed between students with high and low Verbal Flexibility level
is 0.430 which is not significant at 0.05 level. This shows that there is no significant difference between students with high and low Verbal Flexibility with regard to Self- Concept.
3. The value of „t‟ computed between students with high and low Verbal Originality level
is 0.106 which is not significant at 0.05 level. This shows that there is no significant difference between students with high and low Verbal Originality with regard to Self- Concept.
4. The value of „t‟ computed between students with high and low Verbal Creativity level
is 0.072 which is not significant at 0.05 level. This shows that there is no significant
Group N Mean Standard
Deviation
t
High Verbal
Fluency
54 8.66 1.69 0.408#
Low Verbal Fluency 43 8.53 1.42
High Verbal
Flexibility
60 8.65 1.60 0.430#
Low Verbal
Flexibility
46 8.52 1.41
High Verbal
Originality
51 8.49 1.56 0.106#
Low Verbal
Originality
44 8.52 1.40
High Verbal
Creativity
41 8.46 1.50 0.072#
Low Verbal
Creativity
[image:17.595.112.484.184.412.2]NOV-DEC 2016, VOL-4/27 www.srjis.com Page 4539 difference between students with high and low Verbal Creativity with regard to Self- Concept.
FINDINGS VIS-À-VIS OBJECTIVES AND HYPOTHESES OF THE STUDY Objective-1
To study the Nature of Scores of Verbal Fluency, Verbal Flexibility, Verbal Originality and Verbal Creativity
The results obtained from the study of scores on Verbal Fluency, Verbal Flexibility, Verbal Originality and Verbal Creativity show that the shape of the distribution resembles the normal probability curve. This is especially true when the curves are smoothed. However, the statistical analysis of the shapes indicates that the curves are positively skewed as the scores concentrate on higher side of mean. Further, the distributions of Verbal Creativity dimensions are Leptokurtic or peaked. It can be due to the fact data has been collected in the present study on a sample of 150 students. If the data had been collected on larger sample, the frequency distribution would have more closely resembled the normal probability curve. It can therefore be said that Verbal Fluency, Verbal Flexibility, Verbal Originality and Verbal Creativity are normally distributed abilities. Hence, the Hypothesis namely-“The scores on variables namely verbal Fluency, verbal Flexibility, Verbal Originality and Verbal Creatively are normally distributed” stands accepted on the basis of results obtained in the present study. Objective-2
To study the Nature of Scores of Personality traits namely Emotional Stability, Curiosity and Self-Concept
NOV-DEC 2016, VOL-4/27 www.srjis.com Page 4540 namely-“The scores are Personality traits namely Emotional Stability, Curiosity and Self-Concept are normally distributed” stands accepted on the basis of results obtained in the present study.
Objective-3
To Study the Relationship between Verbal Fluency, Verbal Flexibility, Verbal Originality and Verbal Creativity
The Coefficients of Correlation between Verbal Fluency, Verbal Flexibility, Verbal Originality and Verbal Creativity are highly positive and significant at 0.01 level. Hence, Verbal Fluency is highly correlated with Verbal Flexibility, Verbal Originality and Verbal Creativity. The above can be said about the correlation coefficient between Verbal Flexibility, Verbal Originality and Verbal Creativity and between Verbal Originality and Verbal Creativity respectively. The Coefficient of Correlation between Verbal Flexibility, Verbal Originality and Verbal Creativity are also highly positive and significant at 0.01 level. So, there exist significant correlations between different dimensions of Verbal Creativity. We can say that a person high in Verbal Fluency is also likely to be high on Verbal Flexibility, Verbal Originality and Verbal Creativity respectively and vice versa. Hence, the Hypothesis namely-“There exist significant correlation between different dimensions of Verbal Creativity” stands accepted on the basis of results obtained in the present study.
Objective-4
To Study the Relationship Between Scores Obtained on Different Dimensions of Verbal Creativity with Emotional Stability, Curiosity and Self-Concept among Boys and Girls at High School Stage
NOV-DEC 2016, VOL-4/27 www.srjis.com Page 4541 Objective-5
To Study the Differences between Male and Female High School Students with Regard their mean scores on Verbal Fluency, Verbal Flexibility, Verbal Originality, Verbal Creativity
The values of„t‟ computed between the mean scores obtained by the male and female students on Verbal Fluency, Verbal Flexibility, Verbal Originality and Verbal Creativity dimensions have not been found to be significant at 0.05 level. This shows that there exist no significant differences between boys and girls on Verbal Fluency, Verbal Flexibility, Verbal Originality and Verbal Creativity. At the same time, the value of„t‟ is large enough to be of symptomatic importance. This indicates that boys of high school stage may have higher Fluency,
Originality, and Creativity than the girls at high school stage. However on statistical terms,
the Hypothesis namely- “Male and Female students do not differ significantly with regard to Verbal Creativity dimensions and Emotional Stability, Curiosity, Self-Concept” stand accepted on the basis of results obtained in the present study.
Objective-6
To Compare of the Mean Scores of Students with High and Low Scores on Different Dimensions of Verbal Creativity with Regard to their Scores on Variables namely Emotional Stability, Curiosity and Self-Concept
The values of „t‟ computed between students with high and low mean score on Verbal Fluency, Verbal Flexibility, Verbal Originality and Verbal Creativity dimensions have not been found to be significant at 0.05 level. This shows that there exist no significant differences between students with high and low Verbal Fluency, Verbal Flexibility, Verbal Originality and Verbal Creativity with regard to their scores on Emotional Stability, Curiosity and Self-Concept respectively. Hence the Hypothesis namely- “Students in the high and low scores of Verbal Fluency, Verbal Flexibility, Verbal Originality and Verbal Creativity differ with respect to Emotional stability, Curiosity and Self-Concept” stand rejected at the high school stage.
REFERENCES
Allport.(1937), “Personality: A Psychological interpretation”, Holt, Rinehart, &Winston, New York. Anju verma( 2016), Academic achievement of high school student‟s in relationto their personality characteristics; IMPACT: International Journal of Research inHumanities, Arts and Literature (IMPACT: IJRHAL)ISSN(P): 2347-4564; ISSN(E): 2321-8878Vol. 4, Issue 9, Sep 2016, 11-20
Aiken,I.R. (1973). Ability and Creativity in Mathematics Review of Educational Research. 43(4); 405-432.
NOV-DEC 2016, VOL-4/27 www.srjis.com Page 4542 Devi, Dr. Nirmala ( 2011). A study of adjustment of students in relation to personality and achievement motivation; Bhartiyam International Journal of Education & Research; Volume 1 Issue 1 2011 ISSN:2277-1255
Koul,L.(2013).Methodology of Educational research. New Delhi: Vikas Publishing house.
Lee, Kyung-Hwa (2005). The relationship between creative thinking ability and creative personality of preschoolers „ International Education Journal, 2005, 6(2), 194-199. ISSN 1443-1475 © 2005 Shannon Research Press.
Mangal.S.K(2012). Advanced Educational Psychology. New Delhi: PHI Learning Private Limited. Pandey,R(2004).Advanced Educational Psychological. Meerut: Aryan Press.
Passi,B.K(1971), “A Manual for Verbal Tests of Creativity” National Psychological Corporation, Agra, India.
Personality. Retrieved February 25, 2014, from https://www.google.co.in/personality.
Shan,H.R(1993). Identification and Development of Creativity. New Delhi: Common wealth Publishers.
Sharma,R.N. & Sharma,R.K.(2006). Advanced Educational Psychology. Delhi:Atlantic Publishers & Distributors.
Sima Kalita ( 2016). Academic achievement of high school students in relation to their emotional stability ; (JPMNT) Journal of Process Management – New Technologies, International Vol. 4, No.4, 2016.
Singh,Dr. Thiyam Kiran, Kaushik,Sakshi (2015). A Study of Creativity In Relation To Big 5 Personality Traits ; The International Journal of Indian Psychology ISSN 2348-5396 (e) | ISSN: 2349-3429 (p) Volume 3, Issue 1, No.9, Sept. 2015.
Singh, A.K,(2002)“A Manual of Singh‟s Differential Personality Inventory”. National Psychological Corporation, Agra, India.
TraitTheory.RetrievedFebruary25,2014,fromhttp://en.wikipedia.org/wiki/Trait_theory
Upadhya,B.& Singh,Y.K.(2007) Educational Psychology. New Delhi: APH Publication Corporation Verma, L.K &Sharma, N.R(2011). Statistics in education and Psychology Jammu: Narendra