18
DETECTION OF OBJECTS USING FISHER SVM WITH
MODIFIED ADABOOST CLASSIFICATION TECHNIQUE
1P.SANTHI, 2V.MURALI BHASKARAN
1Assistant Professor, Department of Computer Science and Engineering, Paavai Engineering College,
Pachal, Tamilnadu, India.
2Principal, Dhirajlal Gandhi College of Technology, Omalur, Salem, Tamilnadu, India.
E-mail: 1[email protected] , 2[email protected]
ABSTRACT
The object detection is a very important technique in computer vision. This detection is mainly used in many applications like military, satellite image mining, medical and etc. This paper proposes the object detection based on data clustering methods in region based segmentation and shape feature. In existing, most of researchers are using the k-means and fuzzy k-means for clustering and it uses the SVM and Adaboost classifiers for object classification. Here each cluster needs the own centric and distance calculation for clustering. The main disadvantage of this technique is distance calculation between the pixels. This distance calculation technique does not produce the efficient result in clustering. In classification, SVM classifier needs more parameters for increasing the efficiency and adaboost is more noise sensitivity. To avoid these drawbacks, the region based segmentation using non Euclidean distance measure for clustering and combined Fisher SVM with modified adaboost algorithm is used for object classification. This result shows the region based segmentation and object classification of an image. Finally, the performance analysis graph shows the increased efficiency of proposed algorithm.
Keywords:Detection, Clustering, Classification, Segmentation, Non-Euclidean Distance, Fisher SVM.
1. INTRODUCTION
In real world, the vision plays an important role for detecting the object. Computer vision is mainly concentrates on the Object detection. It means detecting or classifying the object based on the texture and shape of an object. In image, the texture and shape are a very important entity for object classification. This process is called as mining. The mining is the process of extracting or finding some useful information or knowledge from the image repositories. Normally, the human or any detection system detecting the object based on shape and the texture of the particular object. The object texture gives the important entity or outline structure of the particular object. It will not give the shape of an object. In image, shape that shows the dimensionless quantity of an images like square, circle, rectangle, etc. The texture is identified using texture segmentation of an image. Texture segmentation having the two types are region based segmentation and boundary based segmentation. In region based segmentation gives the group or cluster if an object. Here the cluster pixels will be established
using the texture properties. The same way boundary based segmentation the cluster pixels are done by using the edges between the pixels. Here the pixel cluster using the same technique as data clustering.
The data mining is having the many techniques such as clustering, classification and association rule. The clustering is an unsupervised technique for grouping the similar objects based on centroid, hierarchical, density and distribution based clustering. In centroid based clustering having the many algorithms like k-means, fuzzy k-means and k-medoids. Another important mining technique is the classification. It is a supervised learning technique is used to identify the set of object that belongs to same group. The classification has the following algorithms are Naïve Bayes classification, Bayesian Belief Networks, Decision Tree, Ada boost, Support Vector Machine and Nearest Neighbor Classification etc. Here, the SVM is combined with kernel for giving the better result in the object detection [19] [20].
19 large databases. It is having the strong measures of support and confidence to find the relations between the patterns. The algorithms in association rule are Apriori algorithm, FP-Growth algorithm, ECLAT and OPCUS search algorithm [15]. Summarization is a technique for reducing the text documents. It uses the unsupervised learning techniques of TextRank and LexRank. Regression is a technique which is used to analysis the relationship between variables using statistical estimation.
This object detection is done based on texture and shape feature. This paper describes the modified algorithm for Image Preprocessing, modified Non Euclidean distance measures for clustering, 3D Harris corner detector for Corner detection and combined Fisher SVM with modified Adaboost classifiers for increasing the efficiency and reducing the noise sensitivity. The rest of this paper discusses the literature review, Methodologies, Results and discussion, Evaluation measure, performance analysis and finally concluded with the conclusion.
2. RELATED WORKS
In object recognition the feature selection is very important technique to select the features of an image. Feature Selection using Linear Classifier Weights is used to feature scoring and selection based on weights from linear classification models [1]. A feature selection algorithm (FSA) is a computational solution that is motivated by a certain definition of relevance. The purpose of a FSA is to identify relevant features according to a definition of relevance [2].The field of action recognition has seen a large increase in activity in recent years. This action recognition using the 2D Harris corner detector for selecting the interest points in the image and it uses the association rule for recognizing the particular object [3]. Support Vector Machine (SVM) is an effective classification method, but it does not directly obtain the feature importance. This SVM is combined with many techniques to give better feature selection [4]. The feature selection of each SVM is done using the RBF kernel for estimating the scale parameter of RBF kernel. This is a problem of hyper parameter estimation (or model selection) for SVMs, and is solved by minimizing the radius/margin (R/M) bound based on a gradient descent method [5]. In the classification of images, an important step is recognition of objects from the image. On the basis of the identified objects, we classified satellite images
with the help of decision tree [6]. For discriminating the pose clusters, we use kernel Support Vector Machines (SVM) with pose-dependent feature selection. Each linear regression is capable of selecting relevant components of the feature vector depending on pose by training it on a pose cluster which is a subset of the training samples with similar pose [7].A dynamic Bayesian network model which combines RFID and video data to jointly infer the most likely activity and object labels [8]. The Contrast of images is increased using the modified sigmoid function [9]. We present a novel combination of standard activity classification, object recognition, and text mining to learn effective activity recognizers without ever explicitly labeling training videos [10]. To learn the action recognition problem 2D Harris Corner detector is used to detect the corner for particular object [11]. In classifiers the Adaboost classifier is used for classifying the action between the object [12]. The data mining techniques is having many algorithms for mining the data and images [13-18]. SVM components with adaboost classifiers are used for the object classification [19]. The same way RST kernels are combined with the SVM for giving the better classification [20].
3. PROPOSED SYSTEM ARCHITECTURE
20 Fig.1. Proposed System Architecture
4. METHODOLOGIES
This section discusses about different methods and algorithms for image preprocessing, texture segmentation, shape detection and object classification of an image. This paper concentrates into classification of object in an image. Normally, the classification technique using supervised learning. This supervised learning technique having two phases.
1.Training Phase 2.Testing phase
The classifier is trained based on the training data. The training data contains set of input values and associated output values. In training phase, the input data and the desired output data are continually submitted to the classifiers. In this paper the training phase contains following steps:
Step 1: Get the real time Image.
Step 2: Image preprocessing technique is applied an image to remove the noise and improve the image quality.
Step 3: Find the texture of an image using texture segmentation.
Step 4: Identify the shape of an object or image Step 5: Store the Corners in database.
In testing phase, the classifier gets input data, processes it and produces the output based on the training of classifier. In this paper the testing phase contains following steps:
Step 1, 2, 3 and 4 are same as steps in training phase.
Step 5: Apply the classifiers to detect the object. Step 6: If, the object feature is already exists, and then detect the Object.
Step 7: If not, again repeat the step 2, 3, and 4.
Fig.2. Training and Testing Phases of classifiers
4.1. Image Preprocessing
This paper gives the sigmoid function with Gaussian filter algorithm to produce preprocessed image. Commonly, the sigmoid function is used to improve the quality of images and normalization of images. The Gaussian filter is used to blur image and remove the noise in the image. Here, Figure 4 shows the flowchart for image preprocessing. The following steps are used to preprocess the input image.
Step 1: Get the Input Image.
Step 2: Apply the sigmoid function with Gaussian filter to preprocess the given image.
Step 3: Get the preprocessed Image.
4.1.1.Sigmoid Function with Gaussian Filter
This paper proposes the sigmoid function with Gaussian filter to preprocess the given image. A sigmoid function is an S shaped curve is also called as a sigmoid function. It refers to the logistic function with following formula:
(1)
21 directional i, j, k to preprocess the particular image. This preprocessing technique is used to remove the noise, increasing the contrast of images and improve the quality of images. The following formula is used to preprocess the input image.
(2) In equation 2, L1and L2 is the parameters, which is used to control the brightness and contrast if the images. Where f (i, j, k) is the input image and Gσ is the Gaussian filter, which is used
to remove the noise. The Gaussian filter, Gσ, is
represented as follows:
(3) In equation 3, σ refers the standard deviation of the image. The value of x, y and z is calculated from the origin of the image. Figure 3 shows the steps followed in image preprocessing. Step 1: Get the input image.
Step 2: Apply the sigmoid function with Gaussian filter for eliminating noise and increasing the quality of images.
[image:4.595.315.521.202.306.2]Step 3: Get the preprocessed Image.
Fig.3. Steps for Image Preprocessing
4.2.Feature Selection
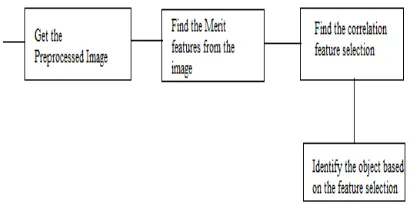
This paper introduces modified correlation feature selection algorithm for selecting the features. These selected features will be represented in the form of vector. It is also called as attribute selection or variable selection. Figure 4 shows the steps for feature selection. Here, feature selection is mainly used to find the particular object in an image. The feature will be identified based on the feature vector. This vector can be represented in the form of matrix. Here 5X5 matrix is used to represent the feature vector. It is having the following steps:
Step 1: Get the preprocessed image.
Step 2: Find the Merit features from the image.
Step 3: Find the correlation feature selection using classification-feature relevance and feature-feature relevance.
Step 4: Identify the object based on the feature selection.
Fig.4. Steps for Feature Selection
4.2.1 Modified Correlation Feature Selection
The Merit features are calculated using the following formula. The relevance is used for calculating the merit features of the particular object. Here, classification - feature relevance and feature – feature relevance are used for finding the relevance between the features. This is shown in equation 4:
(4) Where, k - It consists of set of ‘k’ features. rff - It represents feature to feature relevance.
rcf – It represents classification to feature
relevance.
(5) Where, l is a constant. The value of l is
represented as l=0, 1, 2, 3… n.
k - It consists of set of ‘k’ features. rff - It represents feature to feature
relevance.
rcf – It represents classification to
feature relevance.
4.3. Texture Segmentation
[image:4.595.86.297.482.521.2]non-22 Euclidean distance measures for region based segmentation.
4.3.1. Region based Segmentation
It means grouping or clustering the same pixels in an image. This paper gives the modified non Euclidean distance measures algorithm for clustering. Here the distance will not be considered for the clustering of pixels. Instead of the distance, the logical points will be considered for grouping the pixels in an image. It uses the non-Euclidean measure of city block distance or Manhattan distance. The following equation 6 refers the existing city block distance.
(6)
Here, the equation 6 is modified into modified city block distance measure or non-Euclidean distance measure. The equation 7 shows the modified formula,
(7) Where,
D – It represents the Modified city block distance,
aj - It represents the Centre pixel assumption
point,
bk – It represents the top most pixel point.
Fig.5. Steps for Region based Texture Segmentation
Here the figure 5 represents the steps in region based texture segmentation. The steps are, Step 1: Get the preprocessed image.
Step 2: Apply the modified city block distance measure for clustering or grouping the pixels. Step 3: Get the image texture for the particular object.
4.4. Corner Detection
This technique is used to find the interest points in an image. It is a point, in which the well-
defined position can be detected from an image. Here, the interest point in an image is called as
corner.
Fig.6. Steps for Feature Selection This paper gives modified 3D Harris corner detector for detecting the interest point in an image. These corners are used to identify the shape of the particular image. The steps used in corner detection are shown in figure 6.
The following steps are used to find the corners in an image:
Step 1: Get the Input Image.
Step 2: Apply 3D Harris Corner Detector for detecting the interest points in an image.
Step 3: Get the corners of a given image.
4.4.1. Modified 3D Harris Corner Detector
Here, the image intensity will change largely in image corner. This algorithm uses the three directions to find the corners of an image. The three directions are considered as x, y, and z. The following equation 8 shows the modified 3D Harris Corner Detector:
(8) Where,
Ix, Iy, Iz – It represents the pixel intensity of an image.
W(x, y, z) – Weighting function. The weighting function is represented in equation 9. This function uses the Gaussian distribution for calculating the weighting function.
(9)
4.5. Classification
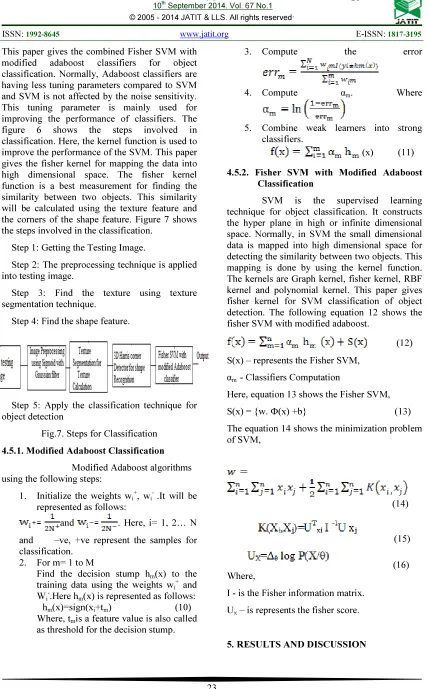
23 This paper gives the combined Fisher SVM with modified adaboost classifiers for object classification. Normally, Adaboost classifiers are having less tuning parameters compared to SVM and SVM is not affected by the noise sensitivity. This tuning parameter is mainly used for improving the performance of classifiers. The figure 6 shows the steps involved in classification. Here, the kernel function is used to improve the performance of the SVM. This paper gives the fisher kernel for mapping the data into high dimensional space. The fisher kernel function is a best measurement for finding the similarity between two objects. This similarity will be calculated using the texture feature and the corners of the shape feature. Figure 7 shows the steps involved in the classification.
Step 1: Getting the Testing Image.
Step 2: The preprocessing technique is applied into testing image.
Step 3: Find the texture using texture segmentation technique.
Step 4: Find the shape feature.
[image:6.595.86.515.81.770.2]Step 5: Apply the classification technique for object detection
Fig.7. Steps for Classification
4.5.1. Modified Adaboost Classification
Modified Adaboost algorithms using the following steps:
1. Initialize the weights wi+, wi- .It will be
represented as follows:
and . Here, i= 1, 2… N and –ve, +ve represent the samples for classification.
2. For m= 1 to M
Find the decision stump hm(x) to the
training data using the weights wi+ and
Wi-.Here hm(x) is represented as follows:
hm(x)=sign(xi+tm) (10)
Where, tmis a feature value is also called
as threshold for the decision stump.
3. Compute the error
4. Compute αm. Where
5. Combine weak learners into strong classifiers.
(x) (11)
4.5.2. Fisher SVM with Modified Adaboost Classification
SVM is the supervised learning technique for object classification. It constructs the hyper plane in high or infinite dimensional space. Normally, in SVM the small dimensional data is mapped into high dimensional space for detecting the similarity between two objects. This mapping is done by using the kernel function. The kernels are Graph kernel, fisher kernel, RBF kernel and polynomial kernel. This paper gives fisher kernel for SVM classification of object detection. The following equation 12 shows the fisher SVM with modified adaboost.
(12) S(x) – represents the Fisher SVM,
αm - Classifiers Computation
Here, equation 13 shows the Fisher SVM, S(x) = {w. Ф(x) +b} (13) The equation 14 shows the minimization problem of SVM,
(14)
(15)
(16) Where,
I - is the Fisher information matrix. Ux – is represents the fisher score.
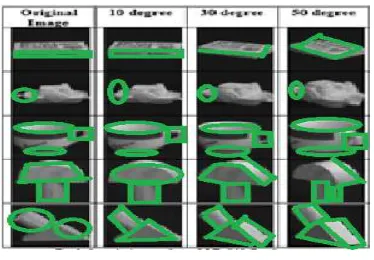
24 The figure 8 shows the texture segmentation of the database image. This process will be done by using the region based segmentation with modified non Euclidean distance measures. The figure 9 shows the corner detection of the images. Here 3D corner detector is applied into the database for finding the corners of different degrees. The previous algorithms are not concentrating in the different degrees. At that time the same object in the different degree has not detected. But this paper gives algorithm for detecting the object in any direction.
Fig.8. Texture Segmentation
Table.1. Performance Of Algorithms In Different Degrees Of Object
Methods F- Measure in %
10
degree degree 30 degree 50 (10, 30, All 50) Fisher SVM
with Modified Adaboost Algorithm
94% 95.6% 93.4% 98.2%
Modified Adaboost Classification
89.2% 92.3% 93.4% 96.1%
Adaboost
Classification 85.6% 88.5% 92.1% 86.3% SVM 86.4% 85.2% 95.6% 87.3%
[image:7.595.81.268.270.400.2]Fig.9. Corner Detection
Table.2. Performance Of Algorithms In Different Samples
6. EXPERIMENTAL SETUP
[image:7.595.343.476.567.667.2]This experiment was implemented in MATLAB. The proposed classification algorithm was tested using the testing and training images. The COIL 100 image data base is taken for the experiment. This data base contains 100 different types of images with different degree. In this images are divided into testing set and training set. Figure 7 shows the database of different objects with different degrees.
Fig.10. Coil – 100 Database
7. EVALUATION MEASURE
Here the performance of classifier is evaluated using the metrics of measure. The F-measure is a harmonic mean of precision and recall [19]. The equation 17 shows the calculation
Number of samples
F- Measure in %
Adaboost SVM Modified
Adaboost
Fisher SVM
with Modified Adaboost
25 of F-measure. This value will be represented in the table 1 and 2.
(17) The following equation 18 and 19 shows the formula for precision and recall.
(18)
(19) Where,
Precision – Percentage of positive predictions that are correct.
Recall - percentage of positive labeled instances that were predicted as positive.
TP – True Positive of the particular instances. FP - False Positive of the particular instances. FN - False Negative of the particular instances.
8. PERFORMANCE ANALYSIS
[image:8.595.88.514.513.736.2]Figure 11 shows the performance of SVM, Adaboost, Modified Adaboost and Fisher SVM with Modified Adaboost classification technique in object detection with different degrees. Here, the fisher SVM with modified Adaboost having the higher performance compare to remaining three algorithms. The same way, in the samples also the proposed technique having the more performance compare to others. The performance in the different samples will be represented in the figure 12.
Fig.11. Performance Of Algorithms In Different Degrees Of Object
Fig.12.Performance Of Algorithms In Different Samples
9.CONCLUSION
Object detection is a very important process in the computer vision for detecting or classifying the objects. Here the data mining and image processing technique plays a very important role for feature selection, corner detection and object classification. In this research, most of the previous researchers are using the SVM and Adaboost classification algorithm for detecting the particular object. This algorithm did not detect the objects with different degree and adaboost is more noise sensitive. To avoid these drawbacks, this paper gives the Fisher SVM with modified adaboost classification algorithm. The Coil-100 database is taken for the experiment with different degree. The result shows the 6% of increased efficiency compare to modified adaboost, 17% of increased efficiency compares to Adaboost and 10% of increased efficiency compare to SVM.
REFERENCES:
[1] DunjaMladenić, Janez Brank, Marko Grobelni and NatasaMilic-Frayling, Feature Selection using Linear Classifier Weights:Interactionwith Classification Models, SIGIR’04, July 25– 9, 2004.
[2]L.Ladha and T.Deepa, Feature Selection Methods and Algorithms, International Journal on Computer Science and Engineering, Vol. 3 No. 5 May 2011.
[3] Andrew Gilbert, John llliingworth and Richard Bowden, Action Recognition using Mined Hierarchical Compound features, IEEE Transactions on Pattern Analysis and Machine Intelligence, Vol 33, No. 5, May 2011.
26 [5]Ryuzo Okada and Stefano Soatto,Relevant
Feature Selection for Human Pose Estimation and Localization in Cluttered Images, Springer, pp. 434–445, 2008.
[6]Muhammad Shahbaz, Aziz Guergachi, Aneela Noreen, Muhammad Shaheen, Classification by Object Recognition in Satellite Images by using Data Mining, WCE 2012, July 4 - 6, 2012.
[7]Jianxin Wu, AdebolaOsuntogun, TanzeemChoudhury, MatthaiPhilipose, and James M.Rehg,
A Scalable Approach to Activity Recognition based on Object Use, IEEE Transactions on Computer Vision, vol 2, 2002.
[8]ShyamLal and Mahesh Chandra, EfficientAlgorithm for Contrast Enhancement of Natural Images,IJAIT, Vol 2, pg. no: 7-16. [9]Jonathan H. Morra, ZhuowenTu, Liana G.
Apostolova, Amity E. Green, Arthur W. Toga, and Paul M. Thompson, Comparison of AdaBoost and Support Vector Machines for Detecting Alzheimer’s Disease through Automated Hippocampal Segmentation, , IEEE Transactions on Computer Vision, vol 2, 2010.
[10]Wolfgang Karl, HardleDedyDwiPrasty and Christian Hafner, Support Vector Machines with Evolutionary Feature Selection for Default Prediction, MED. INFORM, 2002. Vol. 26, no. 1, 5.
[11]Zhenhui Li, Bolin Ding, Jiawei Han, Roland Kays and Peter Nye, Mining Periodic behaviors for Moving Objects, KDD’10, July 25–28, 2010.
[12]Felipe Alonso-Atienzaa, José Luis Rojo- Álvareza and Alfredo Rosado-Muñoz b,
Feature selection using support vector machines and bootstrap methods for ventricular fibrillation detection, Elseiver ,2011.
[13] Liao, S.-C. and I.-N. Lee, Appropriate medical data categorization for data mining classification techniques. MED. INFORM., 2002. Vol. 27, no. 1, 59–67.
[14]Porter, T. and B. Green, Identifying Diabetic Patients: A Data Mining Approach. Americans Conference on Information Systems, 2009.
[15]Panzarasa, S., et al., Data mining technique for analyzing stroke care processes. Proceedings of the 13th World Congress on Medical Informatics, 2010.
[16] Li L, T.H., Wu Z, Gong J, Gruidl M, Zou J,Tockman M, Clark RA, Data mining techniques for cancer detection using serum proteomic profiling. Artificial Intelligence in Medicine, Elsevier, 2004.
[17] Das, R., I. Turkoglu, and A. Sengur, Effective diagnosis of heart disease through neural networks ensembles. Expert Systems with Applications, Elsevier, 2009. 36 (2009): p.7675–7680.
[18]Andreeva, P., Data Modelling and Specific Rule Generation via Data Mining Techniques.International Conference on Computer Systems and Technologies – CompSysTech, 2006.
[19]Marina Sokolova, Guy Lapalme b, A systematic analysis of performance measures for classification tasks, Information Processing and Management 45 (2009) 427– 437.
![figure 12. [1] DunjaMladenić, Janez Brank, Marko Grobelni](https://thumb-us.123doks.com/thumbv2/123dok_us/8912092.959846/8.595.88.514.513.736/figure-dunjamladenic-janez-brank-marko-grobelni.webp)
