AN SOA APPROACH FOR MEASURING ALIGNMENT
BETWEEN ENTERPRISE REQUIREMENTS AND ERP
SYSTEM
BENGOUD KENZA, BENMOUSSA RACHID,SAIB SARA, ABD ACHRAF
Information logistic and production systems Team, National School of applied sciences (ENSA), Cadi Ayad University-Marrakech, Abdelkarim Khatabi Avenue, BP 575, Morocco E-mail: [email protected], [email protected] , [email protected] ,
ABSTRACT
The implementation of Enterprise Resource Planning (ERP) system within companies is increasingly current. Despite the potential benefits that ERP systems provide, these projects are risky. In fact, many ERP integration projects fail because the system is not aligned to adopting organization’s requirements. This paper proposes criteria and metrics that allow measuring alignment between enterprise requirements and ERP functionalities in order to quantify the extent of the fit between the business and the ERP system. We used SOA (service oriented architecture) formalism to model both the ERP system and the enterprise requirements. We illustrate how to derive service oriented business process model and service oriented ERP process model from business process model and ERP process model, respectively. This derivation is essentially deduced from a set of rules based on the concepts of the business process meta-model and SOA meta-model. On the other hand, we used the pair of resulting SOA models as inputs for the alignment measurement process. Finally, we illustrate our proposals with a case study.
Keywords: Alignment Relationship, Business Processes, ERP, Measure, Metric, SOA
1. INTRODUCTION
Nowadays’ industry, competition imposes to companies constraints in term of product quality and associated services. Thus, for these businesses, success means producing the best product at the lowest price and just in time. These new challenges of competitiveness have led to the business leaders to adopt new strategies in the management of different processes. To be competitive in the market and to satisfy demanding consumers, companies must adopt strategies that aim to consider consumers satisfaction, reduce time to product development, but they must also face the fast development of technology.
All major companies rely on integrated software to ensure the execution of their activities. For example, ERP (Enterprise resource Planning) software links all functionalities of an organization including order management, manufacturing, human resources, financial systems, and distribution with external suppliers and consumers into a high integrated system with shared data and visibility [1],[2].
Existing works on alignment are varied depending on the application domain. They treat three mean issues: i)The construction of the alignment, ii)The evaluation of the alignment between the concerned entities and iii)The evolution or correction of the alignment when one of the entities evolves [3]-[8].
In our research, we are particularly interested in evaluating the degree of alignment between two entities: enterprise business processes and ERP system. Our goals are: a) modeling both business processes and the ERP functionalities in the same modeling conventions to avoid the conceptual discordance between the business and ERP system and b) measuring the alignment relationship using metrics.
To achieve our first goal we base our proposal on the use of service concept as defined in SOA (Service oriented architecture). It’s to apply SOA formalism to model both the ERP system and the enterprise requirements in SOA terms. Thus, we propose a transformation process of both business process model and ERP process model to SOA models. Concerning the second goal, we propose criteria and metrics that allow measuring the alignment relationship between business processes and ERP functionalities in order to quantify to which extent there is a fit between the business and ERP system. We use the pair of SOA models representing ERP functionalities and business processes as inputs for the alignment measure process.
The remainder of this paper is structured as follow: section 2 discusses some related works; section 3 presents the proposed methodological framework. Section 4 introduced the modeling concepts of the business process model and ERP process model. Section 5 describes the transformation process of both enterprise business process model and ERP process model to SOA models. In section 6 criteria and associated metrics that allow evaluating alignment between ERP functionalities and business processes are presented. Section 7 illustrates the proposed approach with a case study. Finally, section8 concludes and presents the perspectives of this paper.
2. RELATED WORK
In the literature, there are some research works dealing with the evaluation of alignment. Soffer et al [9] suggests that the evaluation of alignment requires measuring alignment relationship between the concerned entities. Bodhuin et al. [10] used metrics to evaluate the
alignment between business processes and the supporting software system. They propose two metrics: Technological Coverage (TC) to specify the percentage of process activities adequately supported by a software system and Technological Adequacy (TA) to indicate the rate adequacy between components of a given activity and system. These tow metrics seem to be insufficient. To measure the alignment between business processes and an information system in general Anne et al. [11] proceed in three steps: i) definition of generic metrics between construct of meta-models inspired from the bunge-wand-weber ontology and Soffer-Wand ontology representing the system(SRAM) and the business (BPRAM), respectively. ii) The instantiation of the metrics to specific meta-models that represent the business and system. iii) The adaptation of the metrics to specific models representing the business and system. The method proposed by Anne et al. represents an important contribution in the evaluation of the alignment. However, the generation process of generic metrics proposed relies on two generic meta-models that are theoretical (SRAM and BPRAM) and the specific metrics generation process is very long.
Zoukar [12] adopts a similar approach by analyzing the similarities between enterprise requirements and ERP functionalities. He used map models, which are expressed in intentional terms, to model business processes and ERP functionalities. The key concepts of map models are intentions (or goal to achieve), strategies and sections which are the path between source intention and target intention. The intentional character of the map model does not consider the analysis of similarities at the operational level. On the other hand the actors who can achieve an intention or choose a strategy are not considered in the map model.
Others works suggest other approaches. For example Soffer et al. [13] propose a requirement driven approach to the alignment problem. They use an automated algorithm that matches a model of the enterprise requirements with a model of the ERP system capabilities. These models are expressed in OPM (Object-Process Methodology) terms. Other authors had suggested a “requirement driven approach” based on the use of the map model to match the requirements model with an ERP model [6], [14].
normalized and standard approach. It has emerged as a major theme for business information systems and ERP systems. 2) SOA provides a fairly complete structure for the business processes and a separation of concerns 3) The application of SOA approach to model both business processes and ERP system capabilities in the same modeling conventions will enable to solve the issue of conceptual discordance. 4) The SOA permits the comparison of a large quantity of information relating to ERP system capabilities and enterprise requirements. 5) The metrics are not expressed in natural language as proposed by Bodhuin [10] or in intentional terms, but rely on formal concepts that are clearly defined and detailed.
3. METHODOLOGICAL FRAMEWORK
In this section, we firstly detail our general methodological framework based on concept of service as defined in SOA formalism. Secondly, we present our contribution. The general steps of the proposed methodology are presented in figure 1 and
can be listed as follows.
Step1: Consists in applying SOA formalism to model both the ERP system and the enterprise requirements in the same modeling language.
Step 2: concerns a comparison process carried out between two models expressed in SOA terms, the first represents the enterprise requirements and the second the ERP system capabilities. This will be done by proposing metrics that allow measuring the alignment relationship between business processes and ERP functionalities.
Step 3: concerns the effective integration of ERP system if the entities are aligned. Other ways the step 4 should be conducted.
Step 4: concerns the adaptation process which will concern the business process reengineering (BPR) or the configuration strategy.
Figure1: Methodological framework
In this paper we focus on the steps 1 and 2 of the methodology. Firstly, we define in detail the concepts modeling of business process model and ERP process model. Secondly, we illustrate how to deduce, using transformations rules, SOA models related to service oriented business process model and service oriented ERP process model, respectively. Thirdly, we show how to use the pair of resulting SOA models to generate our metrics.
4. MODELING CONCEPTS OF BUSINESS
PROCESS MODEL AND ERP PROCESS MODEL
The concept of process exists in several scientific and applicative domains [15]. It is necessary to model it because it is the core of the migration to SOA approach. The identification of services must start from the definition (or the formalization) of processes in order to define the services necessary to achieve theses processes. Thus, we find in the literature several definitions that represent the process [15], [16] and a multitude of modeling formalism (Cimosa, Grai, Idef, BPMN…) allowing efficient modeling of processes.
The most of formalisms are based on the concepts of activities, task, role, event, etc. In our approach, we expressed the ERP system model and the enterprise requirements model in business terms since they are related to business issues. Figure 2
describes the proposed business process meta-model. It presents the modeling concepts of business process model and the ERP process model in business terms, which are described as follow:
Figure1: Business Process Meta-Model
Macro-process: is formed by a set of
processes that contribute to the achievement of its result. The result of a macro-process is to produce one or more external deliverables which are useful to one or more partners outside the company (customer, supplier, etc.). The main characteristics that identify a macro processes are:
- External deliverable
- Key success factors: criteria used to measure the macro-process performance. Strategic objectives are defined for these factors. They are followed by performance indicators.
Process: is composed by a set of
inter-related activities that contribute to the achievement of its result. The result of a process is to produce one or more deliverables appreciable by internal actors of the company (service, human, machines, etc.). The characteristics that define a process are: - Internal deliverable.
- Key factor of process(KFP): criteria used to measure the process performance. Process objectives are defined
for these factors. They are followed by performance indicators.
- Type of the process: primary (contributes to the direct achievement of the deliverable), secondary (contribute to the indirect achievement of the deliverable) or control (control a primary process or secondary process).
- Event: stimuli that cause a reaction in the process. - Resources: non consumable elements common to all activities of the process necessary for their
implementation.
- Actors: active element responsible for piloting the process.
Activity: is composed by a set of
operational tasks organized in a given order to participate in the realization of the process deliverable. The activity generates an intermediate result that has no value to external and internal actors. The main characteristics that identify an activity are:
- Intermediate result.
- Key factor of progress (KFPg): criteria used to measure the performance of the intermediate result. Progress objectives are defined for these factors. They are followed by performance indicators. - Input: elements which will be transformed during the execution of the process.
- Resources: non consumable elements common to all the tasks of the activity necessary for their execution.
-Transition: is an oriented link between two activities. It’s to represent a sequence of several activities.
- Actors: active elements responsible for piloting the activity.
Task: is formed by a set of operational actions chained in a given order to participate in the production of the activity result. It’s the smallest element of the decomposition. The main characteristics that identify a task are:
- Operating result.
- Lever action: criteria used to measure the performance of the operational result, local objectives are defined for these factors. They are followed by performance indicators.
- Resources: non consumable elements own to the task, necessary for its execution.
-Actors: active elements responsible for operational actions of the task.
5. TRANFORMATION PROCESS OF
BUSINESS PROCESS MODEL AND ERP PROCESS MODEL TO SOA MODELS
In this section, we start by presenting our transformation process that allows the transformation of both business process model and ERP process model to SOA models. Then we detail each step in the remaining parts of this section. The general steps of the proposed transformation process can be listed as follows:
Step1: Business process meta-model,
modelizing both enterprise requirements and ERP system which are detailed in Fig. 2.
Step2: Modeling of SOA. This step is detailed in fig.3.
Step3: Specification of transformation rules
between business process concepts and SOA concepts.
The steps 2 and 3 are more detailed in sessions 5.1 and 5.2, respectively.
5.1 SOA MetaModel
The SOA approach is proposed as a crucial architecture of information systems for companies. It is a model that defined a system by a set of distributed software services which operate independently in order to achieve overall functionality [17]. SOA allows the encapsulation of functionalities of an information system into a set of loosely coupled services belonging to the business level and technical level of the company. The basic brick of SOA is the service. Many publications in the literature have dealt with the SOA approach [15, 18-20]. Inspired from these publications we could establish our SOA meta-model presented in Figure3. This meta-meta-model is expressed in expressed in UML formalism. It
defines the behavior, the composition and the interface of the service.
5.1.1 Service composition
Figure 3 highlights the main concepts of service oriented architecture. The key element of SOA meta-model is the enterprise service that aims to reply to the defined concerns by achieving certain treatments. An enterprise service is refined into two concepts that are business services and IT services. Business services are the services that make sense to the expert business and are derived from the analysis and modeling of business processes. The IT services combine the features offered by the computerized information system and are used by business services described above. In the SOA approach, services granularity is characteristic of the service. One can distinguish coarse, medium and fine grained services. Coarse-grained services access the finer grained services to execute their treatments. Thus, we can distinguish four types of business services:
CRUD services that focus on universal
operation of manipulation of information that are Create, Read, Update and Delete. These CRUD services are important because they are strongly reusable by business solutions.
Functional services that have medium
granularity and have the task of encapsulating all or part of management rules and business treatments. A functional service relies on CRUD services to read business information that they need and/or the business that have modified/created.
Composite services that have coarse
granularity and orchestrate functional services that use services of lower level (CRUD and technical services) to execute its treatments.
Macro-service is a business service of a
high level, directly related to the composite applications. It orchestrates a set of composite services.
5.1.2 Service interface
It allows the characterization of the service in an external point of view. It includes the goal that the service is trying to achieve and all treatments called operations specifying the manner that the service satisfies its goal. We can assign one or more operations to a business service.
5.1.3 Service behavior
Figure3: SOA Meta-Model
information and significant characteristics for the service users, such as purposes, constraints, contract expiration time, quality of service, etc. Considering the interaction nature of the services, the service contract must include pre and post condition that these services must fill. These conditions correspond on the state of the objects manipulated by the input and the output parameters.
5.2 Specification Of Transformation Rules
In our transformation process we establish first a mapping between the different elements of business process meta-model and SOA meta-model presented previously.
Table1: Mapping From Business Process Concepts To SOA Concepts
Business process
concepts SOA concepts
Macro-process Macro-service Process Composite service Activity Functional service
Task CRUD Service
Input Input
Deliverable/result Output
Event Event
Key success factor NFP of macro-service
Key factor of
process NFP of composite service Key factor of
progress NFP of functional service Lever action NFP of CRUD service
This mapping is based on semantic
correspondence between the business level and SOA level. Thus, the transformation model requires the identification of a number of rules based on mapping paradigm between the two related meta-models. In the context of our transformation, the transformation process is based on the fact that the identification of services cannot be disconnected from its use, i.e., the business processes that they serve. In the following, we define the transformation rules between business process concepts to SOA concepts. We chose to structure the mapping presented in the table1 as four rules.
Rule 1: This rule shows the relation
between the « macro-process» and the «macro service». For each macro-process there will be a high level macro-service that will be generated in SOA model that encapsulates the business logic specific to a macro-process, the goal that the macro-process achieves and the orchestration of a set of composite services. One should recall that the macro-process and the macro-service contribute to achieving the strategy of the company in external way. In fact, the macro-process aims to produce an outside deliverable of the company whereas the macro-service aims to execute responsive treatments to exterior requests of the company.
Rule 2: This rule shows the relation
composite service orchestrates functional services to produce an internal goal by satisfying the goals of the orchestrated functional services.
Sub-rule2.1: The sub rule «event» to «event » concerns the event element (in business process meta-model) associated to the stimuli that cause a reaction in the process with the event element (in SOA meta-model) associated to service trigger.
Rule 3: This rule shows the relation
between the « Activity » and the « functional service». It allows us to identify functional services. As already mentioned, functional services are services that expose the notion of function of the information system and allow implementing the concept of business activity [19]. In fact, the activities and functional services generate both an intermediate result that has no value to the company stakeholders (internal and external).
Sub-rule3.1: The sub rule «input» to «input» concerns the input element (in business process meta-model) associated to the elements which will be transformed during the execution of the activity with input element (in SOA meta-model) associated to entries parameters of services.
Rule 4: This rule shows the relation
between the «Task» and the «CRUD service». As already mentioned, a «Task» is the smallest element of the decomposition that aims to produce an operational result whereas a «CRUD service» is a fine grained service which focus on universal operations to execute its treatments. Each «CRUD
service» has in its context an operational goal to attain. Basically operational goals of «CRUD service» should be satisfied by tasks.
In our transformation process, we eliminate the tasks that cannot be encapsulated by services such as the manually performed tasks.
Common Sub-rules: The two following
sub-rules are common to the four above defined rules:
Sub-Rule 1: This sub rule shows that the
key process factor, key Success factor, key progress factor and Lever action elements will be transformed into non functional properties related to macro-service, composite service, functional service and CRUD service, respectively.
Sub-rule 2: The sub-rule « deliverable /
result» to «output» concerns the transformation of “deliverable elements” and result element into output element related to the result generated by the different services.
6. METRICS TO EVALUATE THE DEGREE
OF ALIGNMENT BETWEEN BUSINESS PROCESSES AND ERP SYSTEM
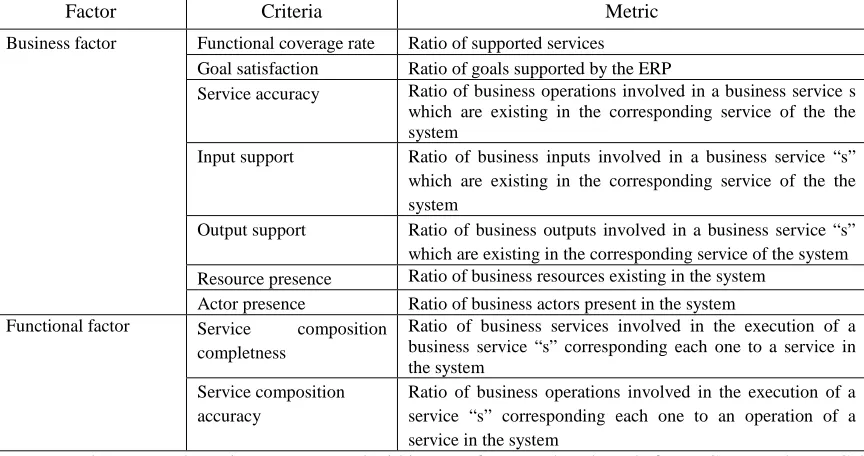
[image:7.612.87.519.494.722.2]This section consists of proposing metrics that allow measuring alignment between business processes and ERP functionalities. As cited above, the “alignment measuring process” is based on two models expressed in SOA terms, one representing the enterprise requirements and the other the ERP system capabilities.
Table 2. Metrics For Measuring Business Process /ERP System Alignment Modeled In SOA Terms
Factor Criteria Metric
Business factor Functional coverage rate Ratio of supported services
Goal satisfaction Ratio of goals supported by the ERP
Service accuracy Ratio of business operations involved in a business service s which are existing in the corresponding service of the the system
Input support Ratio of business inputs involved in a business service “s” which are existing in the corresponding service of the the system
Output support Ratio of business outputs involved in a business service “s” which are existing in the corresponding service of the system Resource presence Ratio of business resources existing in the system
Actor presence Ratio of business actors present in the system Functional factor Service composition
completness
Ratio of business services involved in the execution of a business service “s” corresponding each one to a service in the system
Service composition accuracy
Ratio of business operations involved in the execution of a service “s” corresponding each one to an operation of a service in the system
framework developed for measuring the software quality [21]. This framework is based on three key concepts: Factors, criteria and metrics. The “Factors” concept can be appreciated from external point of view and oriented to decision (completeness, flexibility, adaptability). The “Criteria” concepts are technical properties of the product that can be appreciated from internal point of view (completeness, simplicity, precision). The “Metrics” concepts allow measuring criteria.
Cavano and McCall framework has been applied, in combination with the generic structure of the SOA meta-model, to define our metrics. Based on this idea, we have defined 2 factors along which the alignment can be measured, namely, the business factor and the operational factor. These latter reflect the views according to which the service can be represented and they can be used in identifying the “fit aims”. Each factor has associated criteria which are related to metrics. As shown in Table 2, 9 metrics has been identified.
In the rest of this section, we describe in detail the factors, criteria and metrics.
6.1 Criteria and metrics related to business factor
According to the SOA formalism, the business and the system manipulate both information via services with different granularities. To avoid a misalignment between the business and the system there should be a strong correspondence between business requirements and ERP functionalities. The business factor aims to evaluate in which proportion the system 1) covers all firm’s services necessary to the realization of enterprise business processes and 2) supports firm’s goals. The business factor also aims to evaluate the different terms that characterize the service of a business point of view. We have defined seven criteria that are described and associated with metrics: functional coverage rate, goal satisfaction, service accuracy, input support, output support, Actor presence and resource presence. These criteria are detailed below.
6.1.1 Functional coverage rate (Fcr): To evaluate the “functional coverage rate” it is necessary to identify the number of business services supported by the system. This metric allows us to specify the functional perimeter covered by the system.
The more the coverage rate is high the more the ERP system manages the information needed to support the business. On the contrary, a low rate of this coverage may indicate that some business requirements are not completely supported by the
system. Thus new functionalities should be introduced in the system to cover these new options. The functional coverage rate metric can be
presented as:
or (1)
Where: Sb: set of enterprise services, card(Sb)
number of services contained in Sb
Sbs: set of enterprise services supported by the
system, card(Sbs)=number of enterprise services
contained in Sbs.
A complete definition of the generic fit measurement system can be seen in appendix.
6.1.2 Goal satisfaction (Gs): “goal
Satisfaction” criterion measures to which ratio the system meets the firm’s goals. In other ways the goals which the ERP system Contribute.
If a business goal is not satisfied, this means that the goal is not satisfy by the system or it is only partially satisfied.
6.1.3 Service accuracy (Sa): Service accuracy allows measuring the proportion of service operations (treatments) well managed by the system. A low value noted for service accuracy criterion implies that corrective actions must be taken by adding into the system new functionalities to support the unsupported treatments or operations.
6.1.4 Output support (Os): “Output support”
criterion analyses output information in the system and in the business. It occurs at the functional service level and allows us to identify output misfit. A low value of this metric indicates that an important number of services do not have the same outputs using this system.
6.1.5 Input support (Is): “Input support” criterion identifies input misfit for each functional service. It’ used to check whether each data field needed by the firm exists in the corresponding service of the ERP system. If does not exists, we mark it as an input misfit.
6.1.6 Actor presence (Ap) and resource presence
(Rp): Business processes imply actors and use
resources. Thus, it seems essential to measure the extent to which these are represented in the system. We introduce two criteria namely, “Actor presence” and “resource presence” criteria.
Actor presence (Ap): Presence of actors calculates
Resource presence (Rp): the metric associated to “resource presence” criterion measures the rate of resources used by business process which are supported by the ERP system.
6.2 Criteria and metrics related to functional factor
The functional factor evaluates the alignment by focusing on the way in which service executes its operations, or treatments are supported by the ERP system. This evaluation helps business and system expert to identify the functional misfit between their processes. It also intended to show where misfit lie based on service composition.
The functional factor has two criteria associated to it: service composition completeness (Scc)and the accuracy of the service composition (Sca). It is preferable to calculate these metrics for each type of service except CRUD services because they have fine granularity.
6.2.1 Service composition Completeness (Scc):
Service composition criterion allows us to study in detail the execution of each service For example, if we are interested in a given service S1, this criterion evaluates in what proportion the services S1.1, S1.2, S1.3 involved in the execution of S1 are supported by the system. The criterion also evaluates how these services (S1.1, S1.2, S1.3) are involved in the execution of the corresponding service of S1.
6.2.2 Service composition accuracy (SCa): this criterion evaluates the degree to which a given business service are supported by the system. This is by measuring the operations of services (treatments) involved in the execution of a given service S. A low value of this criterion signals some inconsistency in the representation of the information in system. Corrective actions must be taken either by adding operations in some services or by drawing some operations that are not used by the business services.
6.3 Metric analysis
In order to properly analyze the obtained value of each metric, it’s necessary to compare each value with the threshold value. It’s a value below which the alignment is badly considered and requires the implementation of corrective actions [6]. The threshold is set by the decision makers based on their assessment of the project and their vision of the alignment. Corrective actions must be performed on the different elements involved in the metric. This is by searching if the business requirements that are not supported by the system must be kept in the business or by adding new
features to the system level to support new options that are not covered.
7. A CASE STUDY
In this section, we illustrate the usage of our approach in an industrial case study. This latter aims to show how measurements are calculated and interpreted.
7.1 Case study description
Somacous Company is a manufacturer of couscous and pasta since 1996. The company is a leader in its sector thanks to its wide geographic range, and logistics based on a specialized sales force by channel. Opting for a policy of decentralization and targeting in large cities in southern Morocco, the enterprise ensures the supply of these products to all its customers thanks to its outlets: wholesalers, semi wholesalers, retailers. There are 40 employees in the entire enterprise.
To satisfy its customers and to ensure effective missions in the areas of logistics, supplying and industrial production, Somacous direction wishes to have an efficient information system adapted to the demands of its environment. The objective of the project is to contribute to the optimization of macro-process Couscous in charge of producing and delivering the couscous to customers from the expression of needs by customers to the reception of product and the invoicing. The project perimeter covers the management of sales, delivery management, the purchasing management, inventory management, manufacturing management, accounting and financial management.
The actors concerned by this project are varied: production, storage, purchasing and sales units.
Before implementing a ERP solution, we suggeted to use our approach in order to evaluate to which extent there is a fit between the business and ERP functionalities.
The project perimeter being very broad, we limited the scope of this study by applying our approach to sales management process. The requirements for this process are modeled using a BPMN diagram. The chosen ERP is OpenERP. The functionalities OpenErp for this process are modeled using a BPMN diagram.
7.2 Description of "sale enterprise business process " and " OpenERP sale process"
identify the services necessary for the realization of these processes. In the following, we will first present a general description of each business process using BPMN (Business Process Modeling Notation) standard then we will identify the different concepts manipulated in each process based on modeling concepts of enterprise business process and ERP process presented in section 4.
7.2.1 Modeling of sale enterprise business process
The figure 4 shows the general structure of the sale business process using a BPMN diagram.
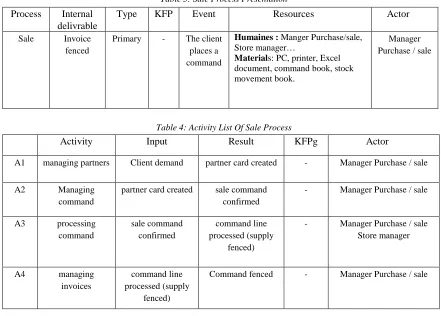
[image:10.612.82.523.238.554.2]The business sale process counts four activities namely managing partners (from the customer's request until partner card created), managing command (from the creation of a new command until the confirmation of the command) processing command (from checking command line until supply fenced) and managing invoices (from the creation of invoice until command fenced). Each activity is composed of several tasks. In the following, as shown in table 3, 4 and 5, we present the different concepts manipulated in sale process.
Table 3: Sale Process Presentation
Process Internal delivrable
Type KFP Event Resources Actor
Sale Invoice fenced
Primary - The client places a command
Humaines : Manger Purchase/sale, Store manager…
Materials: PC, printer, Excel document, command book, stock movement book.
Manager Purchase / sale
Table 4: Activity List Of Sale Process
Activity Input Result KFPg Actor
A1 managing partners Client demand partner card created - Manager Purchase / sale
A2 Managing
command
partner card created sale command confirmed
- Manager Purchase / sale
A3 processing command
sale command confirmed
command line processed (supply
fenced)
- Manager Purchase / sale Store manager
A4 managing
invoices
command line processed (supply
fenced)
Notice that for sake of space, the different activities manipulated in the sale process were not entirely represented. We limited ourselves to a part of sale
process namely managing command activity: from the creation of a new command until the confirmation of the command
Table 5: Task List Of Managing Command Activity
Task Description Actor Resource Operational result
T1 Create
command
Edit a command from command book
Manager Purchase / sale
ExcelDocument /Command book
Command created
T2 Estimate the time of the
command
Estimate the time required of the
command
Manager Purchase / sale Store manager
analysis of previous similar
delivery
Time of the command estimated
T3 Sending quotation to
client
Envoi du devis au client
Manager Purchase / sale
Quotation sent to client
T4 Confirm command
Confirmation of the sale command
following the agreement of the client
Manager Purchase / sale
Book of command Sale command confirmed
7.2.2 Modeling of sale process of OpenERP
Based on BPMN diagram of sale process performed by SYNERPGY [22], a company specializing in the integration and hosting of OpenERP free software and in combination with the software official documentation, we present OpenERP
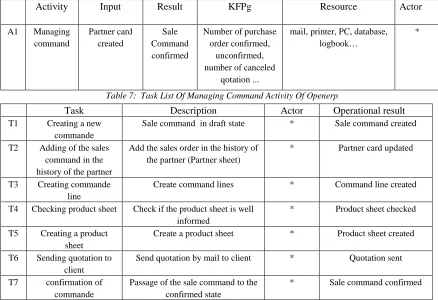
[image:12.612.87.539.152.346.2]functionalities for managing command activity selected in this study: from the creation of a new command until the confirmation of the sale commande. (As shown in table 6 and table 7)
Table 6: Managing Commande Activity Of Openerp
Activity Input Result KFPg Resource Actor
A1 Managing command
Partner card created
Sale Command confirmed
Number of purchase order confirmed,
unconfirmed, number of canceled
qotation ...
mail, printer, PC, database, logbook…
*
Table 7: Task List Of Managing Command Activity Of Openerp
Task Description Actor Operational result
T1 Creating a new commande
Sale command in draft state * Sale command created
T2 Adding of the sales command in the history of the partner
Add the sales order in the history of the partner (Partner sheet)
* Partner card updated
T3 Creating commande line
Create command lines * Command line created
T4 Checking product sheet Check if the product sheet is well informed
* Product sheet checked
T5 Creating a product sheet
Create a product sheet * Product sheet created
T6 Sending quotation to client
Send quotation by mail to client * Quotation sent
T7 confirmation of commande
Passage of the sale command to the confirmed state
[image:12.612.84.522.425.725.2]* The definition of system users is performed once the system is operational. OpenERP allows to constitute users groups, each group has access to a number of views.
Synthesis :
The analysis developed on the OpenERP sale process showed that ERP systems are much more numerous and richer in terms of functionality insofar a ERP offers generic solutions to parameterize depending on the company. However, the analysis made on the sale enterprise business process has identified the following observations:
1. The majority of work in Somacous is done through phone calls and Excel document.
2. The sale process has no performance indicator. It has a Initial maturity level: the practices are neither formalized nor systemic, the results depend mainly on the actors which makes the process unstable.
3. the command book does not reflect the real state of commands and it is considered as a production program.
4. Absence of any strategic vision for the sale process (No scoreboard, performance indicators ...).
7.2 The identification of services
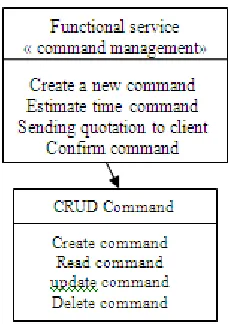
[image:13.612.315.519.69.249.2]The figures 5 and 6 show the services generated after applying the transformation rules R3 &R4 to managing command activity and the associated tasks: from the creation of a new command until the confirmation of the command.
[image:13.612.139.254.491.653.2]Figure 5: Services identified from managing command activity of sale business process
Figure 6: Services identified from managing command activity of sale process of Openerp
7.3 Measuring the alignment
From the SOA models presented previously, we identified the different concepts used in services in particular those involved in the calculation of the metric. Thus, for example, the functional service “managing command ” calls the CRUD service “command” to perform its treatments, “create a new command” is an operation of the functional service “managing command” corresponding to the creation of the
demand in the concerned repository, “partner card
created” is an input of the functional service and so on. Weproceeded in this way for all elements. As a result, the process is composed of services; goals are defined for these services, operations, etc... The metrics can then be applied based on their definitions. For instance, for the functional coverage rate we count the total number of business services covered by the system.
Table8: Alignment measures
Criteria Measures
Functional coverage rate Goal satisfaction Service accuracy Input support Output support Resource presence Actor presence
Service composition completness Service composition accuracy
1 (2/2) 1 (2/2) 0.75 (3/4) 1(1/1) 0.75 (3/4) 1(1/1)
Can not be calculated
1(1/1) 1 (4/4)
The functional coverage rate is high with 100% of the business service being supported by
the system. This confirms that OpenErp offers a
wide functional coverage regarding the managing command activity. However, some measures are inferior to 100%. The service accuracy measure is about 75% as well as the output support. “Estimating the time required for each command” functionality is not possible in the system and this has repercussion on the output support.
In order to raise the value of the service accuracy, “Estimating the time required for each command” should be added as a functionality in the system. Moreover, the company wishes to have a computerized technique based on the analysis of similar delivery which will require specific developments in the system to support this business functionality of Somacous.
“Sending quotation to client” is currently manually done: A person has to deliver the quotation to client. It’s necessary to automate this functionality and thus to Send quotation automatically to client
The identification of resources which are necessary for the execution of business processes was an extremely difficult task in our case. The goal is to identify all resources (material, method, human or information) present in the sytem. Indeed, to achieve a goal we note that almost all resources were used.
Actor presence criterion can not be calculated. The definition of system users is performed once the system is operational. OpenERP allows to constitute users groups, each group has access to a number of views.
Synthesis
As a result of this case study, we drawn the following conclusions:
- The needs of the organization can be satisfied by the standard functionalities of ERP.
- The needs of the organization can not be satisfied by the ERP system which will require specific developments in the new system to implement.
- Functionalities and additional options of ERP whose organization has not identified the need but which are finally judged interesting.
8. CONCLUSION
The issue of alignment between ERP functionalities and business processes is at the heart of ERP system implementation. It consists not only to choose the better ERP system available in the
market, but to better reply to the needs and expectation of the organization.
Our SOA framework presented in this paper provides a systematic support to business and system experts. With this approach, organizations can easily determine the location of possible misfits before implementing an ERP and then making decisions to improve the system and/or the business when the level of alignment is evaluated as insufficient.
The paper illustrated the use of proposed metrics. It was shown 1) how to analyze and represent business processes and ERP processes. 2) how to transform them to SOA models 3) how to use SOA models to generate metrics and discuss the level of fit in a concrete information system application.
The proposed metrics allow to measure different aspects of alignment relationship. They are organized into factors and criteria and are based on the use of SOA models that represent both the enterprise requirements and the ERP system capabilities. The proposed metrics give criteria that allow identifying the alignment degree.
In our approach, to quantify the extent of the fit between the business and the ERP system, we based our measures on models and thus, their efficiency is subject to the fact that the models represent accurately the reality of the business and the system.
APPENDIX
Criterion Metric Definition
Functional Coverage rate (Fcr)
Number of services supported by the system / Number of services Fcr=card(Sbs)/card(Sb)
- Sb: set of enterprise services - Ss: set of system services, Sbs: set of enterprise services covered by the system.
Goal Satisfaction (Gs)
Number of business goals satisfied by the system / number of business goals Gs=card(Gbs)/ card(Bg)
- Gb: set of business goals - Gs:set of system goals - Gbs set of business goals satisfied by the the system
Service accuracy(Sa)
Number of business operations covered by the system / Number of business operation Sa=card(Obs)/ card(Ob)
- Ob: set of business operations involved in a business service s - Obs set of business operations involved in a business service s which are existing in the corresponding service of the system
Input support (Is)
Number of business inputs covered by the system/Number of business input Is= card(Ibs)/card(Ib)
-Ib: set of business inputs involved in a business service s – Ibs: set of business inputs involved in a business service s which are existing in the corresponding service of the system
Output support (Os)
Number of business ouputs covered by the system/Number of business outputs Os=card(Obs)/card(Ob)
-Ob: set of business outputs involved in a business service s – Obs: set of outputs involved in a business service s which are existing in the corresponding service of the system
Actor presence (Ap)
Number of business actors present in the system/Number of business actors. Ap=card(Abs)/card(SAb)
-Ab: set of business actors– Ss: set of system actors – Abs: set of business actors present in the system
resource presence (Rp)
Number of business resources used by business process supported by the system/Number of business resources Rp=card(Rbs)/card(Rb)
-Rb: set of business resources – Rs:set of system resources – Rbs: set of business resources existing in the system
Service composition (Scc)
Number of business services involved in the execution of a business service “s” corresponding each one to a service in the system /Number of business services involved in the execution of “s” Sc=car(Sbs)/card(Sb)
-Sb: set of business services involved in the execution of a business service s – Ss: set of system services - Sbs: set of business services involved in the execution of a service “s” corresponding each one to a service in the system
Service composition accuracy(Sca)
Number of operations of services involved in the execution of a service “s” corresponding each one to an operation of a service in the system / number of business operation of services involved in the execution of “s” SCa=card(Obs)card(Ob)
- Ob: set of operations of services involved in the execution of a service “s”- Obs: set of operations of services involved in the execution of a service “s” corresponding each one to an operation of a service in the system
REFRENCES:
[1] P. Iskanius, “The ERP Project Risk Assessment – A case study,” in Proceedings of the World
Congress on Engineering, 2009, pp. 647–664.
[2] S. Kang, J. H. Park and H. D. Yang, “ERP alignment for positive business perfomance: Evidence from Korea’s ERP market,” Journal
of Computer Information Systems, Vol. 48,
2008, pp. 25-38.
[3]A. Etien, “Ingénierie de l’alignement: Concepts, Modèles et processus-La méthode ACEM pour l’alignement d’un système d’information aux processus d’entreprise,” Ph.D. Dissertation,
Paris1 university-Sorbonne-France, 2006.
[4] I. Zoukar, C. Salinesi and C. Rolland, “Evolution du système d’information par l’implantation d’un Progiciel de Gestion Intégrée,”
Décision, 2004.
[5] G. Regev and A. Wegmann, “Remaining Fit: On the Creation and Maintenance of Fit,” in Proceedings of BPMDS Workshop on Creating and Maintaining the Fit between Business
Processes and Support Systems, 2004, pp.
131-137.
[6] C. Rolland and N. Prakash, “Bridging the gap between organizational needs and ERP functionality,” Requirements Engineering
journal, Vol. 5, 2000, pp. 180-193.
[7] C. Salinesi and C. Rolland, “Fitting business models to system functionality exploring the fitness relationship,” in Proceedings of 15th International Conference on Advanced
Information Systems Engineering (LNCS2681),
2003, pp. 647–664.
[8] A. Wegmann, P. Balabko, S. E. Le, G. Regev and I. Rychkova, "A Method and Tool for Business-IT Alignment in Enterprise Architecture," in Proceedings of CAiSE`05 , 2005, pp. 113-118.
[9] P. Soffer, “Fit Measurement: How to Distinguish Between Fit and Misfit,” note for
BPMDS'04, Workshop on Creating and Maintaining the Fit between Business
Processes and Support Systems, 2004.
[10] T. Bodhuin, R. Esposito, C. Pacelli and M. Tortorella, “Impact Analysis for Supporting the Co-Evolution of Business Processes and Supporting Software Systems,” in Proceedings of BPMDS’04, Workshop on Creating and Maintaining the Fit between Business
Processes and Support Systems, 2004.
[11] A. Etien, and C. Rolland, “Measuring the fitness relationship,” Requirement Enginnering
Journal, Vol. 10, 2005, pp. 184-197.
[12 I. Zoukar and C. Salinesi, “Engineering the Fitness Relationship between an ERP and the Supply Chain Process at SNCF,” in Proceeding of International Conference on the Information
Resource Management Association, 2004.
[13] P. Soffer, B. Golany and D. Dori, “Aligning an ERP system with enterprise requirements: An object-process based approach,” Computers in
industry, Vol. 56, 2005, pp. 639-662.
[14 C. Rolland and N. Prakash, “Matching ERP system functionality to customer requirements,” in Proceedings of Fifth IEEE International Symposium on Requirements
Engineering, IEEE Press, 2001, pp. 66–75.
[15 S. Chaari, “Interconnexion des processus interentreprises : Une approche orientée à base
services adaptables,” Ph.D. Dissertation,
National Institue of Applied Science, 2008.
[16] X. Fournier-Morel, P. Grojean, G. Plouin and C. Rognon, “Processus métiers et systems d’information-
Gouvernance,management,modélisation”, Dunod, Paris, 2011.
[17] F.J. Moomena, “ Modélisation des architectures logicielles dynamiques : Application à la gestion de la qualité des services des applications à base des services web,” Ph.D. Dissertation, National
Polytechnic Institute of Toulouse-France, 2007.
[18] K. Boukadi, “Coopération interentreprises à la demande :Une approche flexible à base de services adaptables,” Ph.D. Dissertation, Higher National School of
Mines-Saint-Étienne-France, 2009.
[19] X. Fournier-Morel, P. Grojean, G. Plouin and C. Rognon, “SOA- Le guide de l’architecte du SI,” Dunod, Paris, 2008.
[20] M. Lopez-Sanz, C. J. Acuna, C. E. Cuestaa, and E. Marcos, E.“Modeling of service oriented architecture with UML,” Electronic
Notes in Theoretical Computer Science, Vol.
194, 2008, pp. 23-37.
[21] J. P. Cavano and J. A. McCall, “A frame work for the measurement of software quality,” in
Proceeding of the software quality assurance workshop on Functional and performance
issues, 1978, pp. 133-139.